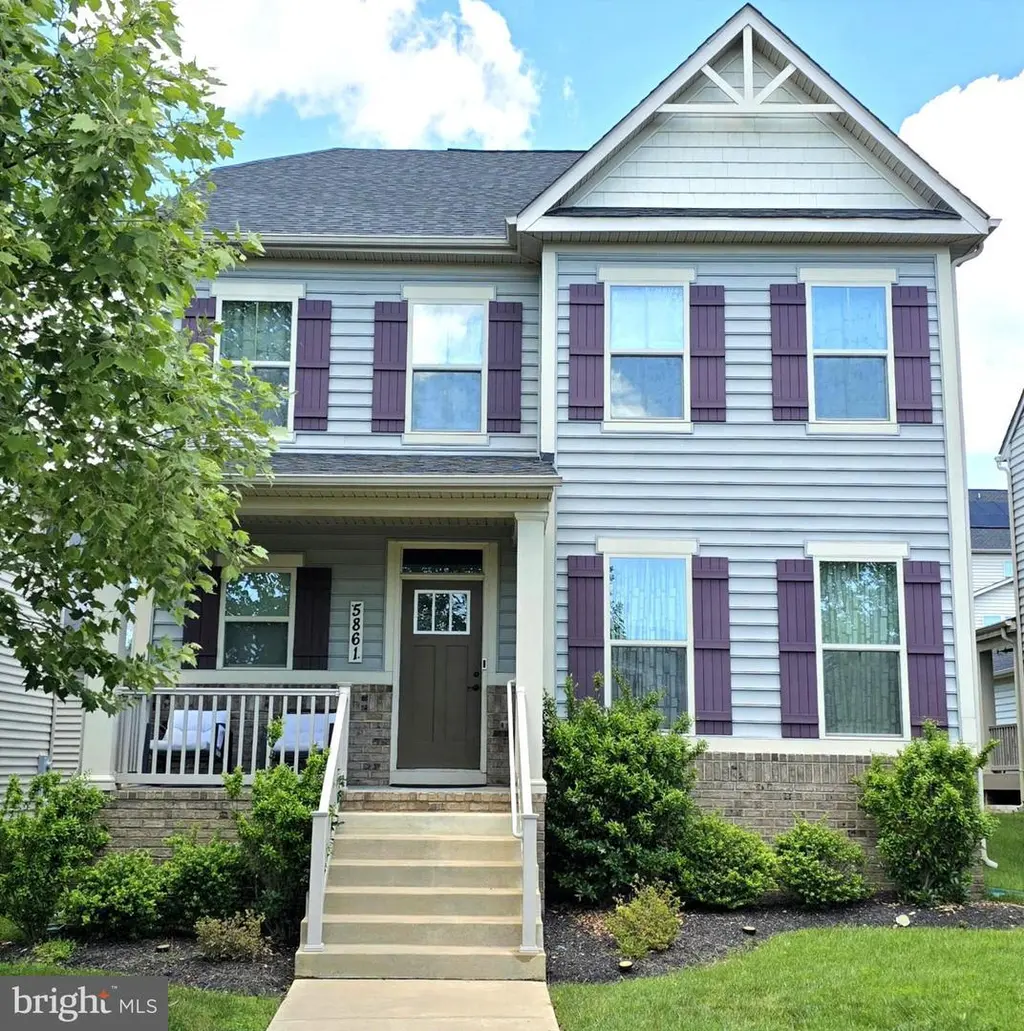
5861 Oakdale Village Rd · Linganore, MD
Flood risk 1/10 · Minimal
- FEMA flood zone
- X (unshaded)
- Chance of flooding over 30 yrs
- 0.0%
- Est. flood insurance / yr
- $473 – $860
Fire risk 1/10 · Minimal
- Est. fire insurance / yr
- $755 – $1,403
Heat risk 6/10 · Moderate
- Hot days now (above 103°F)
- 7 days/yr
- Hot days in 30 yrs
- 16 days/yr
Wind risk 4/10 · Minor
- Chance of severe wind over 30 yrs
- 8.0%
Air-quality risk 2/10 · Minimal
- Unhealthy air days now
- 1 days/yr
- Unhealthy air days in 30 yrs
- 1 days/yr
Risk factors via First Street. Map © Google.
Why this score? — see what drove the F grade
The composite is a weighted blend of 9 inputs, each scored 0–100. Each bar is that input's sub-score; the figure is the points it added to the 100-point composite (weight × sub-score).
- Cash flow +5.2/30.0
- Schools +3.4/10.0
- Livability +3.2/5.0
- Rent growth +2.5/5.0
- Condition / age +2.5/5.0
- 1% rule +0.3/10.0
- DSCR +0.0/10.0
- ARV discount +0.0/15.0
- Appreciation +0.0/10.0
$799,990
🖨 Deal sheet (PDF) 📄 Offer letter ✓ Due diligence
Listing remarks MLS
Contemporary Salinger floor plan built to customer's specifications. Featuring over 3,000 sq. ft. 2 car rear attached garage, 5 bedrooms, 4.5 baths, gourmet kitchen, stainless steel appliances, granite counter tops, hardwood throughout entire main level. Images Shown Are Representative Only.
Key facts
- 5,400 sq ft lot
- 2 garage spots
- Built 2018
Property features AI
Finance
- Other: Irrigation water rights; Below-grade finished area approximately 1,200 (finished basement ~95%); Above-grade finished area approximately 3,380
- HOA & community: HOA fee of $84 per month; HOA includes trash and snow removal; Community amenities include bike trail, common grounds, jogging/walking path, and playgrounds
Exterior
- Parking: Rear-entry attached garage with 2 garage spaces; Asphalt driveway with 2 driveway spaces; 3 off-street spaces; Total of 7 garage and parking spaces
- Utilities: Public water; Public sewer; Underground utilities
- Home design: Detached home; Excellent property condition; Built by RYAN HOMES; Shingle roof; Not in a federal flood zone; Fee simple ownership
- Construction: Frame construction; Concrete perimeter foundation; Double-pane insulated vinyl-clad windows with screens; Year built (source: assessor)
- Exterior features: Porch(es); Sidewalks; Landscaping; Above-grade and below-grade outdoor structures
Interior
- Kitchen: Dishwasher; Disposal; Icemaker; Microwave; Self-cleaning oven; Cooktop; Wall oven; Refrigerator; Water dispenser
- Bedrooms: Five bedrooms on the upper level
- Bathrooms: Four full bathrooms; One half bathroom; Three full bathrooms on the main upper level; One full bathroom on lower level
- Heating & cooling: Forced air heating; Natural gas heating fuel; Central air conditioning; Electric cooling fuel; Tankless natural gas hot water
- Interior features: Open floor plan with family room off the kitchen; Kitchen with table/breakfast area; Dining area; Upgraded countertops; 9'+ ceilings; Drywall walls and ceilings; Insulated doors
- Laundry & utility: Washer; Dryer
Neighborhood map
What this means for you Summary
Snapshot
- This is a 5-bed/4.5-bath single-family listed at $800k.
Deal economics
- At list price, monthly cash flow is $-2k ($-22k/yr) — negative.
- To cash-flow at today's rent, offer at most $477k (40.4% below list).
- To meet the 1% rule (rent ≥ 1% of price), the offer needs to be $426k (46.8% below list).
- Recommended offer: $426k (46.8% below list) — sets the bar for 1% rule.
Location & tenants
- Location reads 65/100 on livability (#257 in MD) — a middle-class / working-renter tenant base. Strengths: employment A+, housing A+, crime B+; Watch: amenities F, commute F, cost of living F.
- Frederick County Public Schools (other): math 27% / reading 43% proficiency, ranked #4 of 24 in MD (top 17%) — families likely to look elsewhere, expect single-tenant / working-renter base with shorter leases.
- Zoned schools: Oakdale Elementary (math 39% / reading 43%, grade F, #92 of 860 statewide, top 11%, 1,028 students, 16% FRL); Oakdale Middle (math 24% / reading 58%, grade F, #20 of 225 statewide, top 10%, 1,057 students, 11% FRL); Oakdale High (math 77% / reading 87%, grade A, #15 of 222 statewide, top 6%, 1,622 students, 14% FRL).
- Zoned-school proficiency averages 55% at this address vs 35% district-wide (+20 pts) — the actual schools serving this property are materially stronger than the Frederick County Public Schools average implies; a family-tenant draw the district grade alone would hide.
- Market conditions: 48 active listings in the ZIP; 7 comparable units currently listed for rent nearby; rentals at typical pace (median 15d on market — plan ~3-4 weeks tenant-placement turnaround); 1,562 units permitted in Frederick County in 2024 (374 in 5+ unit buildings).
Forward outlook
- Local home prices are declining (-3.0%/yr); year-one equity from $6k of loan paydown is wiped out by about $24k of value loss. Plan a longer hold.
- Frederick County population projected at +15% by 2050 — long-run rental-demand tailwind backs the buy-and-hold thesis.
Negotiation context
- Only 13 days on market — expect competitive offers; lowballing is unlikely to land.
- 4 sale attempts since 9y ago; this cycle's ask is 67% above the opening price — seller raised mid-cycle; expect resistance to lowballs.
- Current owner paid $479k; list at $800k implies a 67% gain — meaningful room to come down on a strong offer.
Risks & watch-outs
- Climate carrying-cost: extreme-heat days projected 7→16/yr by 2055 (HVAC capex compounding) — expect insurance premiums to compound above CPI over the hold.
Questions for the listing agent
- What do current leases actually rent for vs. the listed asking? Can we see a recent rent roll and the last 12 months of T-12 income?
- What does the HOA fee cover, when was the last increase, and are there any pending special assessments or reserve-fund shortfalls?
- Is there a deadline driving the sale (1031 exchange, divorce, estate, relocation)? That informs how much negotiation room exists.
- Schools are A-rated — typically a magnet for longer-tenancy family renters. What's the average tenant stay here, and is there a school-zone premium baked into asking?
- The area grade is low — what's the realistic commute time and amenity access for the typical tenant pool here? Any planned neighborhood developments (good or bad) we should know about?
- What's the average days-on-market for RENTAL listings here right now (not sales)? A rising rental-DOM trend means longer vacancies and softer asking-rent achievability than the comps imply.
- What's the recent tenant-quality profile in this submarket — average credit score on applications, eviction rate, late-payment / NSF rate, and stable-employment percentage? A property-management company in the area should have these aggregated.
- How much new for-sale + rental construction is in the pipeline within 1–3 miles? Heavy new supply typically softens prices + rents 12–24 months out; constrained supply supports both.
Investment metrics
- 1% rule
- 0.53% ✗
- Cap rate
- 3.55%
- Cash-on-cash
- -9.80%
- DSCR
- 0.56
- GRM
- 15.7
CMA / ARV
- ARV (on-the-fly)
- $662,480
- Comps found
- 3
Show comp detail 3 sales within ~0.75 mi
| Address | Dist | Beds/Ba | Sqft | Sold | Price | $/sf | Match |
|---|---|---|---|---|---|---|---|
| 5721 Meyer Ave | 0.67mi | 4/3.0 (-1) | 3,578 (+6%) | 6mo | $700,000 | $196 | 43 |
| 5631 Jordan Blvd | 0.61mi | 4/2.5 (-1) | 3,536 (+5%) | 11mo | $700,000 | $198 | 42 |
| 5933 Yeagertown Rd | 0.72mi | 6/3.5 (+1) | 3,728 (+10%) | 2mo | $714,000 | $192 | 38 |
Match score weights: distance 35% · size 25% · config 20% · recency 20%. Top-matched comps best support the ARV.
Projected returns pro-forma
-3.0% appreciation · 3.0% rent growth · sell at horizon
- IRR
- -33.9%
- Equity multiple
- -0.10×
- Total profit
- $-246,254
- Equity at exit
- $119,281
- IRR
- -42.7%
- Equity multiple
- -0.63×
- Total profit
- $-364,997
- Equity at exit
- $69,169
Cash invested: $223,997 (down + closing). Projections, not guarantees.
Landlord ↔ Tenant lean methodology
- Overall (STATE)
- 27 Tenant-Leaning
- State Maryland
- 27 Tenant-Leaning · D+14
- County
- — inherits STATE
- City
- — inherits STATE
ZIP-level market 21754
- Home prices YoY
- -27.5%
- Active inventory
- 48
- Price-to-rent
- 15.7×
Monthly cashflow live
- Estimated rent
- $4,257 high interval (Pro) →
- Mortgage (P&I)
- −$4,195
- Tax from tax record
- −$579 /mo · $6,951/yr
- Insurance
- −$333
- HOA
- −$84
- Lot rent
- −$0
- Vacancy / Maint / Mgmt
- −$894
- Net cashflow
- $-1,829
Break-even live
Sensitivity live
| Price | -10% $-1,376 | -5% $-1,602 | +0% $-1,829 | +5% $-2,055 | +10% $-2,282 |
|---|---|---|---|---|---|
| Rent | -10% $-2,165 | -5% $-1,997 | +0% $-1,829 | +5% $-1,661 | +10% $-1,493 |
| Rate | -1.0pp $-1,426 | -0.5pp $-1,625 | base $-1,829 | +0.5pp $-2,036 | +1.0pp $-2,247 |
UW: 25.0% down · 7.5% · 30yr · 1.5% tax · 5.0% vac · 8.0% maint · 8.0% mgmt
Financing live
Cash to close
- Down payment
- $199,998
- Closing costs
- $24,000
- Reserves months
- —
- Total cash needed
- —
Loan-product check · same deal, 3 products live
Conventional
25% down · 7.5% · 30yr
- Down + closing
- —
- Monthly P&I
- —
- Monthly cashflow
- —
- DSCR
- —
- Eligible?
- —
Personal DTI + credit; lowest rate.
DSCR
20% down · 8.5% · 30yr
- Down + closing
- —
- Monthly P&I
- —
- Monthly cashflow
- —
- DSCR
- —
- Eligible?
- —
No personal income docs; deal must DSCR.
Hard money
10% down · 12.0% · 12mo
- Down + closing
- —
- Monthly P&I
- —
- Monthly cashflow
- —
- DSCR
- —
- Eligible?
- —
Short-term bridge; refi at stabilization.
Rent comps 7 comps
| Address | Beds | Baths | Sqft | Rent | $/sqft | DOM | Units | Dist |
|---|---|---|---|---|---|---|---|---|
| 5951 Eaglehead Dr New Market, MD | 4.0 | 3.5 | 2800 | $4,100 | $1.46 | 26d | 1 | 0.40mi |
| 6032 Goshawk St New Market, MD | 5.0 | 4.5 | 2900 | $3,600 | $1.24 | 7d | 1 | 0.43mi |
| 6042 Fallfish Ct New Market, MD | 4.0 | 3.5 | 2420 | $3,300 | $1.36 | 46d | 1 | 0.51mi |
| 6242 Walleye Pl New Market, MD | 4.0 | 4.5 | 4636 | $7,500 | $1.62 | 24d | 1 | 0.52mi |
| 5927 Pecking Stone St New Market, MD | 4.0 | 3.5 | 2280 | $3,100 | $1.36 | 14d | 1 | 0.53mi |
| 6348 Quinn Rd Frederick, MD | 4.0 | 3.5 | 2708 | $4,400 | $1.62 | 7d | 1 | 1.22mi |
| 6430 Bellevue Pl Frederick, MD | 5.0 | 3.5 | 3950 | $4,000 | $1.01 | 7d | 1 | 1.40mi |
HOA detail
- Monthly dues
- $84 · $1,008/yr
Listing history 10 events
-
2026-06-22days on market $799,990 Coming Soon 13 DOM
-
2026-06-21days on market $799,990 Coming Soon 12 DOM
-
2026-06-18days on market $799,990 Coming Soon 9 DOM
-
2026-06-17days on market $799,990 Coming Soon 8 DOM
-
2026-06-16days on market $799,990 Coming Soon 7 DOM
-
2026-06-15days on market $799,990 Coming Soon 6 DOM
-
2026-06-13days on market $799,990 Coming Soon 4 DOM
-
2026-06-13days on market $799,990 Coming Soon 3 DOM
-
2026-06-10remarks 699-char remark
-
2026-06-10$799,990 Coming Soon 1 DOM
ⓘ Source: listings_history table (triggers on properties + properties_extension) + one-shot
backfill from property_details.listing_events for pre-trigger history.
Tax reassessment forecast MD · Partial reset (capped growth)
- Current annual tax
- $6,951 · $579/mo
- Projected year-2 tax
- $7,836 · $653/mo
- Expected delta
- +$884/yr (+$74/mo · 12.7%)
ⓘ Screening estimate from a state-policy table — verify with the county assessor before closing.
Climate risk First Street
- Flood 1/10 Low FEMA zone X (unshaded) · 0% chance over 30 yrs
- Wildfire 1/10 Low
- Heat 6/10 Major 7 d/yr ≥103°F today · 16 d/yr by 30 yrs out
- Wind 4/10 Moderate 8% chance of damaging wind over 30 yrs
- Air quality 2/10 Low 1 unhealthy d/yr today · 1 by 30 yrs out
Nearby sold comps map
Loading sold comps map…
Walkable amenities ~0.75 mi
Loading nearby amenities…
Taxation est. · year 1
- Rental income
- $51,084
- − Mortgage interest
- −$44,812
- − Property taxes
- −$6,951
- − Insurance
- −$4,000
- − Repairs & maintenance
- −$4,087
- − Management
- −$4,087
- − HOA
- −$1,008
- − Depreciation
- −$23,272
- Taxable loss
- −$37,133
- Est. tax savings @ 24.0%
- +$8,912
- After-tax cash flow
- $-13,034/yr
For passive investors: Depreciation is non-cash, so a rental often shows a tax loss while cash-flowing — sheltering income. Rental losses are passive: they offset passive income freely, and up to $25,000/yr can offset ordinary (W-2) income if you actively participate and your MAGI is under $100k (phasing out to $0 by $150k); unused losses carry forward. On sale, claimed depreciation is recaptured at up to 25%, and gains may owe capital-gains tax (a 1031 exchange can defer both). Figures are a year-1 estimate at your 24.0% rate — not tax advice; consult a CPA.
Schools (NCES district)
- District
- Frederick County Public Schools
- NCES district ID
- 2400330
- Math proficiency
- 27% ▼ -23.00%
- Reading proficiency
- 43% ▼ -15.00%
- Median HH income
- $84,020
- Composite
- 33.54/100
- National rank
- #5429
- State rank
- #4 of 24 in MD
Livability — Linganore
- Score
- 65/100
- State rank
- #257
- US rank
- #13191
Category grades
Schools grade is shown separately in the Schools card above.
Census & demographics
- Census place
- Linganore, MD
- City population
- 16,515
- Population (ZIP)
- 7,439
Population outlook (Frederick County) Hauer SSP2
- Today (2025)
- 269,438 people
- By 2030
- 280,160 · +4.0%
- By 2040
- 298,408 · +10.8%
- By 2050
- 311,062 · +15.4%
- By 2075
- 342,819 · +27.2%
- By 2100
- 351,361 · +30.4%
Race, ethnicity, and origin ACS 2023
- Neighborhood character
- Predominantly White (73%)
- Race & ethnicity
- White 73% Hispanic / Latino 11% Two or more races 9% Asian 8% Black 5%
- Hispanic origin (detail)
- Mexican 2% Puerto Rican 2%
- Common ancestry
- Romanian 5% Scotch-Irish 2% Lithuanian 2%
- Foreign-born
- 11% · Canada, Jamaica, South Korea
- Languages at home
- 83% English-only · Spanish 7% Other Indo-European 2% Russian/Polish/Slavic 2%
Political lean MEDSL · Frederick
- 2024 margin
- Lean D (+8.8) · D 53.2% · R 44.4% · Other 2.5%
- 2008→2024 swing
- +9.9pp toward D · 2008: -1.0pp · 2024: 8.8pp
- All cycles
- 2024: D+8.8 2020: D+9.6 2016: R+4.0 2012: R+3.9 2008: R+1.0
Not yet ingested
- Civics
- —
Market trends
- HPI YoY
- ▼ -107.25%
- Current HPI
- 283.0295
- Rent YoY
- —
- Metro
- —
- State GDP YoY
- ▲ 2.97%
- F500 in state
- 12
Industry mix (Fortune 500 HQ in MD)
| Industry | F500 HQs | Revenue |
|---|---|---|
| Aerospace / Defense | 1 | $71B |
|
||
| Utilities | 1 | $25B |
|
||
| Hotels | 1 | $24B |
|
||
| Consumer Goods | 1 | $7B |
|
||
| Real Estate | 1 | $6B |
|
||
| Chemicals | 1 | $2B |
|
||
Price history
+82.2% since first listed15 events — show timeline
- 2026-06-09 Coming Soon $799,990 BRIGHT MLS
- 2018-04-13 Sold (MLS) $478,553 MRIS
- 2018-04-13 Sold (MLS) $478,553 BRIGHT MLS
- 2018-03-06 Listing Removed — BRIGHT MLS
- 2018-03-04 Delisted — MRIS
- 2018-01-04 Sold (Public Records) $253,764 Public Records
- 2017-10-25 Sold (Public Records) $392,704 Public Records
- 2017-10-24 Price Changed — MRIS
- 2017-10-18 Price Changed — MRIS
- 2017-09-28 Listed $478,553 MRIS
- 2017-09-28 Delisted — MRIS
- 2017-09-28 Listed $478,553 BRIGHT MLS
- 2017-09-28 Listing Removed — BRIGHT MLS
- 2017-07-10 Listed — MRIS
- 2017-07-10 Listed $439,000 BRIGHT MLS
Property tax history
+34.8%/yrLatest (2025): $6,951 · +6.7% YoY. Source: county tax records.
Cash-flow waterfall
monthlySold comps — $/sqft
last 12 mo · ≤1 miLoading sold comps…