4909 Winecup Cv · San Antonio, TX
Flood risk No data
- FEMA flood zone
- —
- Chance of flooding over 30 yrs
- —
- Est. flood insurance / yr
- —
Fire risk No data
- Est. fire insurance / yr
- —
Heat risk No data
- Hot days now (above threshold)
- —
- Hot days in 30 yrs
- —
Wind risk No data
- Chance of severe wind over 30 yrs
- —
Air-quality risk No data
- Unhealthy air days now
- —
- Unhealthy air days in 30 yrs
- —
Risk factors via First Street. Map © Google.
Why this score? — see what drove the C grade
The composite is a weighted blend of 9 inputs, each scored 0–100. Each bar is that input's sub-score; the figure is the points it added to the 100-point composite (weight × sub-score).
- Cash flow +19.2/30.0
- ARV discount +13.9/15.0
- DSCR +6.1/10.0
- 1% rule +5.6/10.0
- Condition / age +5.0/5.0
- Livability +4.0/5.0
- Rent growth +2.2/5.0
- Schools +1.9/10.0
- Appreciation +0.0/10.0
$149,999
🖨 Deal sheet (PDF) 📄 Offer letter ✓ Due diligence
Listing remarks
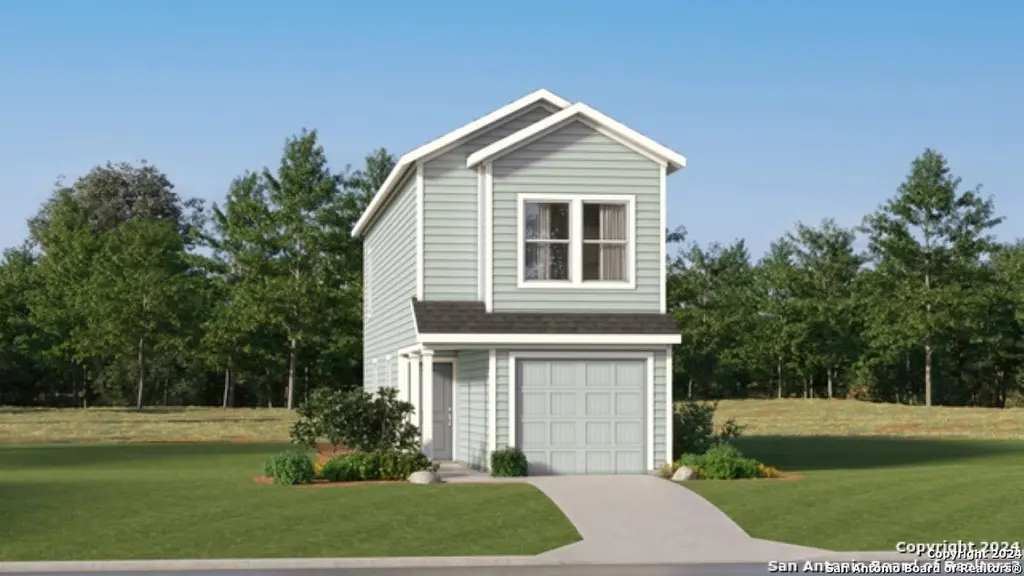
The Baja - This new two-story home features a modern, open-concept design that maximizes the footprint of the interior. The U-shaped kitchen overlooks a family room ideal for entertainment and relaxation, with a rear door connecting to the backyard. Two upper-level bedrooms provide restful accommodations, while at the opposite end of the hallway is the private owner's suite with an attached bathroom and walk-in closet. Estimated Completion July 2026. The completion date, prices and features may vary and are subject to change. Please verify with Lennar directly. Photos are for illustrative purposes only.
Key facts
- 4,791 sq ft lot
- Garage
- Built 2026
Property features AI
Finance
- Other: Subdivision: Flora Meadows
- Financial info: Down payment resources available
- HOA & community: Mandatory HOA; HOA fee $168 quarterly; Association transfer fee $450
Exterior
- Parking: 1-car garage
- Utilities: Water and sewer service (ECSUD); Gas service (Unigas); Electric service (CPS); Garbage service (Frontier)
- Home design: New construction by Lennar; Cement fiber exterior; Slab foundation; Composition roof
- Construction: Built new (approximate age 0)
- Exterior features: Privacy fence
Interior
- Kitchen: Kitchen dimensions 10 x 10; Stove/Range; Dishwasher; Breakfast bar
- Bedrooms: Master bedroom on upper level with walk-in closet and full bath; Bedroom 2 (10 x 9); Bedroom 3 (10 x 9); Master bedroom dimensions 14 x 11
- Flooring: Carpeting; Vinyl flooring
- Bathrooms: 2 full baths and 1 half bath; Master bath with tub/shower combination (8 x 6)
- Heating & cooling: Central heating; Electric and natural gas heat; Central air conditioning
- Interior features: Open floor plan; Cable TV available; 1 living area; Breakfast bar; Utility room inside; All bedrooms on upper level; Walk-in closets
- Laundry & utility: Washer connection; Dryer connection; Laundry located on upper level; Utility room inside
Neighborhood map
What this means for you Summary
Snapshot
- This is a 3-bed/2.5-bath single-family listed at $150k. Condition is rated excellent.
Deal economics
- At list price, monthly cash flow is $162 ($2k/yr) — positive.
- The deal already cash-flows at list — no discount required.
- Meets the 1% rule at list price ($2k rent vs $150k).
- Recommended offer: $145k (3.0% below list) — sets the bar for market timing.
- Cap rate 7.6% vs local median 3.8% in San Antonio — top-decile yield for the area; either an underpriced asset or a hidden risk that comps aren't pricing in. Stress-test before assuming the spread holds.
Location & tenants
- Location reads 80/100 on livability (#31 in TX, #1,616 nationally) — a professional / high-income tenant draw. Strengths: amenities A+, commute A+, cost of living A+; Watch: crime F.
- East Central ISD (rural): math 16% / reading 25% proficiency, ranked #758 of 826 in TX (top 92%) — low school quality limits family demand, transient renter base, plan for 1-2y turnover; 61% free/reduced lunch — lower-income household profile, screen leases tightly.
- Zoned schools: Tradition El (math 25% / reading 32%, grade F, #2,706 of 4,322 statewide, top 63%, 993 students, 51% FRL); East Central Heritage Middle (math 11% / reading 26%, grade F, #1,478 of 1,662 statewide, top 90%, 1,120 students, 44% FRL); East Central H S (math 21% / reading 28%, grade F, #1,264 of 1,632 statewide, top 82%, 3,252 students, 52% FRL).
- Market conditions: Rents soft (-1.1%/yr); 1207 active listings in the ZIP; 23 comparable units currently listed for rent nearby; rentals at typical pace (median 24d on market — plan ~3-4 weeks tenant-placement turnaround); solid renter incomes; 8,308 units permitted in Bexar County in 2024 (2,506 in 5+ unit buildings).
Forward outlook
- Local home prices are declining (-3.0%/yr); year-one equity from $1k of loan paydown is wiped out by about $4k of value loss. Plan a longer hold.
- Bexar County population projected at +50% by 2050 — long-run rental-demand tailwind backs the buy-and-hold thesis.
Negotiation context
- It's been on market 42 days — a 3% lower offer ($145k) is reasonable based on typical stale-listing flexibility.
Questions for the listing agent
- It's been on market 42 days. Have you received any prior offers? Is the seller open to a 3% concession, seller financing, or rate buy-down credit?
- What does the HOA fee cover, when was the last increase, and are there any pending special assessments or reserve-fund shortfalls?
- Is there a deadline driving the sale (1031 exchange, divorce, estate, relocation)? That informs how much negotiation room exists.
- Crime grade is F in this area — have there been break-ins, vandalism, or insurance claims at this property in the last 3 years? What carrier currently insures it and at what premium?
- What's the average days-on-market for RENTAL listings here right now (not sales)? A rising rental-DOM trend means longer vacancies and softer asking-rent achievability than the comps imply.
- What's the recent tenant-quality profile in this submarket — average credit score on applications, eviction rate, late-payment / NSF rate, and stable-employment percentage? A property-management company in the area should have these aggregated.
- How much new for-sale + rental construction is in the pipeline within 1–3 miles? Heavy new supply typically softens prices + rents 12–24 months out; constrained supply supports both.
Investment metrics
- 1% rule
- 1.06% ✓
- Cap rate
- 7.59%
- Cash-on-cash
- 4.63%
- DSCR
- 1.21
- GRM
- 7.9
CMA / ARV
- ARV (median comp)
- $174,999
- List price
- $149,999
- Delta
- -14.29%
- Verdict
- UNDERPRICED
- Comps
- 20 within 1.0 mi
Show comp detail 12 sales within ~0.75 mi
| Address | Dist | Beds/Ba | Sqft | Sold | Price | $/sf | Match |
|---|---|---|---|---|---|---|---|
| 11942 Spiderwort Rdg | 0.03mi | 3/2.5 | 1,189 (0%) | 1mo | $163,999 | $138 | 98 |
| 11938 Spiderwort Rdg | 0.03mi | 3/2.5 | 1,189 (0%) | 2mo | $161,999 | $136 | 96 |
| 4906 Winecup Cv | 0.07mi | 3/2.5 | 1,189 (0%) | 2mo | $162,999 | $137 | 95 |
| 4915 Daisy Blossom | 0.10mi | 3/2.5 | 1,189 (0%) | 3mo | $169,999 | $143 | 92 |
| 11926 Spiderwort Rdg | 0.03mi | 3/2.5 | 1,360 (+14%) | 2mo | $175,999 | $129 | 73 |
| 4902 Winecup Cv | 0.04mi | 3/2.5 | 1,360 (+14%) | 1mo | $186,999 | $137 | 73 |
| 4949 Winecup Cv | 0.05mi | 3/2.5 | 1,360 (+14%) | 1mo | $160,999 | $118 | 73 |
| 4957 Winecup Cv | 0.06mi | 3/2.5 | 1,360 (+14%) | 0mo | $160,999 | $118 | 73 |
| 11918 Spiderwort Rdg | 0.03mi | 3/2.5 | 1,360 (+14%) | 3mo | $187,999 | $138 | 72 |
| 11934 Spiderwort Rdg | 0.03mi | 3/2.5 | 1,360 (+14%) | 3mo | $173,999 | $128 | 72 |
| 4965 Winecup Cv | 0.07mi | 3/2.5 | 1,360 (+14%) | 1mo | $163,999 | $121 | 72 |
| 11910 Spiderwort Rdg | 0.03mi | 3/2.5 | 1,360 (+14%) | 3mo | $187,999 | $138 | 72 |
Match score weights: distance 35% · size 25% · config 20% · recency 20%. Top-matched comps best support the ARV.
Projected returns pro-forma
-3.0% appreciation · 0.0% rent growth · sell at horizon
- IRR
- -12.6%
- Equity multiple
- 0.56×
- Total profit
- $-18,581
- Equity at exit
- $22,365
- IRR
- -9.3%
- Equity multiple
- 0.51×
- Total profit
- $-20,641
- Equity at exit
- $12,969
Cash invested: $42,000 (down + closing). Projections, not guarantees.
Landlord ↔ Tenant lean methodology
- Overall (STATE)
- 87 Strongly Landlord-Friendly
- State Texas
- 87 Strongly Landlord-Friendly · R+5
- County
- — inherits STATE
- City
- — inherits STATE
ZIP-level market 78109
- Home prices YoY
- -17.8%
- Rents YoY
- -1.1%
- Active inventory
- 1207
- Price-to-rent
- 7.9×
Monthly cashflow live
- Estimated rent
- $1,588 high interval (Pro) →
- Mortgage (P&I)
- −$787
- Tax est. 1.5%
- −$187 /mo · $2,250/yr
- Insurance
- −$62
- HOA
- −$56
- Vacancy / Maint / Mgmt
- −$334
- Net cashflow
- $162
Break-even live
Sensitivity live
| Price | -10% $266 | -5% $214 | +0% $162 | +5% $110 | +10% $58 |
|---|---|---|---|---|---|
| Rent | -10% $37 | -5% $99 | +0% $162 | +5% $225 | +10% $288 |
| Rate | -1.0pp $238 | -0.5pp $200 | base $162 | +0.5pp $123 | +1.0pp $84 |
UW: 25.0% down · 7.5% · 30yr · 1.5% tax · 5.0% vac · 8.0% maint · 8.0% mgmt
Financing live
Cash to close
- Down payment
- $37,500
- Closing costs
- $4,500
- Reserves months
- —
- Total cash needed
- —
Loan-product check · same deal, 3 products live
Conventional
25% down · 7.5% · 30yr
- Down + closing
- —
- Monthly P&I
- —
- Monthly cashflow
- —
- DSCR
- —
- Eligible?
- —
Personal DTI + credit; lowest rate.
DSCR
20% down · 8.5% · 30yr
- Down + closing
- —
- Monthly P&I
- —
- Monthly cashflow
- —
- DSCR
- —
- Eligible?
- —
No personal income docs; deal must DSCR.
Hard money
10% down · 12.0% · 12mo
- Down + closing
- —
- Monthly P&I
- —
- Monthly cashflow
- —
- DSCR
- —
- Eligible?
- —
Short-term bridge; refi at stabilization.
Rent comps 23 comps
| Address | Beds | Baths | Sqft | Rent | $/sqft | DOM | Units | Dist |
|---|---|---|---|---|---|---|---|---|
| 4949 Winecup Cv Converse, TX | 3.0 | 2.5 | 1360 | $1,475 | $1.08 | 0d | 1 | 0.05mi |
| 11938 Spiderwort Rdg Converse, TX | 3.0 | 2.5 | 1189 | $1,600 | $1.35 | 6d | 1 | 0.07mi |
| 4906 Winecup Cv Converse, TX | 3.0 | 2.5 | 1189 | $1,350 | $1.14 | 25d | 1 | 0.08mi |
| 5010 Primrose Rdg Converse, TX | 2.0 | 2.0 | 850 | $1,295 | $1.52 | 45d | 1 | 0.08mi |
| 5015 Daisy Blossom Converse, TX | 2.0 | 2.0 | 852 | $1,290 | $1.51 | 5d | 1 | 0.10mi |
| 12003 Floral Blossom Converse, TX | 3.0 | 2.5 | 1189 | $1,550 | $1.30 | 45d | 1 | 0.14mi |
| 12135 Floral Blossom Converse, TX | 2.0 | 2.5 | 1015 | $1,250 | $1.23 | 0d | 1 | 0.15mi |
| 4522 Meerkat Converse, TX | 3.0 | 2.0 | 1489 | $1,750 | $1.18 | 12d | 1 | 0.62mi |
| 4918 Valenzuela Converse, TX | 3.0–4.0 | 2.0–2.5 | 1719 | $1,699 | $0.99 | 0d | 82 | 0.79mi |
| 10818 Fox Trot Converse, TX | 3.0 | 2.0 | 1465 | $1,850 | $1.26 | 6d | 1 | 1.33mi |
| 13015 Red Elks Lks Saint Hedwig, TX | 3.0 | 2.0 | 1445 | $1,650 | $1.14 | 4d | 1 | 1.35mi |
| 4211 Asher Aly Saint Hedwig, TX | 3.0 | 2.0 | 1248 | $1,438 | $1.15 | 5d | 1 | 1.37mi |
| 3937 Abbott Pass Unit 102 St Hedwig, TX | 3.0 | 2.5 | 1345 | $1,495 | $1.11 | 45d | 1 | 1.40mi |
| 3933 Abbott Pass Unit 101 St Hedwig, TX | 3.0 | 2.5 | 1345 | $1,450 | $1.08 | 25d | 1 | 1.40mi |
| 3936 Abbott Pass Unit 101 St Hedwig, TX | 3.0 | 2.5 | 1345 | $1,450 | $1.08 | 23d | 1 | 1.41mi |
| 3932 Abbott Pass Unit 102 St Hedwig, TX | 3.0 | 2.5 | 1345 | $1,495 | $1.11 | 25d | 1 | 1.42mi |
| 3925 Abbott Pass Unit 101 St Hedwig, TX | 3.0 | 2.5 | 1345 | $1,450 | $1.08 | 45d | 1 | 1.42mi |
| 3921 Abbott Pass Unit 101 St Hedwig, TX | 3.0 | 2.5 | 1345 | $1,595 | $1.19 | 12d | 1 | 1.43mi |
| 13015 Kathleen St Saint Hedwig, TX | 3.0 | 2.0 | 1235 | $1,540 | $1.25 | 23d | 1 | 1.46mi |
| 13015 Kathleen St Saint Hedwig, TX | 3.0 | 2.0 | 1235 | $1,540 | $1.25 | 25d | 1 | 1.46mi |
| 11019 Chatham Ct Converse, TX | 3.0 | 2.5 | 1428 | $1,425 | $1.00 | 45d | 1 | 1.48mi |
| 3923 Ivy Path Saint Hedwig, TX | 3.0 | 2.0 | 1445 | $1,600 | $1.11 | 25d | 1 | 1.48mi |
| 3106 Drayton Ests Converse, TX | 2.0–5.0 | 2.0–3.5 | 1733 | $2,102 | $1.21 | 0d | 1 | 1.49mi |
HOA detail
- Monthly dues
- $56 · $672/yr
Listing history 14 events
-
2026-06-07status $149,999 Pending 42 DOM
-
2026-06-04days on market $149,999 Active 42 DOM
-
2026-06-03days on market $149,999 Active 41 DOM
-
2026-06-02days on market $149,999 Active 40 DOM
-
2026-06-01days on market $149,999 Active 39 DOM
-
2026-05-31days on market $149,999 Active 38 DOM
-
2026-05-12price $149,999 610-char remark
-
2026-05-11price $149,999 362-char remark
-
2026-05-05price $154,999 610-char remark
-
2026-05-02price $154,999 362-char remark
-
2026-04-30price $150,999 610-char remark
-
2026-04-29price $150,999 362-char remark
-
2026-04-23$166,999 New 610-char remark
-
2026-04-22$166,999 Active 362-char remark
ⓘ Source: listings_history table (triggers on properties + properties_extension) + one-shot
backfill from property_details.listing_events for pre-trigger history.
Nearby sold comps map
Loading sold comps map…
Walkable amenities ~0.75 mi
Loading nearby amenities…
Taxation est. · year 1
- Rental income
- $19,058
- − Mortgage interest
- −$8,402
- − Property taxes
- −$2,250
- − Insurance
- −$750
- − Repairs & maintenance
- −$1,525
- − Management
- −$1,525
- − HOA
- −$672
- − Depreciation
- −$4,364
- Taxable loss
- −$429
- Est. tax savings @ 24.0%
- +$103
- After-tax cash flow
- $2,048/yr
For passive investors: Depreciation is non-cash, so a rental often shows a tax loss while cash-flowing — sheltering income. Rental losses are passive: they offset passive income freely, and up to $25,000/yr can offset ordinary (W-2) income if you actively participate and your MAGI is under $100k (phasing out to $0 by $150k); unused losses carry forward. On sale, claimed depreciation is recaptured at up to 25%, and gains may owe capital-gains tax (a 1031 exchange can defer both). Figures are a year-1 estimate at your 24.0% rate — not tax advice; consult a CPA.
Condition & rehab AI · 6 photos
This modern, two-story home is move-in ready with a fresh, open-concept design and high-quality finishes. It offers excellent curb appeal and is ready for immediate occupancy.
Value-add opportunities
- Both Landscaping improvements — Enhances curb appeal and adds value.
- Both Painting interior walls — Fresh paint can make the space feel new and inviting.
- Both Add smart home features — Modernizes the home and adds value for both buyers and renters.
Renovation cost estimate screening
Value-add ROI direction
- Both Landscaping improvements — Enhances curb appeal and adds value. ↑
- Both Painting interior walls — Fresh paint can make the space feel new and inviting. ↑
- Both Add smart home features — Modernizes the home and adds value for both buyers and renters. ↑
ⓘ Cost ranges are severity-bucket heuristics (US national rule-of-thumb). Get contractor quotes + a written scope before underwriting a rehab budget.
Schools (NCES district)
- District
- East Central ISD
- NCES district ID
- 4817850
- Math proficiency
- 16% ▼ -12.00%
- Reading proficiency
- 25% ▼ -6.00%
- Median HH income
- $53,941
- Composite
- 18.67/100
- National rank
- #8887
- State rank
- #758 of 826 in TX
Livability — San Antonio
- Score
- 80/100
- State rank
- #31
- US rank
- #1616
Category grades
Schools grade is shown separately in the Schools card above.
Census & demographics
- County
- Bexar County · 1,990,555 people
- City population
- 1,806,925
- Metro
- San Antonio-New Braunfels, TX
- Population (ZIP)
- 63,067
- Household income
- $91,320
- Rent vs Own
- Severe rent burden
- 1732.0
Population outlook (Bexar County) Hauer SSP2
- Today (2025)
- 2,336,851 people
- By 2030
- 2,560,728 · +9.6%
- By 2040
- 3,020,569 · +29.3%
- By 2050
- 3,493,522 · +49.5%
- By 2075
- 4,668,459 · +99.8%
- By 2100
- 5,533,242 · +136.8%
Race, ethnicity, and origin ACS 2023
- Neighborhood character
- Diverse neighborhood (Simpson 0.69)
- Race & ethnicity
- Hispanic / Latino 44% White 27% Two or more races 21% Black 21% Asian 3%
- Hispanic origin (detail)
- Mexican 29% Puerto Rican 4%
- Common ancestry
- Lithuanian 1% Romanian 1% Italian 1%
- Foreign-born
- 11% · Canada, Vietnam, South Korea
- Languages at home
- 71% English-only · Spanish 23% Tagalog/Filipino 1% Other Asian/Pacific 1%
Political lean MEDSL · Bexar
- 2024 margin
- Lean D (+9.8) · D 54.3% · R 44.6% · Other 1.1%
- 2008→2024 swing
- +4.2pp toward D · 2008: 5.6pp · 2024: 9.8pp
- All cycles
- 2024: D+9.8 2020: D+18.2 2016: D+13.5 2012: D+4.6 2008: D+5.6
Not yet ingested
- Civics
- —
Market trends
- HPI YoY
- ▼ -51.02%
- Current HPI
- 236.4923
- Rent YoY
- ▼ -1.08%
- Metro
- San Antonio-New Braunfels, TX
- State GDP YoY
- ▲ 3.95%
- F500 in state
- 110
Industry mix (Fortune 500 HQ in TX)
| Industry | F500 HQs | Revenue |
|---|---|---|
| Energy | 16 | $1,198B |
|
||
| Technology | 5 | $198B |
|
||
| Engineering / Construction | 4 | $72B |
|
||
| Energy Services | 3 | $60B |
|
||
| Utilities | 3 | $41B |
|
||
| Healthcare | 2 | $330B |
|
||
Price history
-10.2% since first listed5 events — show timeline
- 2026-06-04 Pending — LERA
- 2026-05-12 Price Changed $149,999 LERA
- 2026-05-05 Price Changed $154,999 LERA
- 2026-04-30 Price Changed $150,999 LERA
- 2026-04-23 Listed $166,999 LERA
Cash-flow waterfall
monthlySold comps — $/sqft
last 12 mo · ≤1 miLoading sold comps…