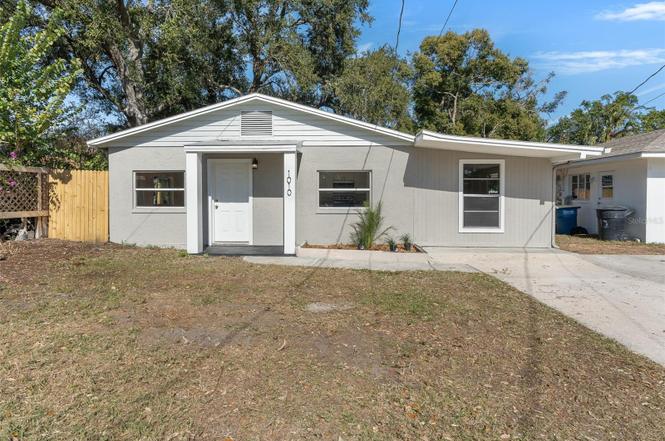
1010 Fairmont St · Clearwater, FL
Flood risk 1/10 · Minimal
- FEMA flood zone
- X (unshaded)
- Chance of flooding over 30 yrs
- 0.0%
- Est. flood insurance / yr
- $507 – $1,088
Fire risk 1/10 · Minimal
- Est. fire insurance / yr
- $947 – $1,759
Heat risk 10/10 · Severe
- Hot days now (above 107°F)
- 7 days/yr
- Hot days in 30 yrs
- 27 days/yr
Wind risk 10/10 · Severe
- Chance of severe wind over 30 yrs
- 99.0%
Air-quality risk 3/10 · Minor
- Unhealthy air days now
- 2 days/yr
- Unhealthy air days in 30 yrs
- 3 days/yr
Risk factors via First Street. Map © Google.
Why this score? — see what drove the C+ grade
The composite is a weighted blend of 9 inputs, each scored 0–100. Each bar is that input's sub-score; the figure is the points it added to the 100-point composite (weight × sub-score).
- Cash flow +21.2/30.0
- ARV discount +15.0/15.0
- DSCR +6.8/10.0
- 1% rule +4.8/10.0
- Schools +4.3/10.0
- Livability +4.1/5.0
- Condition / age +2.5/5.0
- Rent growth +2.0/5.0
- Appreciation +0.0/10.0
$270,000
🖨 Deal sheet 📄 Offer letter ✓ Due diligence
Listing remarks
Price Improvement! Beautifully updated 4-bedroom, 1.5-bath concrete block home located in a desirable Clearwater neighborhood, potentially near the city’s future downtown redevelopment. Just seconds from the Pinellas Trail and minutes to Clearwater Beach. This home features luxury vinyl flooring, fresh interior and exterior Sherwin-Williams paint, shaker cabinets, granite countertops, and stainless steel appliances. Updates include newer central A/C, tankless hot water heater, electrical panel in great condition, recently blown attic insulation, new toilets, brushed nickel faucets, ceiling fans, and new interior and exterior fixtures. The bathroom offers subway tile and a new pedesta
Key facts
- Near pinellas trail
- Shaker cabinets
- Granite countertops
Tags
Property features AI
Finance
- Other: Property type: Residential — Single family residence; Living area about 1,000 sq ft (public records); total building area about 1,303 sq ft
- Financial info: No lease restrictions
- HOA & community: No HOA; Street lights in the community
Exterior
- Parking: No specific parking details provided
- Security: No security features listed
- Utilities: Public sewer; Water connected; Electricity connected; Cable available; High-speed/BB internet available
- Home design: Single family residence; One-story; Faces south
- Construction: Block and concrete construction; Shingle roof; Block foundation; Slab foundation; Built on a 0.12-acre lot (approx. 53 x 100)
- Exterior features: Private mailbox; Asphalt/paved road access
Interior
- Kitchen: Built-in oven; Cooktop; Range; Microwave; Dishwasher; Refrigerator
- Bedrooms: 4 bedrooms
- Flooring: Laminate
- Bathrooms: 1 full bath; 1 half bath
- Heating & cooling: Central heating (electric); Central air conditioning
- Interior features: Ceiling fans
- Laundry & utility: Inside laundry; Washer hookup
Neighborhood map
What this means for you Summary
Snapshot
- This is a 4-bed/1.5-bath single-family listed at $270k.
Deal economics
- At list price, monthly cash flow is $392 ($5k/yr) — positive.
- The deal already cash-flows at list — no discount required.
- To meet the 1% rule (rent ≥ 1% of price), the offer needs to be $265k (1.8% below list).
- Recommended offer: $246k (9.0% below list) — sets the bar for market timing.
- Cap rate 8.0% vs local median 2.9% in Clearwater — top-decile yield for the area; either an underpriced asset or a hidden risk that comps aren't pricing in. Stress-test before assuming the spread holds.
Location & tenants
- Location reads 82/100 on livability (#60 in FL, #988 nationally) — a professional / high-income tenant draw. Strengths: commute A+, housing A+, health & safety A+; Watch: schools C-, employment C-.
- Pinellas (suburban): math 51% / reading 51% proficiency, ranked #31 of 73 in FL (top 42%) — acceptable for families but not a draw, mixed tenant base, ~2y average lease.
- Market conditions: Rents soft (-2.2%/yr); 261 active listings in the ZIP; 27 comparable units currently listed for rent nearby; rentals at typical pace (median 22d on market — plan ~3-4 weeks tenant-placement turnaround); 2,676 units permitted in Pinellas County in 2024 (1,422 in 5+ unit buildings).
- At $2,652/mo this rent would consume 51% of the median local household income ($63k/yr) (locally 1511% of renters already pay >50% of income on rent) — very limited rent-growth headroom before tenants either downsize or default.
Forward outlook
- Local home prices are declining (-3.0%/yr); year-one equity from $2k of loan paydown is wiped out by about $8k of value loss. Plan a longer hold.
- Pinellas County population projected at +14% by 2050 — modest demand growth; plan on rents tracking national, not racing it.
Negotiation context
- It's been on market 110 days — a 9% lower offer ($246k) is reasonable based on typical stale-listing flexibility.
- 2 sale attempts; this cycle's ask has dropped $60k (18%) from the opening price — seller is motivated, your offer sets the floor, not the list.
Risks & watch-outs
- Watch-outs: built in 1958 — expect roof / HVAC / electrical / plumbing capex.
- Climate carrying-cost: severe wind risk, 99% chance of damaging wind over 30y; extreme-heat days projected 7→27/yr by 2055 (HVAC capex compounding) — expect insurance premiums to compound above CPI over the hold.
Questions for the listing agent
- It's been on market 110 days. Have you received any prior offers? Is the seller open to a 9% concession, seller financing, or rate buy-down credit?
- Built in 1958 — when were the roof, HVAC, electrical panel, plumbing, and water heater last replaced?
- Why hasn't it sold? Are there any deal-killer items the seller is aware of (foundation, flood, title, zoning, code violations)?
- Is there a deadline driving the sale (1031 exchange, divorce, estate, relocation)? That informs how much negotiation room exists.
- What's the average days-on-market for RENTAL listings here right now (not sales)? A rising rental-DOM trend means longer vacancies and softer asking-rent achievability than the comps imply.
- What's the recent tenant-quality profile in this submarket — average credit score on applications, eviction rate, late-payment / NSF rate, and stable-employment percentage? A property-management company in the area should have these aggregated.
- How much new for-sale + rental construction is in the pipeline within 1–3 miles? Heavy new supply typically softens prices + rents 12–24 months out; constrained supply supports both.
Investment metrics
- 1% rule
- 0.98% ✗
- Cap rate
- 8.04%
- Cash-on-cash
- 6.22%
- DSCR
- 1.28
- GRM
- 8.5
CMA / ARV
- ARV (on-the-fly)
- $325,125
- Comps found
- 12
Show comp detail 12 sales within ~0.75 mi
| Address | Dist | Beds/Ba | Sqft | Sold | Price | $/sf | Match |
|---|---|---|---|---|---|---|---|
| 1125 Engman St | 0.34mi | 3/1.5 (-1) | 1,274 (-0%) | 1mo | $324,900 | $255 | 78 |
| 902 Marshall St | 0.13mi | 3/2.0 (-1) | 1,358 (+6%) | 3mo | $270,000 | $199 | 73 |
| 1081 Mohawk Cir | 0.13mi | 3/2.0 (-1) | 1,219 (-4%) | 10mo | $355,000 | $291 | 71 |
| 1060 Iroquois St | 0.21mi | 3/1.5 (-1) | 1,109 (-13%) | 4mo | $252,000 | $227 | 60 |
| 902 Pennsylvania Ave | 0.56mi | 3/2.0 (-1) | 1,252 (-2%) | 4mo | $350,000 | $280 | 60 |
| 1115 N Betty Ln | 0.67mi | 3/2.0 (-1) | 1,276 (+0%) | 5mo | $210,000 | $165 | 58 |
| 1916 Macomber Ave | 0.71mi | 3/2.0 (-1) | 1,237 (-3%) | 8mo | $355,000 | $287 | 48 |
| 1869 Springtime Ave | 0.51mi | 3/1.0 (-1) | 1,156 (-9%) | 9mo | $265,000 | $229 | 46 |
| 1313 Parkwood St | 0.60mi | 3/2.0 (-1) | 1,390 (+9%) | 8mo | $350,000 | $252 | 43 |
| 1341 Sandy Ln | 0.69mi | 4/3.0 | 1,382 (+8%) | 9mo | $236,500 | $171 | 41 |
| 1320 Mary L Rd | 0.63mi | 3/2.0 (-1) | 1,101 (-14%) | 1mo | $328,600 | $298 | 40 |
| 1345 Parkwood St | 0.69mi | 3/1.5 (-1) | 1,104 (-13%) | 6mo | $335,000 | $303 | 35 |
Match score weights: distance 35% · size 25% · config 20% · recency 20%. Top-matched comps best support the ARV.
Projected returns pro-forma
-3.0% appreciation · 0.0% rent growth · sell at horizon
- IRR
- -9.9%
- Equity multiple
- 0.65×
- Total profit
- $-26,616
- Equity at exit
- $40,258
- IRR
- -4.9%
- Equity multiple
- 0.72×
- Total profit
- $-21,308
- Equity at exit
- $23,345
Cash invested: $75,600 (down + closing). Projections, not guarantees.
Landlord ↔ Tenant lean methodology
- Overall (STATE)
- 87 Strongly Landlord-Friendly
- State Florida
- 87 Strongly Landlord-Friendly · R+3
- County
- — inherits STATE
- City
- — inherits STATE
ZIP-level market 33755
- Rents YoY
- -2.2%
- Active inventory
- 261
- Price-to-rent
- 8.5×
Monthly cashflow live
- Estimated rent
- $2,652 high interval (Pro) →
- Mortgage (P&I)
- −$1,416
- Tax from tax record
- −$175 /mo · $2,099/yr
- Insurance
- −$112
- HOA
- −$0
- Vacancy / Maint / Mgmt
- −$557
- Net cashflow
- $392
Break-even live
UW: 25.0% down · 7.5% · 30yr · 1.5% tax · 5.0% vac · 8.0% maint · 8.0% mgmt
Financing live
Cash to close
- Down payment
- $67,500
- Closing costs
- $8,100
- Reserves months
- —
- Total cash needed
- —
Loan-product check · same deal, 3 products live
Conventional
25% down · 7.5% · 30yr
- Down + closing
- —
- Monthly P&I
- —
- Monthly cashflow
- —
- DSCR
- —
- Eligible?
- —
Personal DTI + credit; lowest rate.
DSCR
20% down · 8.5% · 30yr
- Down + closing
- —
- Monthly P&I
- —
- Monthly cashflow
- —
- DSCR
- —
- Eligible?
- —
No personal income docs; deal must DSCR.
Hard money
10% down · 12.0% · 12mo
- Down + closing
- —
- Monthly P&I
- —
- Monthly cashflow
- —
- DSCR
- —
- Eligible?
- —
Short-term bridge; refi at stabilization.
Rent comps 27 comps
| Address | Beds | Baths | Sqft | Rent | $/sqft | DOM | Units | Dist |
|---|---|---|---|---|---|---|---|---|
| 1614 N Washington Ave Clearwater, FL | 3.0 | 2.0 | 1372 | $2,550 | $1.86 | 24d | 1 | 0.10mi |
| 1004 Osage St Clearwater, FL | 3.0 | 2.0 | 1282 | $2,450 | $1.91 | 14d | 1 | 0.27mi |
| 1614 N Osceola Ave Clearwater, FL | 4.0 | 2.0 | 1556 | $2,600 | $1.67 | 4d | 1 | 0.35mi |
| 409 Lebeau St Clearwater, FL | 3.0 | 1.0 | 1026 | $1,850 | $1.80 | 7d | 1 | 0.35mi |
| 418 Lebeau St Clearwater, FL | 3.0 | 2.0 | 1400 | $2,800 | $2.00 | 24d | 1 | 0.35mi |
| 1144 La Salle St Clearwater, FL | 3.0 | 2.0 | 1317 | $2,200 | $1.67 | 24d | 1 | 0.39mi |
| 1149 La Salle St Clearwater, FL | 3.0 | 3.0 | 1666 | $2,495 | $1.50 | 24d | 1 | 0.41mi |
| 1822 Pineland Dr Clearwater, FL | 4.0 | 2.0 | 1652 | $2,900 | $1.76 | 4d | 1 | 0.46mi |
| 1512 Stevensons Dr Clearwater, FL | 4.0 | 1.0 | 1127 | $3,250 | $2.88 | 4d | 1 | 0.49mi |
| 1020 Sunset Point Rd Clearwater, FL | 3.0 | 3.0–3.5 | 2674 | $16,500 | $6.17 | 7d | 2 | 0.57mi |
| 1103 Charles St Clearwater, FL | 3.0 | 2.0 | 1348 | $3,295 | $2.44 | 14d | 1 | 0.72mi |
| 1280 Bertland Way Clearwater, FL | 3.0 | 1.0 | 922 | $1,900 | $2.06 | 4d | 1 | 0.80mi |
| 906 Hart St Clearwater, FL | 3.0 | 2.0 | 1360 | $2,336 | $1.72 | 14d | 1 | 0.89mi |
| 311 Pennsylvania Ave Clearwater, FL | 3.0 | 2.0 | 1220 | $2,300 | $1.89 | 24d | 1 | 0.91mi |
| 905 Jones St Clearwater, FL | 3.0 | 2.0 | 1072 | $2,450 | $2.29 | 24d | 1 | 0.98mi |
| 21 Highland Ave Dunedin, FL | 3.0 | 2.0 | 1160 | $2,700 | $2.33 | 24d | 1 | 1.11mi |
| 662 Union St Unit 1A Dunedin, FL | 3.0 | 1.0 | 1100 | $1,749 | $1.59 | 22d | 1 | 1.20mi |
| 628 Cleveland St Clearwater, FL | 2.0–3.0 | 2.0 | 1666 | $3,750 | $2.25 | 24d | 2 | 1.22mi |
| 1564 Scott St Clearwater, FL | 3.0 | 2.0 | 1152 | $2,200 | $1.91 | 24d | 1 | 1.24mi |
| 1601 Long St Clearwater, FL | 4.0 | 2.0 | 1726 | $2,300 | $1.33 | 14d | 1 | 1.32mi |
| 1279 Park St Unit n/a Clearwater, FL | 3.0 | 2.5 | 1300 | $2,450 | $1.88 | 24d | 1 | 1.35mi |
| 253 Park Cir S Dunedin, FL | 3.0 | 2.0 | 1500 | $4,500 | $3.00 | 4d | 1 | 1.35mi |
| 331 Cleveland St Clearwater, FL | 2.0–3.0 | 2.0–2.5 | 1962 | $7,500 | $3.82 | 24d | 3 | 1.36mi |
| 1264 Pierce St Clearwater, FL | 3.0 | 2.5 | 1436 | $2,500 | $1.74 | 22d | 1 | 1.37mi |
| 1276 Pierce St Unit 1276 Clearwater, FL | 3.0 | 2.5 | 1450 | $2,550 | $1.76 | 4d | 1 | 1.38mi |
| 16 N San Remo Ave Clearwater, FL | 3.0 | 1.0 | 1249 | $1,795 | $1.44 | 24d | 1 | 1.45mi |
| 125 Island Way #502 Clearwater Beach, FL | 3.0 | 2.0 | 1850 | $4,900 | $2.65 | 24d | 1 | 1.49mi |
Listing history 13 events
-
2026-06-07statusdays on market $270,000 Pending 110 DOM
-
2026-06-04pricedays on market $270,000 Active 108 DOM
-
2026-06-03days on market $280,000 Active 107 DOM
-
2026-06-01days on market $280,000 Active 105 DOM
-
2026-05-31days on market $280,000 Active 104 DOM
-
2026-05-10status Active
-
2026-05-01status Pending
-
2026-04-24price $290,000
-
2026-04-12price $300,000
-
2026-03-31price $310,000
-
2026-03-27price $320,000
-
2026-03-11price $325,000
-
2026-02-06$330,000 Active
ⓘ Source: listings_history table (triggers on properties + properties_extension) + one-shot
backfill from property_details.listing_events for pre-trigger history.
Tax reassessment forecast FL · Resets to sale price
- Current annual tax
- $2,099 · $175/mo
- Projected year-2 tax
- $2,241 · $187/mo
- Expected delta
- +$142/yr (+$12/mo · 6.8%)
ⓘ Screening estimate from a state-policy table — verify with the county assessor before closing.
Climate risk First Street
- Flood 1/10 Low FEMA zone X (unshaded) · 0% chance over 30 yrs
- Wildfire 1/10 Low
- Heat 10/10 Extreme 7 d/yr ≥107°F today · 27 d/yr by 30 yrs out
- Wind 10/10 Extreme 99% chance of damaging wind over 30 yrs
- Air quality 3/10 Moderate 2 unhealthy d/yr today · 3 by 30 yrs out
Nearby sold comps map
Loading sold comps map…
Walkable amenities ~0.75 mi
Loading nearby amenities…
Taxation est. · year 1
- Rental income
- $31,828
- − Mortgage interest
- −$15,124
- − Property taxes
- −$2,099
- − Insurance
- −$1,350
- − Repairs & maintenance
- −$2,546
- − Management
- −$2,546
- − Depreciation
- −$7,855
- Taxable income
- $308
- Est. tax owed @ 24.0%
- −$74
- After-tax cash flow
- $4,630/yr
For passive investors: Depreciation is non-cash, so a rental often shows a tax loss while cash-flowing — sheltering income. Rental losses are passive: they offset passive income freely, and up to $25,000/yr can offset ordinary (W-2) income if you actively participate and your MAGI is under $100k (phasing out to $0 by $150k); unused losses carry forward. On sale, claimed depreciation is recaptured at up to 25%, and gains may owe capital-gains tax (a 1031 exchange can defer both). Figures are a year-1 estimate at your 24.0% rate — not tax advice; consult a CPA.
Schools (NCES district)
- District
- Pinellas
- NCES district ID
- 1201560
- Math proficiency
- 51% ▼ -5.00%
- Reading proficiency
- 51% ▼ -3.00%
- Median HH income
- $46,270
- Composite
- 43.27/100
- National rank
- #3046
- State rank
- #31 of 73 in FL
Livability — Clearwater
- Score
- 82/100
- State rank
- #60
- US rank
- #988
Category grades
Schools grade is shown separately in the Schools card above.
Census & demographics
- Census place
- Clearwater, FL
- County
- Pinellas County · 939,478 people
- City population
- 170,933
- Metro
- Tampa-St. Petersburg-Clearwater, FL
- Population (ZIP)
- 27,476
- Household income
- $62,886
- Rent vs Own
- Severe rent burden
- 1511.0
Population outlook (Pinellas County) Hauer SSP2
- Today (2025)
- 1,027,532 people
- By 2030
- 1,063,586 · +3.5%
- By 2040
- 1,125,020 · +9.5%
- By 2050
- 1,168,637 · +13.7%
- By 2075
- 1,265,188 · +23.1%
- By 2100
- 1,260,357 · +22.7%
Race, ethnicity, and origin ACS 2023
- Neighborhood character
- Diverse neighborhood (Simpson 0.63)
- Race & ethnicity
- White 54% Black 22% Hispanic / Latino 17% Two or more races 10% Asian 3%
- Hispanic origin (detail)
- Mexican 6% Puerto Rican 5% Cuban 1%
- Common ancestry
- Romanian 2% Italian 2% Arab 1%
- Foreign-born
- 15% · Canada
- Languages at home
- 78% English-only · Spanish 13% Other Indo-European 3% Russian/Polish/Slavic 2%
Political lean MEDSL · Pinellas
- 2024 margin
- Lean R (+5.2) · D 46.9% · R 52.1%
- 2008→2024 swing
- -13.5pp toward R · 2008: 8.3pp · 2024: -5.2pp
- All cycles
- 2024: R+5.2 2020: D+0.2 2016: R+1.1 2012: D+5.6 2008: D+8.3
Not yet ingested
- Civics
- —
Market trends
- HPI YoY
- ▼ -472.62%
- Current HPI
- 351.4973
- Rent YoY
- ▼ -2.20%
- Metro
- Tampa-St. Petersburg-Clearwater, FL
- State GDP YoY
- ▲ 3.28%
- F500 in state
- 36
Industry mix (Fortune 500 HQ in FL)
| Industry | F500 HQs | Revenue |
|---|---|---|
| Industrial Technology | 2 | $29B |
|
||
| Insurance | 2 | $17B |
|
||
| Retail | 1 | $60B |
|
||
| Technology Distribution | 1 | $58B |
|
||
| Homebuilding | 1 | $35B |
|
||
| Technology Manufacturing | 1 | $35B |
|
||
Price history
-12.1% since first listed8 events — show timeline
- 2026-05-10 Relisted — Stellar MLS as Distributed by MLS Grid
- 2026-05-01 Pending — Stellar MLS as Distributed by MLS Grid
- 2026-04-24 Price Changed $290,000 Stellar MLS as Distributed by MLS Grid
- 2026-04-12 Price Changed $300,000 Stellar MLS as Distributed by MLS Grid
- 2026-03-31 Price Changed $310,000 Stellar MLS as Distributed by MLS Grid
- 2026-03-27 Price Changed $320,000 Stellar MLS as Distributed by MLS Grid
- 2026-03-11 Price Changed $325,000 Stellar MLS as Distributed by MLS Grid
- 2026-02-06 Listed $330,000 Stellar MLS as Distributed by MLS Grid
Property tax history
+3.1%/yrLatest (2025): $2,099 · +13.7% YoY. Source: county tax records.
Cash-flow waterfall
monthlySold comps — $/sqft
last 12 mo · ≤1 miLoading sold comps…