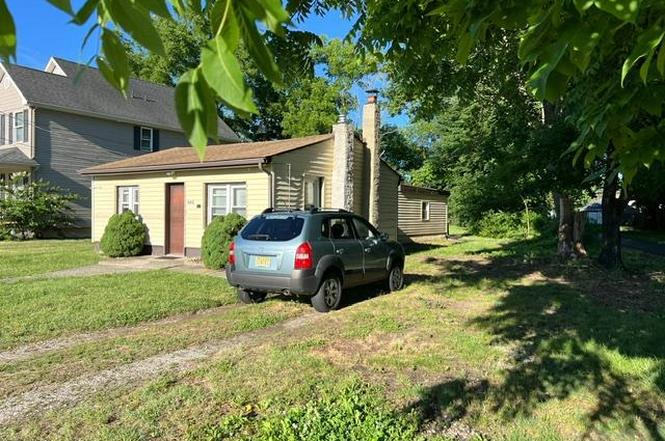
543 Blue Bell Rd · Williamstown, NJ
Flood risk 1/10 · Minimal
- FEMA flood zone
- X (unshaded)
- Chance of flooding over 30 yrs
- 0.0%
- Est. flood insurance / yr
- $507 – $1,088
Fire risk 3/10 · Minor
- Est. fire insurance / yr
- $526 – $976
Heat risk 7/10 · Major
- Hot days now (above 103°F)
- 7 days/yr
- Hot days in 30 yrs
- 15 days/yr
Wind risk 6/10 · Moderate
- Chance of severe wind over 30 yrs
- 63.0%
Air-quality risk 3/10 · Minor
- Unhealthy air days now
- 2 days/yr
- Unhealthy air days in 30 yrs
- 4 days/yr
Risk factors via First Street. Map © Google.
Why this score? — see what drove the B- grade
The composite is a weighted blend of 9 inputs, each scored 0–100. Each bar is that input's sub-score; the figure is the points it added to the 100-point composite (weight × sub-score).
- Cash flow +24.8/30.0
- ARV discount +15.0/15.0
- DSCR +8.0/10.0
- 1% rule +7.1/10.0
- Livability +3.5/5.0
- Schools +3.0/10.0
- Rent growth +2.5/5.0
- Condition / age +2.5/5.0
- Appreciation +0.0/10.0
$189,900
🖨 Deal sheet (PDF) 📄 Offer letter ✓ Due diligence
Listing remarks MLS
Handyman Special! 2 Bdrm Rancher featuring Living Room w/ Wood Stove, Gas Heat, Vinyl Siding, Fenced Yard, Wood Deck, Partial Basement & More! Property needs repairs, Being Sold in it's "AS IS" Condition. Buyer responsible for C/O.
Key facts
- 0.26 acre lot
- Built 1955
- Listed 91 days
Property features AI
Finance
- Other: Ownership: Fee simple; Year built source: Assessor
Exterior
- Parking: Driveway
- Utilities: Public water; Public sewer
- Home design: Detached structure; Above-grade finished area per assessor (1,116)
- Construction: Block construction; Block foundation; Other structures above and below grade
- Exterior features: Lot dimensions approximately 50 x 225
Interior
- Bedrooms: 2 bedrooms on the main level
- Bathrooms: 1 full bathroom (main level); 1 full bathroom total
- Heating & cooling: Forced air heating; Hot water heating; Natural gas heating fuel; Electric cooling; Electric hot water
- Interior features: Full basement; Living area per assessor
Neighborhood map
What this means for you Summary
Snapshot
- This is a 2-bed/1.0-bath single-family listed at $190k.
Deal economics
- At list price, monthly cash flow is $399 ($5k/yr) — positive.
- The deal already cash-flows at list — no discount required.
- Meets the 1% rule at list price ($2k rent vs $190k).
- Recommended offer: $173k (9.0% below list) — sets the bar for market timing.
- Cap rate 8.8% vs local median 4.9% in Williamstown — top-decile yield for the area; either an underpriced asset or a hidden risk that comps aren't pricing in. Stress-test before assuming the spread holds.
Location & tenants
- Location reads 69/100 on livability (#289 in NJ) — a middle-class / working-renter tenant base. Strengths: employment A+, housing A+; Watch: cost of living D+, amenities F, commute F.
- Monroe Township Public School District (suburban): math 20% / reading 45% proficiency, ranked #302 of 472 in NJ (top 64%) — families likely to look elsewhere, expect single-tenant / working-renter base with shorter leases.
- Zoned schools: Williamstown High School (math 21% / reading 50%, grade F, #234 of 399 statewide, top 59%, 1,782 students, 26% FRL) — zoned schools at 26% FRL track the district average.
- Market conditions: 270 active listings in the ZIP; 6 comparable units currently listed for rent nearby; rentals leasing fast (median 0d on market — plan ~1-2 weeks tenant-placement turnaround); solid renter incomes; 1,047 units permitted in Gloucester County in 2024 (183 in 5+ unit buildings).
Forward outlook
- Local home prices are declining (-3.0%/yr); year-one equity from $1k of loan paydown is wiped out by about $6k of value loss. Plan a longer hold.
- Gloucester County population projected to shrink 5% by 2050 — rents likely to lag national; underwrite the cash flow, not the appreciation.
Negotiation context
- It's been on market 92 days — a 9% lower offer ($173k) is reasonable based on typical stale-listing flexibility.
- 5 sale attempts since 27y ago; this cycle's ask has dropped $60k (24%) from the opening price — seller is motivated, your offer sets the floor, not the list.
- Current owner paid $64k; list at $190k implies a 196% gain — meaningful room to come down on a strong offer.
Risks & watch-outs
- Watch-outs: built in 1955 — expect roof / HVAC / electrical / plumbing capex.
- Climate carrying-cost: major wind risk, 63% chance of damaging wind over 30y; extreme-heat days projected 7→15/yr by 2055 (HVAC capex compounding) — expect insurance premiums to compound above CPI over the hold.
Questions for the listing agent
- It's been on market 92 days. Have you received any prior offers? Is the seller open to a 9% concession, seller financing, or rate buy-down credit?
- Built in 1955 — when were the roof, HVAC, electrical panel, plumbing, and water heater last replaced?
- Why hasn't it sold? Are there any deal-killer items the seller is aware of (foundation, flood, title, zoning, code violations)?
- Is there a deadline driving the sale (1031 exchange, divorce, estate, relocation)? That informs how much negotiation room exists.
- What's the average days-on-market for RENTAL listings here right now (not sales)? A rising rental-DOM trend means longer vacancies and softer asking-rent achievability than the comps imply.
- What's the recent tenant-quality profile in this submarket — average credit score on applications, eviction rate, late-payment / NSF rate, and stable-employment percentage? A property-management company in the area should have these aggregated.
- How much new for-sale + rental construction is in the pipeline within 1–3 miles? Heavy new supply typically softens prices + rents 12–24 months out; constrained supply supports both.
Investment metrics
- 1% rule
- 1.21% ✓
- Cap rate
- 8.81%
- Cash-on-cash
- 9.00%
- DSCR
- 1.40
- GRM
- 6.9
CMA / ARV
- ARV (on-the-fly)
- $297,972
- Comps found
- 12
Show comp detail 12 sales within ~0.75 mi
| Address | Dist | Beds/Ba | Sqft | Sold | Price | $/sf | Match |
|---|---|---|---|---|---|---|---|
| 112 Shisler Ave | 0.09mi | 3/1.0 (+1) | 1,008 (-10%) | 6mo | $290,000 | $288 | 70 |
| 63 Linwood Ave | 0.31mi | 3/1.0 (+1) | 1,192 (+7%) | 2mo | $315,000 | $264 | 68 |
| 135 Oak St | 0.17mi | 3/1.0 (+1) | 1,008 (-10%) | 6mo | $265,000 | $263 | 65 |
| 18 Bodine Ave | 0.43mi | 2/1.0 | 1,040 (-7%) | 6mo | $155,000 | $149 | 63 |
| 1217 S Beecham Rd | 0.63mi | 3/1.0 (+1) | 1,104 (-1%) | 14mo | $314,000 | $284 | 52 |
| 1018 Micawber Dr | 0.56mi | 3/1.0 (+1) | 1,248 (+12%) | 2mo | $315,000 | $252 | 48 |
| 323 Clinton Ave | 0.38mi | 3/1.0 (+1) | 1,241 (+11%) | 17mo | $290,000 | $234 | 45 |
| 1035 S Beecham Rd | 0.64mi | 3/1.0 (+1) | 1,040 (-7%) | 11mo | $315,000 | $303 | 44 |
| 422 Winslow Rd | 0.59mi | 2/2.0 | 1,032 (-8%) | 14mo | $321,000 | $311 | 44 |
| 1011 S Beecham Rd | 0.54mi | 3/1.5 (+1) | 1,275 (+14%) | 5mo | $340,000 | $267 | 40 |
| 1164 S Beecham Rd | 0.72mi | 3/1.0 (+1) | 1,040 (-7%) | 14mo | $285,000 | $274 | 38 |
| 335 Walnut St | 0.72mi | 3/1.0 (+1) | 1,252 (+12%) | 13mo | $290,000 | $232 | 30 |
Match score weights: distance 35% · size 25% · config 20% · recency 20%. Top-matched comps best support the ARV.
Projected returns pro-forma
-3.0% appreciation · 3.0% rent growth · sell at horizon
- IRR
- -2.6%
- Equity multiple
- 0.90×
- Total profit
- $-5,267
- Equity at exit
- $28,315
- IRR
- 7.1%
- Equity multiple
- 1.54×
- Total profit
- $28,524
- Equity at exit
- $16,419
Cash invested: $53,172 (down + closing). Projections, not guarantees.
Landlord ↔ Tenant lean methodology
- Overall (STATE)
- 21 Tenant-Leaning
- State New Jersey
- 21 Tenant-Leaning · D+6
- County
- — inherits STATE
- City
- — inherits STATE
ZIP-level market 08094
- Active inventory
- 270
- Price-to-rent
- 6.9×
Monthly cashflow live
- Estimated rent
- $2,294 high interval (Pro) →
- Mortgage (P&I)
- −$996
- Tax from tax record
- −$338 /mo · $4,059/yr
- Insurance
- −$79
- HOA
- −$0
- Vacancy / Maint / Mgmt
- −$482
- Net cashflow
- $399
Break-even live
Sensitivity live
| Price | -10% $506 | -5% $453 | +0% $399 | +5% $345 | +10% $291 |
|---|---|---|---|---|---|
| Rent | -10% $218 | -5% $308 | +0% $399 | +5% $490 | +10% $580 |
| Rate | -1.0pp $495 | -0.5pp $447 | base $399 | +0.5pp $350 | +1.0pp $300 |
UW: 25.0% down · 7.5% · 30yr · 1.5% tax · 5.0% vac · 8.0% maint · 8.0% mgmt
Financing live
Cash to close
- Down payment
- $47,475
- Closing costs
- $5,697
- Reserves months
- —
- Total cash needed
- —
Loan-product check · same deal, 3 products live
Conventional
25% down · 7.5% · 30yr
- Down + closing
- —
- Monthly P&I
- —
- Monthly cashflow
- —
- DSCR
- —
- Eligible?
- —
Personal DTI + credit; lowest rate.
DSCR
20% down · 8.5% · 30yr
- Down + closing
- —
- Monthly P&I
- —
- Monthly cashflow
- —
- DSCR
- —
- Eligible?
- —
No personal income docs; deal must DSCR.
Hard money
10% down · 12.0% · 12mo
- Down + closing
- —
- Monthly P&I
- —
- Monthly cashflow
- —
- DSCR
- —
- Eligible?
- —
Short-term bridge; refi at stabilization.
Rent comps 6 comps
| Address | Beds | Baths | Sqft | Rent | $/sqft | DOM | Units | Dist |
|---|---|---|---|---|---|---|---|---|
| 401 Blue Bell Rd Unit C Williamstown, NJ | 3.0 | 1.0 | 1000 | $1,700 | $1.70 | 0d | 1 | 0.16mi |
| 62 Washington Ave Williamstown, NJ | 3.0 | 1.5 | 1434 | $2,600 | $1.81 | 8d | 1 | 0.36mi |
| 401 N Main St Williamstown, NJ | 1.0–2.0 | 1.0 | 860 | $1,825 | $2.12 | 0d | 1 | 0.93mi |
| 15 Kent Rd Williamstown, NJ | 1.0–2.0 | 1.0 | 850 | $1,925 | $2.26 | 0d | 1 | 0.96mi |
| 601 N Black Horse Pike Williamstown, NJ | 2.0 | 1.0 | 760 | $1,938 | $2.55 | 0d | 1 | 1.05mi |
| 385 N Tuckahoe Rd Unit 969 Williamstown, NJ | 3.0 | 2.5 | 1500 | $2,999 | $2.00 | 25d | 1 | 1.48mi |
Listing history 21 events
-
2026-06-21days on market $189,900 Active 92 DOM
-
2026-06-18days on market $189,900 Active 89 DOM
-
2026-06-17days on market $189,900 Active 88 DOM
-
2026-06-16days on market $189,900 Active 87 DOM
-
2026-06-15days on market $189,900 Active 86 DOM
-
2026-06-13pricestatusdays on market $189,900 Active 84 DOM
-
2026-05-04historical Active Under Contract
-
2026-04-02price $200,000
-
2026-02-12$250,000 Active
-
2009-01-26soldstatus $64,250 248-char remark
Show marketing remark (248 chars)
Handyman Special! 2 Bdrm Rancher featuring Living Room w/ Wood Stove, Gas Heat, Vinyl Siding, Fenced Yard, Wood Deck, Partial Basement & More! Property needs repairs, Being Sold in it's "AS IS" Condition. Buyer responsible for C/O.
-
2009-01-07historical 248-char remark
Show marketing remark (248 chars)
Handyman Special! 2 Bdrm Rancher featuring Living Room w/ Wood Stove, Gas Heat, Vinyl Siding, Fenced Yard, Wood Deck, Partial Basement & More! Property needs repairs, Being Sold in it's "AS IS" Condition. Buyer responsible for C/O.
-
2008-08-22$69,000 248-char remark
Show marketing remark (248 chars)
Handyman Special! 2 Bdrm Rancher featuring Living Room w/ Wood Stove, Gas Heat, Vinyl Siding, Fenced Yard, Wood Deck, Partial Basement & More! Property needs repairs, Being Sold in it's "AS IS" Condition. Buyer responsible for C/O.
-
2008-07-28historical
-
2008-04-29$86,900
-
2008-03-28historical
-
2007-12-13$98,100
-
2000-03-06soldstatus $63,000
-
2000-03-02soldstatus $63,000
-
2000-02-28historical
-
1999-09-15$63,000
-
1986-12-23soldstatus $44,900
ⓘ Source: listings_history table (triggers on properties + properties_extension) + one-shot
backfill from property_details.listing_events for pre-trigger history.
Tax reassessment forecast NJ · Partial reset (capped growth)
- Current annual tax
- $4,059 · $338/mo
- Projected year-2 tax
- $4,394 · $366/mo
- Expected delta
- +$335/yr (+$28/mo · 8.2%)
ⓘ Screening estimate from a state-policy table — verify with the county assessor before closing.
Climate risk First Street
- Flood 1/10 Low FEMA zone X (unshaded) · 0% chance over 30 yrs
- Wildfire 3/10 Moderate
- Heat 7/10 Severe 7 d/yr ≥103°F today · 15 d/yr by 30 yrs out
- Wind 6/10 Major 63% chance of damaging wind over 30 yrs
- Air quality 3/10 Moderate 2 unhealthy d/yr today · 4 by 30 yrs out
Nearby sold comps map
Loading sold comps map…
Walkable amenities ~0.75 mi
Loading nearby amenities…
Taxation est. · year 1
- Rental income
- $27,527
- − Mortgage interest
- −$10,637
- − Property taxes
- −$4,059
- − Insurance
- −$950
- − Repairs & maintenance
- −$2,202
- − Management
- −$2,202
- − Depreciation
- −$5,524
- Taxable income
- $1,952
- Est. tax owed @ 24.0%
- −$469
- After-tax cash flow
- $4,319/yr
For passive investors: Depreciation is non-cash, so a rental often shows a tax loss while cash-flowing — sheltering income. Rental losses are passive: they offset passive income freely, and up to $25,000/yr can offset ordinary (W-2) income if you actively participate and your MAGI is under $100k (phasing out to $0 by $150k); unused losses carry forward. On sale, claimed depreciation is recaptured at up to 25%, and gains may owe capital-gains tax (a 1031 exchange can defer both). Figures are a year-1 estimate at your 24.0% rate — not tax advice; consult a CPA.
Schools (NCES district)
- District
- Monroe Township Public School District
- NCES district ID
- 3410470
- Math proficiency
- 20% ▼ -24.00%
- Reading proficiency
- 45% ▼ -9.00%
- Median HH income
- $71,557
- Composite
- 30.24/100
- National rank
- #6295
- State rank
- #302 of 472 in NJ
Livability — Williamstown
- Score
- 69/100
- State rank
- #289
- US rank
- #8603
Category grades
Schools grade is shown separately in the Schools card above.
Census & demographics
- Census place
- Williamstown, NJ
- County
- Gloucester County · 160,422 people
- City population
- 41,595
- Metro
- Philadelphia-Camden-Wilmington, PA-NJ-DE-MD
- Population (ZIP)
- 41,595
- Household income
- $96,699
- Rent vs Own
- Severe rent burden
- 721.0
Population outlook (Gloucester County) Hauer SSP2
- Today (2025)
- 298,895 people
- By 2030
- 299,031 · +0.0%
- By 2040
- 294,020 · -1.6%
- By 2050
- 284,188 · -4.9%
- By 2075
- 260,720 · -12.8%
- By 2100
- 229,565 · -23.2%
Race, ethnicity, and origin ACS 2023
- Neighborhood character
- Predominantly White (73%)
- Race & ethnicity
- White 73% Hispanic / Latino 11% Black 10% Two or more races 8% Asian 1%
- Hispanic origin (detail)
- Puerto Rican 6% Dominican 1%
- Common ancestry
- Romanian 6% Slovak 2% Lithuanian 1%
- Foreign-born
- 4% · Canada
- Languages at home
- 92% English-only · Spanish 5% Russian/Polish/Slavic 1%
Political lean MEDSL · Gloucester
- 2024 margin
- Toss-up / Even · D 47.8% · R 50.6% · Other 1.6%
- 2008→2024 swing
- -15.0pp toward R · 2008: 12.2pp · 2024: -2.8pp
- All cycles
- 2024: R+2.8 2020: D+1.9 2016: R+0.4 2012: D+10.5 2008: D+12.2
Not yet ingested
- Civics
- —
Market trends
- HPI YoY
- ▼ -213.12%
- Current HPI
- 278.3849
- Rent YoY
- —
- Metro
- Philadelphia-Camden-Wilmington, PA-NJ-DE-MD
- State GDP YoY
- ▲ 2.05%
- F500 in state
- 34
Industry mix (Fortune 500 HQ in NJ)
| Industry | F500 HQs | Revenue |
|---|---|---|
| Consumer Goods | 3 | $31B |
|
||
| Pharmaceuticals | 2 | $153B |
|
||
| Technology | 2 | $21B |
|
||
| Insurance | 2 | $20B |
|
||
| Healthcare | 2 | $19B |
|
||
| Financial Services | 1 | $70B |
|
||
Price history
+345.4% since first listed15 events — show timeline
- 2026-05-04 Contingent — BRIGHT MLS
- 2026-04-02 Price Changed $200,000 BRIGHT MLS
- 2026-02-12 Listed $250,000 BRIGHT MLS
- 2009-01-26 Sold (MLS) $64,250 BRIGHT MLS
- 2009-01-07 Listing Removed — BRIGHT MLS
- 2008-08-22 Listed $69,000 BRIGHT MLS
- 2008-07-28 Listing Removed — BRIGHT MLS
- 2008-04-29 Listed $86,900 BRIGHT MLS
- 2008-03-28 Listing Removed — BRIGHT MLS
- 2007-12-13 Listed $98,100 BRIGHT MLS
- 2000-03-06 Sold (Public Records) $63,000 Public Records
- 2000-03-02 Sold (MLS) $63,000 BRIGHT MLS
- 2000-02-28 Listing Removed — BRIGHT MLS
- 1999-09-15 Listed $63,000 BRIGHT MLS
- 1986-12-23 Sold (Public Records) $44,900 Public Records
Property tax history
+1.8%/yrLatest (2025): $4,059 · +2.9% YoY. Source: county tax records.
Cash-flow waterfall
monthlySold comps — $/sqft
last 12 mo · ≤1 miLoading sold comps…