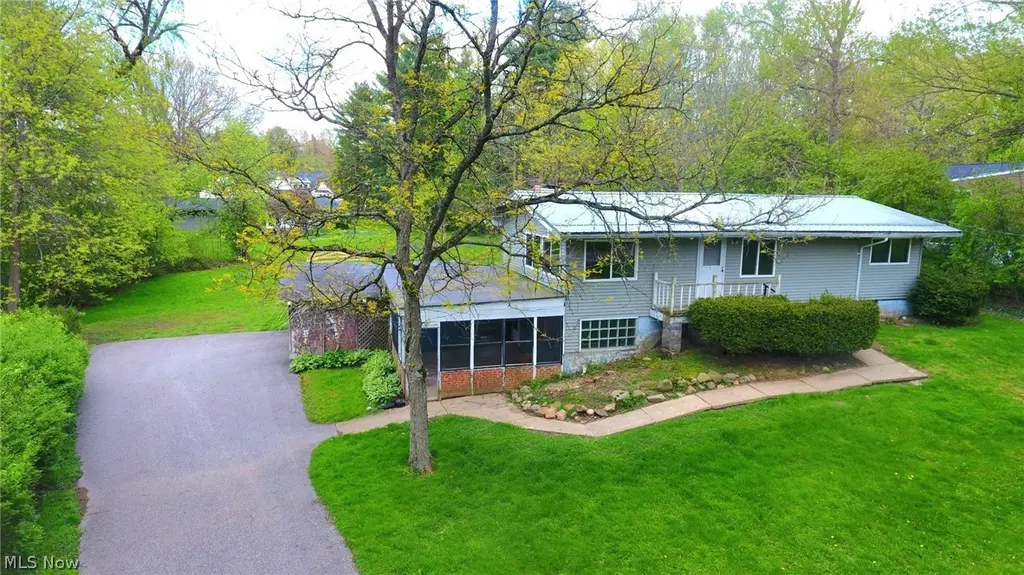
7620 Birchmont Dr · South Russell, OH
Flood risk 1/10 · Minimal
- FEMA flood zone
- X (unshaded)
- Chance of flooding over 30 yrs
- 0.0%
- Est. flood insurance / yr
- $473 – $860
Fire risk 1/10 · Minimal
- Est. fire insurance / yr
- $713 – $1,323
Heat risk 2/10 · Minimal
- Hot days now (above 94°F)
- 7 days/yr
- Hot days in 30 yrs
- 17 days/yr
Wind risk 1/10 · Minimal
- Chance of severe wind over 30 yrs
- —
Air-quality risk 3/10 · Minor
- Unhealthy air days now
- 2 days/yr
- Unhealthy air days in 30 yrs
- 4 days/yr
Risk factors via First Street. Map © Google.
Why this score? — see what drove the C+ grade
The composite is a weighted blend of 9 inputs, each scored 0–100. Each bar is that input's sub-score; the figure is the points it added to the 100-point composite (weight × sub-score).
- Cash flow +19.2/30.0
- ARV discount +15.0/15.0
- Schools +7.9/10.0
- DSCR +6.1/10.0
- 1% rule +6.0/10.0
- Livability +3.2/5.0
- Rent growth +2.5/5.0
- Condition / age +2.5/5.0
- Appreciation +0.0/10.0
$245,000
🖨 Deal sheet 📄 Offer letter ✓ Due diligence
Listing remarks
SELLER SAYS MAKE AN OFFER! Fantastic opportunity to give this home it's chance to shine again! Located within 1.4 miles to downtown Chagrin Falls where you will find so many fun places to explore! Wait until you see this very spacious family room with beamed and vaulted ceilings, wood burning fireplace and large picture windows overlooking the lush front and side yard! Most of the high-ticket items have been replaced! Starting with the new roof in 2024, furnace and central air in 2025, Hot water heater in 2024, water softener approximately 2 years, windows approx. 9 years old and the rubber roof over the porch was done approx. 2022. Bathrooms upstairs were recently getting a great start to
Key facts
- Water softener
- Hot water heater
- Rubber roof
Tags
Property features AI
Exterior
- Parking: Attached garage; 2 garage spaces; Asphalt driveway; Garage faces side
- Utilities: Public sewer; Well water
- Home design: Single-story house; Block foundation; Vinyl siding exterior; Asphalt/fiberglass roof
- Construction: Built (year per public records); Vinyl siding construction; Block foundation; Asphalt/fiberglass roof
- Exterior features: Enclosed porch; Patio; Porch; Less than half acre lot; Lot dimensions approximately 108 x irregular
Interior
- Kitchen: Built-in oven; Cooktop; Dishwasher; Refrigerator
- Bedrooms: 3 main-level bedrooms
- Flooring: Carpet; Wood; Ceramic tile; Laminate
- Bathrooms: 2 full bathrooms; 1 half bathroom; 2 bathrooms on the main level
- Heating & cooling: Forced-air heating (gas); Fireplace heating option; Central air conditioning
- Interior features: Beamed ceilings; Vaulted ceilings; High ceilings; Built-in features; Double-pane windows; Living room wood-burning fireplace (1)
- Laundry & utility: Laundry in basement
Neighborhood map
What this means for you Summary
Snapshot
- This is a 3-bed/2.0-bath single-family listed at $245k.
Deal economics
- At list price, monthly cash flow is $266 ($3k/yr) — positive.
- The deal already cash-flows at list — no discount required.
- Meets the 1% rule at list price ($3k rent vs $245k).
- Recommended offer: $241k (1.5% below list) — sets the bar for market timing.
- Cap rate 7.6% vs local median 2.3% in South Russell — top-decile yield for the area; either an underpriced asset or a hidden risk that comps aren't pricing in. Stress-test before assuming the spread holds.
Location & tenants
- Location reads 65/100 on livability (#731 in OH) — a middle-class / working-renter tenant base. Strengths: crime A+, employment A+, housing A+; Watch: amenities F, commute F, cost of living D-.
- Chagrin Falls Exempted Village (suburban): math 87% / reading 90% proficiency, ranked #6 of 656 in OH (top 1%) — strong family-tenant draw, lease renewals of 3-5y typical; only 3% free/reduced lunch — higher-income household profile.
- Market conditions: 125 active listings in the ZIP; 1 comparable units currently listed for rent nearby; high-income renter base; 220 units permitted in Geauga County in 2024 (0 in 5+ unit buildings).
Forward outlook
- Local home prices are declining (-3.0%/yr); year-one equity from $2k of loan paydown is wiped out by about $7k of value loss. Plan a longer hold.
- Geauga County population projected to shrink 7% by 2050 — rents likely to lag national; underwrite the cash flow, not the appreciation.
Negotiation context
- It's been on market 22 days — a 2% lower offer ($241k) is reasonable based on typical stale-listing flexibility.
- Current owner paid $199k; 23% above their basis — modest negotiation headroom, anchor on the comps not their cost.
Risks & watch-outs
- Watch-outs: built in 1954 — expect roof / HVAC / electrical / plumbing capex.
Questions for the listing agent
- Built in 1954 — when were the roof, HVAC, electrical panel, plumbing, and water heater last replaced?
- Is there a deadline driving the sale (1031 exchange, divorce, estate, relocation)? That informs how much negotiation room exists.
- What's the average days-on-market for RENTAL listings here right now (not sales)? A rising rental-DOM trend means longer vacancies and softer asking-rent achievability than the comps imply.
- What's the recent tenant-quality profile in this submarket — average credit score on applications, eviction rate, late-payment / NSF rate, and stable-employment percentage? A property-management company in the area should have these aggregated.
- How much new for-sale + rental construction is in the pipeline within 1–3 miles? Heavy new supply typically softens prices + rents 12–24 months out; constrained supply supports both.
Investment metrics
- 1% rule
- 1.10% ✓
- Cap rate
- 7.60%
- Cash-on-cash
- 4.65%
- DSCR
- 1.21
- GRM
- 7.6
CMA / ARV
- ARV (median comp)
- $369,135
- List price
- $245,000
- Delta
- -33.63%
- Verdict
- UNDERPRICED
- Comps
- 20 within 1.0 mi
Show comp detail 12 sales within ~0.75 mi
| Address | Dist | Beds/Ba | Sqft | Sold | Price | $/sf | Match |
|---|---|---|---|---|---|---|---|
| 7620 Birchmont Dr | 0.00mi | 3/2.5 | 1,504 (0%) | 1mo | $199,000 | $132 | 97 |
| 7712 Blackford Dr | 0.15mi | 3/2.5 | 1,433 (-5%) | 11mo | $240,000 | $167 | 74 |
| 113 Laurel Rd | 0.26mi | 3/2.0 | 1,458 (-3%) | 12mo | $365,000 | $250 | 73 |
| 7798 Clarion Dr | 0.30mi | 3/2.0 | 1,600 (+6%) | 8mo | $410,000 | $256 | 69 |
| 206 Hazelwood Dr | 0.18mi | 3/1.5 | 1,388 (-8%) | 10mo | $285,000 | $205 | 68 |
| 812 Bell Rd | 0.41mi | 3/2.0 | 1,552 (+3%) | 12mo | $399,900 | $258 | 65 |
| 499 Bell Rd | 0.40mi | 3/1.5 | 1,428 (-5%) | 10mo | $395,000 | $277 | 62 |
| 109 Hazelwood Dr | 0.17mi | 4/2.0 (+1) | 1,380 (-8%) | 13mo | $355,000 | $257 | 62 |
| 109 Mapleridge Rd | 0.27mi | 3/2.0 | 1,724 (+15%) | 2mo | $482,000 | $280 | 62 |
| 385 Bell St | 0.59mi | 3/2.0 | 1,478 (-2%) | 12mo | $376,000 | $254 | 60 |
| 808 Bell Rd | 0.42mi | 3/2.0 | 1,728 (+15%) | 7mo | $349,000 | $202 | 50 |
| 29 Woodside Rd | 0.57mi | 3/2.0 | 1,361 (-10%) | 22mo | $350,000 | $257 | 39 |
Match score weights: distance 35% · size 25% · config 20% · recency 20%. Top-matched comps best support the ARV.
Projected returns pro-forma
-3.0% appreciation · 3.0% rent growth · sell at horizon
- IRR
- -9.0%
- Equity multiple
- 0.67×
- Total profit
- $-22,617
- Equity at exit
- $36,530
- IRR
- 0.6%
- Equity multiple
- 1.04×
- Total profit
- $2,692
- Equity at exit
- $21,183
Cash invested: $68,600 (down + closing). Projections, not guarantees.
Landlord ↔ Tenant lean methodology
- Overall (STATE)
- 73 Landlord-Friendly
- State Ohio
- 73 Landlord-Friendly · R+6
- County
- — inherits STATE
- City
- — inherits STATE
ZIP-level market 44022
- Active inventory
- 125
- Price-to-rent
- 7.6×
Monthly cashflow live
- Estimated rent
- $2,685 medium interval (Pro) →
- Mortgage (P&I)
- −$1,285
- Tax from tax record
- −$468 /mo · $5,619/yr
- Insurance
- −$102
- HOA
- −$0
- Vacancy / Maint / Mgmt
- −$564
- Net cashflow
- $266
Break-even live
UW: 25.0% down · 7.5% · 30yr · 1.5% tax · 5.0% vac · 8.0% maint · 8.0% mgmt
Financing live
Cash to close
- Down payment
- $61,250
- Closing costs
- $7,350
- Reserves months
- —
- Total cash needed
- —
Loan-product check · same deal, 3 products live
Conventional
25% down · 7.5% · 30yr
- Down + closing
- —
- Monthly P&I
- —
- Monthly cashflow
- —
- DSCR
- —
- Eligible?
- —
Personal DTI + credit; lowest rate.
DSCR
20% down · 8.5% · 30yr
- Down + closing
- —
- Monthly P&I
- —
- Monthly cashflow
- —
- DSCR
- —
- Eligible?
- —
No personal income docs; deal must DSCR.
Hard money
10% down · 12.0% · 12mo
- Down + closing
- —
- Monthly P&I
- —
- Monthly cashflow
- —
- DSCR
- —
- Eligible?
- —
Short-term bridge; refi at stabilization.
Rent comps 1 comps
| Address | Beds | Baths | Sqft | Rent | $/sqft | DOM | Units | Dist |
|---|---|---|---|---|---|---|---|---|
| 15 South St Chagrin Falls, OH | 3.0 | 1.0 | 1056 | $2,685 | $2.54 | 2d | 1 | 1.44mi |
Listing history 3 events
-
2026-05-11historical Contingent 1153-char remark
-
2026-05-04$245,000 Active 1153-char remark
-
1985-12-09soldstatus $79,000
ⓘ Source: listings_history table (triggers on properties + properties_extension) + one-shot
backfill from property_details.listing_events for pre-trigger history.
Tax reassessment forecast OH · Partial reset (capped growth)
- Current annual tax
- $5,619 · $468/mo
- Projected year-2 tax
- $5,619 · $468/mo
- Expected delta
- $0/yr ($0/mo · 0.0%)
ⓘ Screening estimate from a state-policy table — verify with the county assessor before closing.
Climate risk First Street
- Flood 1/10 Low FEMA zone X (unshaded) · 0% chance over 30 yrs
- Wildfire 1/10 Low
- Heat 2/10 Low 7 d/yr ≥94°F today · 17 d/yr by 30 yrs out
- Wind 1/10 Low
- Air quality 3/10 Moderate 2 unhealthy d/yr today · 4 by 30 yrs out
Nearby sold comps map
Loading sold comps map…
Walkable amenities ~0.75 mi
Loading nearby amenities…
Taxation est. · year 1
- Rental income
- $32,220
- − Mortgage interest
- −$13,724
- − Property taxes
- −$5,619
- − Insurance
- −$1,225
- − Repairs & maintenance
- −$2,578
- − Management
- −$2,578
- − Depreciation
- −$7,127
- Taxable loss
- −$630
- Est. tax savings @ 24.0%
- +$151
- After-tax cash flow
- $3,344/yr
For passive investors: Depreciation is non-cash, so a rental often shows a tax loss while cash-flowing — sheltering income. Rental losses are passive: they offset passive income freely, and up to $25,000/yr can offset ordinary (W-2) income if you actively participate and your MAGI is under $100k (phasing out to $0 by $150k); unused losses carry forward. On sale, claimed depreciation is recaptured at up to 25%, and gains may owe capital-gains tax (a 1031 exchange can defer both). Figures are a year-1 estimate at your 24.0% rate — not tax advice; consult a CPA.
Schools (NCES district)
- District
- Chagrin Falls Exempted Village
- NCES district ID
- 3904528
- Math proficiency
- 87% ▼ -5.00%
- Reading proficiency
- 90% ▼ -3.00%
- Median HH income
- $89,907
- Composite
- 78.52/100
- National rank
- #77
- State rank
- #6 of 656 in OH
Livability — South Russell
- Score
- 65/100
- State rank
- #731
- US rank
- #13222
Category grades
Schools grade is shown separately in the Schools card above.
Census & demographics
- County
- Cuyahoga · 1,045,444 people
- Metro
- Cleveland, OH
- Population (ZIP)
- 16,559
- Household income
- $152,213
- Rent vs Own
- Severe rent burden
- 13.7
Population outlook (Geauga County) Hauer SSP2
- Today (2025)
- 94,919 people
- By 2030
- 94,804 · -0.1%
- By 2040
- 92,641 · -2.4%
- By 2050
- 88,198 · -7.1%
- By 2075
- 79,080 · -16.7%
- By 2100
- 60,856 · -35.9%
Race, ethnicity, and origin ACS 2023
- Neighborhood character
- Predominantly White (89%)
- Race & ethnicity
- White 89% Black 4% Two or more races 3% Hispanic / Latino 3% Asian 2%
- Common ancestry
- Romanian 6% Scotch-Irish 4% Italian 3%
- Foreign-born
- 8% · Canada, China
- Languages at home
- 92% English-only · Russian/Polish/Slavic 2% Spanish 2% Other Indo-European 1%
Political lean MEDSL · Geauga
- 2024 margin
- Strong R (+24.1) · D 37.5% · R 61.7%
- 2008→2024 swing
- -8.8pp toward R · 2008: -15.4pp · 2024: -24.1pp
- All cycles
- 2024: R+24.1 2020: R+23.1 2016: R+25.5 2012: R+21.6 2008: R+15.4
Not yet ingested
- Civics
- —
Market trends
- HPI YoY
- ▼ -336.08%
- Current HPI
- 205.3055
- Rent YoY
- —
- Metro
- —
- State GDP YoY
- ▲ 1.98%
- F500 in state
- 48
Industry mix (Fortune 500 HQ in OH)
| Industry | F500 HQs | Revenue |
|---|---|---|
| Insurance | 3 | $145B |
|
||
| Industrial Machinery | 3 | $49B |
|
||
| Financial Services | 3 | $24B |
|
||
| Consumer Goods | 2 | $93B |
|
||
| Aerospace / Defense | 2 | $47B |
|
||
| Utilities | 2 | $33B |
|
||
Price history
+907.6% since first listed6 events — show timeline
- 2026-05-26 Pending — MLSNOW
- 2026-05-26 Sold (Public Records) $796,000 Public Records
- 2026-05-26 Sold (MLS) $199,000 MLSNOW
- 2026-05-11 Contingent — MLSNOW
- 2026-05-04 Listed $245,000 MLSNOW
- 1985-12-09 Sold (Public Records) $79,000 Public Records
Property tax history
-0.8%/yrLatest (2025): $5,619 · +3.3% YoY. Source: county tax records.
Cash-flow waterfall
monthlySold comps — $/sqft
last 12 mo · ≤1 miLoading sold comps…