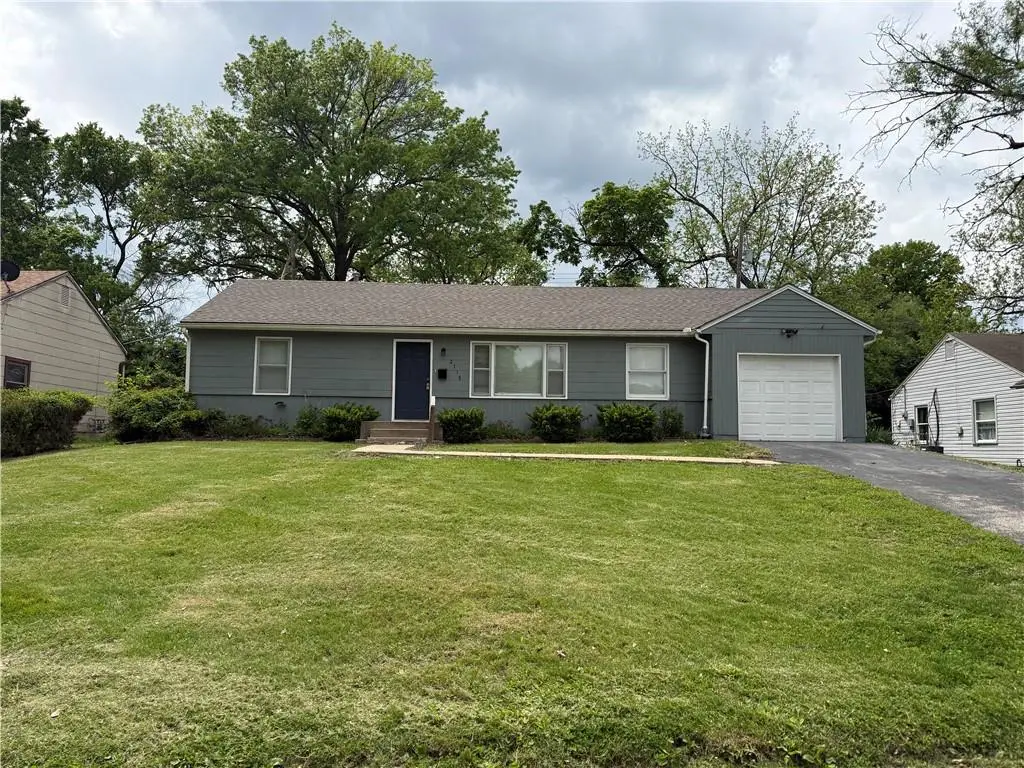
2718 S Brookside Ave · Independence, MO
Flood risk 1/10 · Minimal
- FEMA flood zone
- X (unshaded)
- Chance of flooding over 30 yrs
- 0.0%
- Est. flood insurance / yr
- $507 – $1,088
Fire risk 1/10 · Minimal
- Est. fire insurance / yr
- $1,054 – $1,958
Heat risk 4/10 · Minor
- Hot days now (above 106°F)
- 7 days/yr
- Hot days in 30 yrs
- 17 days/yr
Wind risk 2/10 · Minimal
- Chance of severe wind over 30 yrs
- —
Air-quality risk 3/10 · Minor
- Unhealthy air days now
- 2 days/yr
- Unhealthy air days in 30 yrs
- 3 days/yr
Risk factors via First Street. Map © Google.
Why this score? — see what drove the C- grade
The composite is a weighted blend of 9 inputs, each scored 0–100. Each bar is that input's sub-score; the figure is the points it added to the 100-point composite (weight × sub-score).
- Cash flow +17.6/30.0
- ARV discount +13.7/15.0
- DSCR +5.5/10.0
- Livability +4.1/5.0
- 1% rule +3.9/10.0
- Rent growth +3.9/5.0
- Schools +2.7/10.0
- Condition / age +2.5/5.0
- Appreciation +0.0/10.0
$155,000
🖨 Deal sheet 📄 Offer letter ✓ Due diligence
Listing remarks
Great three bedroom and one bathroom house with spacious living areas in an ideal location. The open kitchen is well equipped with stainless steel appliances. Wood floors are throughout the home and each bedroom offers ample closet space. There is a one car garage and large backyard that is fully fenced, complete with a covered patio perfect for outdoor gatherings or simply relaxing. Conveniently located near shopping, dining, and schools, this home combines modern updates with everyday practicality.
Key facts
- Fully fenced
- Wood floors
- Ample closet space
Tags
Property features AI
Finance
- Other: Not in a flood plain
- HOA & community: No association fees
Exterior
- Parking: Attached garage facing front (1 car)
- Utilities: Public water; Public sewer
- Home design: Single-family residence; Ranch floor plan; Attached property
- Construction: Frame construction; Composition roof
- Exterior features: Covered patio; Metal fencing; Paved road access; City lot within city limits
Interior
- Kitchen: Dishwasher; Refrigerator; Electric range
- Bedrooms: 3 bedrooms on the main level
- Flooring: Wood flooring
- Bathrooms: 1 full bathroom
- Heating & cooling: Natural gas heat; Electric cooling
- Interior features: Living/dining combo; Dishwasher; Refrigerator; Electric range
- Laundry & utility: Laundry on the main level
Neighborhood map
What this means for you Summary
Snapshot
- This is a 3-bed/1.0-bath single-family listed at $155k.
Deal economics
- At list price, monthly cash flow is $123 ($1k/yr) — positive.
- The deal already cash-flows at list — no discount required.
- To meet the 1% rule (rent ≥ 1% of price), the offer needs to be $138k (11.2% below list).
- Recommended offer: $138k (11.2% below list) — sets the bar for 1% rule.
- Cap rate 7.2% vs local median 5.0% in Independence — top-decile yield for the area; either an underpriced asset or a hidden risk that comps aren't pricing in. Stress-test before assuming the spread holds.
Location & tenants
- Location reads 82/100 on livability (#10 in MO, #1,296 nationally) — a professional / high-income tenant draw. Strengths: amenities A+, commute A+, cost of living A+; Watch: employment D+, crime F.
- Independence 30 (suburban): math 26% / reading 38% proficiency, ranked #252 of 324 in MO (top 78%) — families likely to look elsewhere, expect single-tenant / working-renter base with shorter leases.
- Zoned schools: Cassell Park Elementary (math 27% / reading 37%, grade F, #761 of 1,115 statewide, top 72%, 375 students, 80% FRL); Van Horn High (math 13% / reading 27%, grade F, #472 of 521 statewide, top 91%, 1,047 students, 72% FRL) — zoned schools average 76% FRL vs 58% district-wide (18 pts higher); higher-poverty schools than district average — tighter screening recommended.
- Market conditions: Rents rising fast (+5.4%/yr); 127 active listings in the ZIP; 22 comparable units currently listed for rent nearby; rentals at typical pace (median 21d on market — plan ~3-4 weeks tenant-placement turnaround); 4,002 units permitted in Jackson County in 2024 (2,271 in 5+ unit buildings).
Forward outlook
- Local home prices are declining (-3.0%/yr); year-one equity from $1k of loan paydown is wiped out by about $5k of value loss. Plan a longer hold.
- Jackson County population projected at +4% by 2050 — modest demand growth; plan on rents tracking national, not racing it.
Negotiation context
- Only 4 days on market — expect competitive offers; lowballing is unlikely to land.
Risks & watch-outs
- Watch-outs: built in 1955 — expect roof / HVAC / electrical / plumbing capex.
Questions for the listing agent
- Built in 1955 — when were the roof, HVAC, electrical panel, plumbing, and water heater last replaced?
- Is there a deadline driving the sale (1031 exchange, divorce, estate, relocation)? That informs how much negotiation room exists.
- Crime grade is F in this area — have there been break-ins, vandalism, or insurance claims at this property in the last 3 years? What carrier currently insures it and at what premium?
- What's the average days-on-market for RENTAL listings here right now (not sales)? A rising rental-DOM trend means longer vacancies and softer asking-rent achievability than the comps imply.
- What's the recent tenant-quality profile in this submarket — average credit score on applications, eviction rate, late-payment / NSF rate, and stable-employment percentage? A property-management company in the area should have these aggregated.
- How much new for-sale + rental construction is in the pipeline within 1–3 miles? Heavy new supply typically softens prices + rents 12–24 months out; constrained supply supports both.
Investment metrics
- 1% rule
- 0.89% ✗
- Cap rate
- 7.25%
- Cash-on-cash
- 3.40%
- DSCR
- 1.15
- GRM
- 9.4
CMA / ARV
- ARV (median comp)
- $179,692
- List price
- $155,000
- Delta
- -13.74%
- Verdict
- UNDERPRICED
- Comps
- 20 within 1.0 mi
Show comp detail 12 sales within ~0.75 mi
| Address | Dist | Beds/Ba | Sqft | Sold | Price | $/sf | Match |
|---|---|---|---|---|---|---|---|
| 2718 S Brookside Ave | 0.00mi | 3/1.0 | 1,032 (0%) | 0mo | $155,000 | $150 | 100 |
| 9733 E 27 St | 0.34mi | 3/1.5 | 984 (-5%) | 7mo | $175,000 | $178 | 69 |
| 2515 S Arlington Ave | 0.43mi | 3/1.0 | 973 (-6%) | 3mo | $182,500 | $188 | 68 |
| 2511 S Evanston Ave | 0.50mi | 2/1.5 (-1) | 1,044 (+1%) | 3mo | $159,000 | $152 | 65 |
| 2322 S Glenwood Ave | 0.56mi | 2/1.0 (-1) | 1,048 (+2%) | 3mo | $155,000 | $148 | 64 |
| 2247 Blue Ridge Blvd | 0.65mi | 3/1.0 | 1,004 (-3%) | 5mo | $165,000 | $164 | 61 |
| 2305 S Crescent Ave | 0.61mi | 2/1.0 (-1) | 1,066 (+3%) | 1mo | $170,000 | $159 | 60 |
| 2435 S Glenwood Ave | 0.33mi | 2/2.0 (-1) | 900 (-13%) | 2mo | $145,000 | $161 | 53 |
| 2310 S Hall Rd | 0.75mi | 2/1.0 (-1) | 990 (-4%) | 1mo | $145,000 | $146 | 52 |
| 9801 E 33rd St S | 0.74mi | 3/1.5 | 1,120 (+8%) | 1mo | $190,000 | $170 | 48 |
| 10001 E 31st St S | 0.66mi | 3/1.0 | 1,164 (+13%) | 2mo | $200,000 | $172 | 47 |
| 2319 S Hawthorne Ave | 0.71mi | 3/2.0 | 918 (-11%) | 2mo | $150,000 | $163 | 43 |
Match score weights: distance 35% · size 25% · config 20% · recency 20%. Top-matched comps best support the ARV.
Projected returns pro-forma
-3.0% appreciation · 5.43% rent growth · sell at horizon
- IRR
- -8.5%
- Equity multiple
- 0.68×
- Total profit
- $-13,874
- Equity at exit
- $23,111
- IRR
- 3.7%
- Equity multiple
- 1.29×
- Total profit
- $12,703
- Equity at exit
- $13,402
Cash invested: $43,400 (down + closing). Projections, not guarantees.
Landlord ↔ Tenant lean methodology
- Overall (STATE)
- 81 Strongly Landlord-Friendly
- State Missouri
- 81 Strongly Landlord-Friendly · R+10
- County
- — inherits STATE
- City
- — inherits STATE
ZIP-level market 64052
- Home prices YoY
- -34.6%
- Rents YoY
- 5.4%
- Active inventory
- 127
- Price-to-rent
- 9.4×
Monthly cashflow live
- Estimated rent
- $1,377 high interval (Pro) →
- Mortgage (P&I)
- −$813
- Tax from tax record
- −$87 /mo · $1,048/yr
- Insurance
- −$65
- HOA
- −$0
- Vacancy / Maint / Mgmt
- −$289
- Net cashflow
- $123
Break-even live
UW: 25.0% down · 7.5% · 30yr · 1.5% tax · 5.0% vac · 8.0% maint · 8.0% mgmt
Financing live
Cash to close
- Down payment
- $38,750
- Closing costs
- $4,650
- Reserves months
- —
- Total cash needed
- —
Loan-product check · same deal, 3 products live
Conventional
25% down · 7.5% · 30yr
- Down + closing
- —
- Monthly P&I
- —
- Monthly cashflow
- —
- DSCR
- —
- Eligible?
- —
Personal DTI + credit; lowest rate.
DSCR
20% down · 8.5% · 30yr
- Down + closing
- —
- Monthly P&I
- —
- Monthly cashflow
- —
- DSCR
- —
- Eligible?
- —
No personal income docs; deal must DSCR.
Hard money
10% down · 12.0% · 12mo
- Down + closing
- —
- Monthly P&I
- —
- Monthly cashflow
- —
- DSCR
- —
- Eligible?
- —
Short-term bridge; refi at stabilization.
Rent comps 22 comps
| Address | Beds | Baths | Sqft | Rent | $/sqft | DOM | Units | Dist |
|---|---|---|---|---|---|---|---|---|
| 2702 S Glenwood Ave Independence, MO | 3.0 | 1.0 | 1056 | $1,555 | $1.47 | 23d | 1 | 0.13mi |
| 9613 E 25th Ter S Independence, MO | 3.0 | 1.0 | 1214 | $1,545 | $1.27 | 23d | 1 | 0.39mi |
| 2503 S Crescent Ave Independence, MO | 2.0 | 2.0 | 864 | $1,295 | $1.50 | 16d | 1 | 0.49mi |
| 8661 E 26th St Kansas City, MO | 2.0 | 1.0 | 1145 | $1,295 | $1.13 | 43d | 1 | 0.69mi |
| 3333 S Oxford Ave Independence, MO | 2.0 | 1.0 | 700 | $850 | $1.21 | 43d | 1 | 0.73mi |
| 2222 S Overton Ave Independence, MO | 2.0 | 1.0 | 800 | $1,025 | $1.28 | 21d | 1 | 0.76mi |
| 3213 S Ash Ave Independence, MO | 2.0 | 1.0 | 879 | $1,195 | $1.36 | 7d | 1 | 0.90mi |
| 10604 E 26th St S Independence, MO | 3.0 | 1.0 | 1068 | $1,610 | $1.51 | 7d | 1 | 0.95mi |
| 9715 E 35th Ter S Unit A-5 Independence, MO | 2.0 | 1.0 | 750 | $1,095 | $1.46 | 14d | 1 | 1.03mi |
| 9715 E 35th Ter S Apt A8 Independence, MO | 2.0 | 1.0 | 750 | $999 | $1.33 | 4d | 1 | 1.03mi |
| 9715 E 35th Ter S Unit B-10 Independence, MO | 2.0 | 1.0 | 750 | $1,095 | $1.46 | 43d | 1 | 1.03mi |
| 9715 E 35th Ter S Unit B-9 Independence, MO | 2.0 | 1.0 | 750 | $999 | $1.33 | 21d | 1 | 1.03mi |
| 10323 E 20th St S Independence, MO | 3.0 | 1.0 | 936 | $1,400 | $1.50 | 43d | 1 | 1.11mi |
| 3013 Mason Ave Independence, MO | 4.0 | 2.0 | 1166 | $1,900 | $1.63 | 7d | 1 | 1.13mi |
| 2920 S Harvard Ave Unit A Independence, MO | 4.0 | 2.5 | 1200 | $1,650 | $1.38 | 43d | 1 | 1.22mi |
| 1704 S Brookside Ave Independence, MO | 4.0 | 1.0 | 834 | $1,450 | $1.74 | 14d | 1 | 1.23mi |
| 2912 Englewood Ter Independence, MO | 3.0 | 2.0 | 792 | $1,399 | $1.77 | 16d | 1 | 1.33mi |
| 1712 S Ash Ave Unit 1714-3 Independence, MO | 2.0 | 1.0 | 700 | $895 | $1.28 | 23d | 1 | 1.35mi |
| 1712 S Ash Ave Independence, MO | 2.0 | 1.0 | 800 | $945 | $1.18 | 43d | 1 | 1.35mi |
| 10714 E 19th St S Independence, MO | 2.0 | 1.0 | 1010 | $895 | $0.89 | 2d | 1 | 1.39mi |
| 10817 E 19th Ter S Independence, MO | 3.0 | 1.0 | 1428 | $1,801 | $1.26 | 16d | 1 | 1.40mi |
| 2256 S Sterling Ave Independence, MO | 3.0 | 1.5 | 1284 | $1,399 | $1.09 | 16d | 1 | 1.41mi |
Listing history 5 events
-
2026-05-09status Pending 505-char remark
-
2026-05-05$155,000 Active 505-char remark
-
2021-01-04soldstatus
-
2020-08-25soldstatus
-
2014-07-30soldstatus
ⓘ Source: listings_history table (triggers on properties + properties_extension) + one-shot
backfill from property_details.listing_events for pre-trigger history.
Tax reassessment forecast MO · Resets to sale price
- Current annual tax
- $1,048 · $87/mo
- Projected year-2 tax
- $1,504 · $125/mo
- Expected delta
- +$456/yr (+$38/mo · 43.5%)
ⓘ Screening estimate from a state-policy table — verify with the county assessor before closing.
Climate risk First Street
- Flood 1/10 Low FEMA zone X (unshaded) · 0% chance over 30 yrs
- Wildfire 1/10 Low
- Heat 4/10 Moderate 7 d/yr ≥106°F today · 17 d/yr by 30 yrs out
- Wind 2/10 Low
- Air quality 3/10 Moderate 2 unhealthy d/yr today · 3 by 30 yrs out
Nearby sold comps map
Loading sold comps map…
Walkable amenities ~0.75 mi
Loading nearby amenities…
Taxation est. · year 1
- Rental income
- $16,523
- − Mortgage interest
- −$8,682
- − Property taxes
- −$1,048
- − Insurance
- −$775
- − Repairs & maintenance
- −$1,322
- − Management
- −$1,322
- − Depreciation
- −$4,509
- Taxable loss
- −$1,134
- Est. tax savings @ 24.0%
- +$272
- After-tax cash flow
- $1,749/yr
For passive investors: Depreciation is non-cash, so a rental often shows a tax loss while cash-flowing — sheltering income. Rental losses are passive: they offset passive income freely, and up to $25,000/yr can offset ordinary (W-2) income if you actively participate and your MAGI is under $100k (phasing out to $0 by $150k); unused losses carry forward. On sale, claimed depreciation is recaptured at up to 25%, and gains may owe capital-gains tax (a 1031 exchange can defer both). Figures are a year-1 estimate at your 24.0% rate — not tax advice; consult a CPA.
Schools (NCES district)
- District
- Independence 30
- NCES district ID
- 2915480
- Math proficiency
- 26% ▼ -8.00%
- Reading proficiency
- 38% ▼ -5.00%
- Median HH income
- $41,843
- Composite
- 27.04/100
- National rank
- #7054
- State rank
- #252 of 324 in MO
Livability — Independence
- Score
- 82/100
- State rank
- #10
- US rank
- #1296
Category grades
Schools grade is shown separately in the Schools card above.
Census & demographics
- Census place
- Independence, MO
- County
- Jackson County · 687,798 people
- City population
- 117,675
- Metro
- Kansas City, MO-KS
- Population (ZIP)
- 22,138
- Household income
- $59,007
- Rent vs Own
- Severe rent burden
- 965.0
Population outlook (Jackson County) Hauer SSP2
- Today (2025)
- 719,589 people
- By 2030
- 731,456 · +1.6%
- By 2040
- 746,689 · +3.8%
- By 2050
- 749,289 · +4.1%
- By 2075
- 736,227 · +2.3%
- By 2100
- 668,210 · -7.1%
Race, ethnicity, and origin ACS 2023
- Neighborhood character
- Diverse neighborhood (Simpson 0.56)
- Race & ethnicity
- White 62% Hispanic / Latino 23% Two or more races 15% Black 7% Asian 2%
- Hispanic origin (detail)
- Mexican 15%
- Common ancestry
- Italian 12% Slovak 2% Lithuanian 2%
- Foreign-born
- 11% · Canada, China
- Languages at home
- 85% English-only · Spanish 13% Other Asian/Pacific 1%
Political lean MEDSL · Jackson
- 2024 margin
- D (+19.3) · D 58.9% · R 39.5% · Other 1.6%
- 2008→2024 swing
- -6.1pp toward R · 2008: 25.4pp · 2024: 19.3pp
- All cycles
- 2024: D+19.3 2020: D+22.0 2016: D+16.6 2012: D+19.0 2008: D+25.4
Not yet ingested
- Civics
- —
Market trends
- HPI YoY
- ▼ -160.06%
- Current HPI
- 302.1124
- Rent YoY
- ▲ 5.43%
- Metro
- Kansas City, MO-KS
- State GDP YoY
- ▲ 1.84%
- F500 in state
- 20
Industry mix (Fortune 500 HQ in MO)
| Industry | F500 HQs | Revenue |
|---|---|---|
| Healthcare | 1 | $163B |
|
||
| Insurance | 1 | $21B |
|
||
| Industrial Technology | 1 | $17B |
|
||
| Retail | 1 | $16B |
|
||
| Industrial Distribution | 1 | $10B |
|
||
| Utilities | 1 | $9B |
|
||
Price history
6 events — show timeline
- 2026-06-11 Sold (MLS) — Heartland MLS as Distributed by MLS Grid
- 2026-05-09 Pending — Heartland MLS as Distributed by MLS Grid
- 2026-05-05 Listed $155,000 Heartland MLS as Distributed by MLS Grid
- 2021-01-04 Sold (Public Records) — Public Records
- 2020-08-25 Sold (Public Records) — Public Records
- 2014-07-30 Sold (Public Records) — Public Records
Property tax history
+5.0%/yrLatest (2025): $1,048 · -41.3% YoY. Source: county tax records.
Cash-flow waterfall
monthlySold comps — $/sqft
last 12 mo · ≤1 miLoading sold comps…