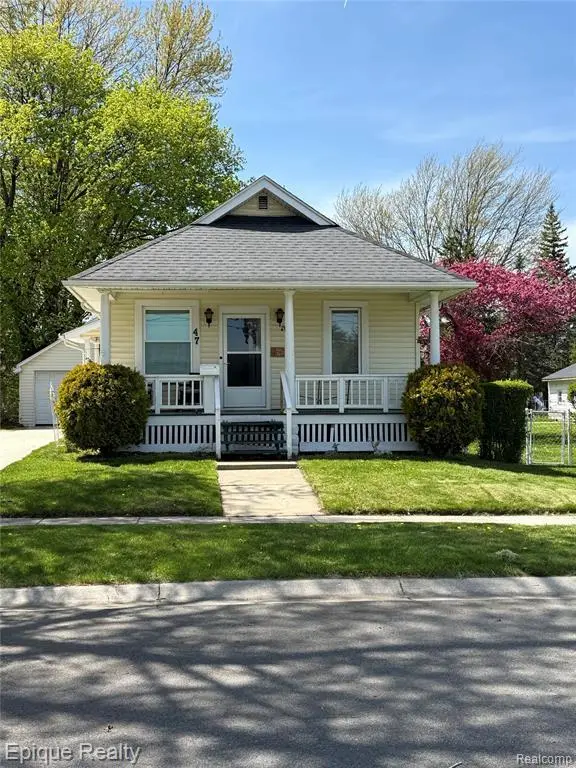
47 14th St · Port Huron, MI
Flood risk 1/10 · Minimal
- FEMA flood zone
- X (unshaded)
- Chance of flooding over 30 yrs
- 0.0%
- Est. flood insurance / yr
- $473 – $860
Fire risk 1/10 · Minimal
- Est. fire insurance / yr
- $784 – $1,456
Heat risk 2/10 · Minimal
- Hot days now (above 98°F)
- 7 days/yr
- Hot days in 30 yrs
- 14 days/yr
Wind risk 1/10 · Minimal
- Chance of severe wind over 30 yrs
- —
Air-quality risk 2/10 · Minimal
- Unhealthy air days now
- 1 days/yr
- Unhealthy air days in 30 yrs
- 2 days/yr
Risk factors via First Street. Map © Google.
Why this score? — see what drove the B- grade
The composite is a weighted blend of 9 inputs, each scored 0–100. Each bar is that input's sub-score; the figure is the points it added to the 100-point composite (weight × sub-score).
- Cash flow +26.8/30.0
- ARV discount +11.7/15.0
- DSCR +9.2/10.0
- 1% rule +6.7/10.0
- Rent growth +3.4/5.0
- Livability +3.2/5.0
- Schools +2.5/10.0
- Condition / age +2.5/5.0
- Appreciation +0.0/10.0
$99,900
🖨 Deal sheet 📄 Offer letter ✓ Due diligence
Listing remarks MLS
Cute 2-bedroom starter home in Port Huron, Perfect starter home for a first-time homebuyer!
Key facts
- 7,405 sq ft lot
- Garage
- Built 1933
Neighborhood map
What this means for you Summary
Snapshot
- This is a 2-bed/1.0-bath single-family listed at $100k.
Deal economics
- At list price, monthly cash flow is $274 ($3k/yr) — positive.
- The deal already cash-flows at list — no discount required.
- Meets the 1% rule at list price ($1k rent vs $100k).
- Cap rate 9.6% vs local median 4.6% in Port Huron — top-decile yield for the area; either an underpriced asset or a hidden risk that comps aren't pricing in. Stress-test before assuming the spread holds.
Location & tenants
- Location reads 65/100 on livability (#445 in MI) — a middle-class / working-renter tenant base. Strengths: cost of living A+, housing A+; Watch: amenities C-, health & safety D, schools F.
- Port Huron Area School District (suburban): math 23% / reading 37% proficiency, ranked #368 of 540 in MI (top 68%) — families likely to look elsewhere, expect single-tenant / working-renter base with shorter leases.
- Market conditions: Rents rising (+3.6%/yr); 220 active listings in the ZIP; 12 comparable units currently listed for rent nearby; rentals lingering (median 44d on market — plan ~5-8 weeks vacancy on turnover, expect pricing pressure); 50% of comp listings sitting > 30 days — soft ceiling on asking rent; 232 units permitted in St. Clair County in 2024 (0 in 5+ unit buildings).
Forward outlook
- Local home prices are declining (-3.0%/yr); year-one equity from $691 of loan paydown is wiped out by about $3k of value loss. Plan a longer hold.
- St. Clair County population projected at -20% by 2050 — secular population decline; favor cash flow + early exit over multi-decade hold.
- At projected returns (-3.0% appreciation + 3.6% rent growth), your $28k cash investment doubles in ~9 years — after that, you're playing with house money.
Negotiation context
- Only 0 days on market — expect competitive offers; lowballing is unlikely to land.
- 7 sale attempts since 28y ago with the ask held roughly flat each time — persistent listings suggest the price (not the market) is what's stuck; bring a comps-based counter.
- Current owner paid $14k; list at $100k implies a 596% gain — meaningful room to come down on a strong offer.
Risks & watch-outs
- Watch-outs: built in 1933 — expect roof / HVAC / electrical / plumbing capex.
Questions for the listing agent
- Built in 1933 — when were the roof, HVAC, electrical panel, plumbing, and water heater last replaced?
- Is there a deadline driving the sale (1031 exchange, divorce, estate, relocation)? That informs how much negotiation room exists.
- Schools are F-rated, which usually means shorter tenancies and higher turnover. Who's the typical renter profile here, and what's been the actual vacancy rate?
- Crime grade is F in this area — have there been break-ins, vandalism, or insurance claims at this property in the last 3 years? What carrier currently insures it and at what premium?
- What's the average days-on-market for RENTAL listings here right now (not sales)? A rising rental-DOM trend means longer vacancies and softer asking-rent achievability than the comps imply.
- What's the recent tenant-quality profile in this submarket — average credit score on applications, eviction rate, late-payment / NSF rate, and stable-employment percentage? A property-management company in the area should have these aggregated.
- How much new for-sale + rental construction is in the pipeline within 1–3 miles? Heavy new supply typically softens prices + rents 12–24 months out; constrained supply supports both.
Investment metrics
- 1% rule
- 1.17% ✓
- Cap rate
- 9.59%
- Cash-on-cash
- 11.77%
- DSCR
- 1.52
- GRM
- 7.1
CMA / ARV
- ARV (on-the-fly)
- $110,088
- Comps found
- 12
Show comp detail 12 sales within ~0.75 mi
| Address | Dist | Beds/Ba | Sqft | Sold | Price | $/sf | Match |
|---|---|---|---|---|---|---|---|
| 47 14th St | 0.00mi | 2/1.0 | 792 (0%) | 0mo | $105,000 | $133 | 100 |
| 1404 Water St | 0.03mi | 2/1.0 | 828 (+4%) | 2mo | $115,000 | $139 | 89 |
| 1321 Nelson St | 0.07mi | 2/1.0 | 748 (-6%) | 4mo | $110,000 | $147 | 85 |
| 103 14th St St | 0.06mi | 2/1.0 | 836 (+6%) | 4mo | $105,000 | $126 | 84 |
| 1631 Wells St | 0.35mi | 2/1.0 | 832 (+5%) | 3mo | $108,180 | $130 | 73 |
| 1517 Gordon St | 0.18mi | 2/1.0 | 906 (+14%) | 2mo | $135,000 | $149 | 66 |
| 1209 10th Ave | 0.42mi | 2/1.0 | 860 (+9%) | 1mo | $109,000 | $127 | 65 |
| 922 16th St | 0.67mi | 2/1.0 | 822 (+4%) | 0mo | $159,000 | $193 | 62 |
| 1109 Wells St | 0.38mi | 2/1.0 | 880 (+11%) | 4mo | $88,500 | $101 | 61 |
| 1509 Lincoln Ave | 0.29mi | 3/1.0 (+1) | 900 (+14%) | 2mo | $125,000 | $139 | 57 |
| 1103 Miller St | 0.42mi | 2/1.0 | 693 (-12%) | 3mo | $87,500 | $126 | 57 |
| 1635 Wells St | 0.36mi | 3/1.0 (+1) | 900 (+14%) | 3mo | $130,000 | $144 | 53 |
Match score weights: distance 35% · size 25% · config 20% · recency 20%. Top-matched comps best support the ARV.
Projected returns pro-forma
-3.0% appreciation · 3.61% rent growth · sell at horizon
- IRR
- 1.9%
- Equity multiple
- 1.07×
- Total profit
- $2,002
- Equity at exit
- $14,895
- IRR
- 12.0%
- Equity multiple
- 1.97×
- Total profit
- $27,206
- Equity at exit
- $8,638
Cash invested: $27,972 (down + closing). Projections, not guarantees.
Landlord ↔ Tenant lean methodology
- Overall (STATE)
- 62 Landlord-Friendly
- State Michigan
- 62 Landlord-Friendly · EVEN
- County
- — inherits STATE
- City
- — inherits STATE
ZIP-level market 48060
- Rents YoY
- 3.6%
- Active inventory
- 220
- Price-to-rent
- 7.1×
Monthly cashflow live
- Estimated rent
- $1,166 high interval (Pro) →
- Mortgage (P&I)
- −$524
- Tax from tax record
- −$82 /mo · $979/yr
- Insurance
- −$42
- HOA
- −$0
- Vacancy / Maint / Mgmt
- −$245
- Net cashflow
- $274
Break-even live
UW: 25.0% down · 7.5% · 30yr · 1.5% tax · 5.0% vac · 8.0% maint · 8.0% mgmt
Financing live
Cash to close
- Down payment
- $24,975
- Closing costs
- $2,997
- Reserves months
- —
- Total cash needed
- —
Loan-product check · same deal, 3 products live
Conventional
25% down · 7.5% · 30yr
- Down + closing
- —
- Monthly P&I
- —
- Monthly cashflow
- —
- DSCR
- —
- Eligible?
- —
Personal DTI + credit; lowest rate.
DSCR
20% down · 8.5% · 30yr
- Down + closing
- —
- Monthly P&I
- —
- Monthly cashflow
- —
- DSCR
- —
- Eligible?
- —
No personal income docs; deal must DSCR.
Hard money
10% down · 12.0% · 12mo
- Down + closing
- —
- Monthly P&I
- —
- Monthly cashflow
- —
- DSCR
- —
- Eligible?
- —
Short-term bridge; refi at stabilization.
Rent comps 12 comps
| Address | Beds | Baths | Sqft | Rent | $/sqft | DOM | Units | Dist |
|---|---|---|---|---|---|---|---|---|
| 145 Rural St Unit 145 Port Huron, MI | 2.0 | 1.5 | 950 | $1,190 | $1.25 | 24d | 1 | 0.34mi |
| 1820 Kern St Port Huron, MI | 2.0 | 1.0 | 950 | $1,000 | $1.05 | 24d | 1 | 0.37mi |
| 1613 Lapeer Ave Unit 2 Port Huron, MI | 2.0 | 1.0 | 800 | $875 | $1.09 | 44d | 1 | 0.41mi |
| 909 Stone St Unit 1 Port Huron, MI | 3.0 | 1.0 | 1100 | $1,250 | $1.14 | 44d | 1 | 0.51mi |
| 937 Howard St Port Huron, MI | 3.0 | 1.0 | 1080 | $1,500 | $1.39 | 18d | 1 | 0.71mi |
| 619 Taylor St Port Huron, MI | 2.0–3.0 | 1.0–1.5 | 716 | $780 | $1.09 | 2d | 1 | 0.82mi |
| 512 Quay St Port Huron, MI | 1.0 | 1.0 | 1054 | $1,700 | $1.61 | 44d | 1 | 0.94mi |
| 508 Quay St Unit 3 Port Huron, MI | 1.0 | 1.0 | 840 | $2,500 | $2.98 | 44d | 1 | 0.95mi |
| 218 Huron Ave Apt 204 Port Huron, MI | 2.0 | 2.0 | 1086 | $1,700 | $1.57 | 44d | 1 | 0.97mi |
| 208 Huron Ave Unit 202-2B Port Huron, MI | 2.0 | 2.0 | 1096 | $1,600 | $1.46 | 44d | 1 | 0.98mi |
| 415 Griswold St Unit 3 Port Huron, MI | 1.0 | 1.0 | 700 | $875 | $1.25 | 17d | 1 | 1.36mi |
| 2849 15th Ave Port Huron, MI | 1.0–2.0 | 1.0 | 1140 | $1,995 | $1.75 | 2d | 4 | 1.47mi |
Listing history 15 events
-
2026-05-04$99,900
Show marketing remark (91 chars)
Cute 2-bedroom starter home in Port Huron, Perfect starter home for a first-time homebuyer!
-
2026-05-04historical
Show marketing remark (91 chars)
Cute 2-bedroom starter home in Port Huron, Perfect starter home for a first-time homebuyer!
-
2026-05-04historical 91-char remark
Show marketing remark (91 chars)
Cute 2-bedroom starter home in Port Huron, Perfect starter home for a first-time homebuyer!
-
2026-05-04$99,900 91-char remark
Show marketing remark (91 chars)
Cute 2-bedroom starter home in Port Huron, Perfect starter home for a first-time homebuyer!
-
2010-07-06soldstatus $14,350 348-char remark
Show marketing remark (348 chars)
HUD home. Sold 'AS IS' by Elec Bid only. For Prop. conditions, Forms, Discl, & Avail see Website in Agent Remarks * . Insured w Escrow repairs $3190. Bids due by 5-16-10 11:59 PM or daily until sold. MCB makes no warranty as to current or future existence of mold in this property and is not liable for the potentially harmful effects thereof.
-
2010-06-08historical 348-char remark
Show marketing remark (348 chars)
HUD home. Sold 'AS IS' by Elec Bid only. For Prop. conditions, Forms, Discl, & Avail see Website in Agent Remarks * . Insured w Escrow repairs $3190. Bids due by 5-16-10 11:59 PM or daily until sold. MCB makes no warranty as to current or future existence of mold in this property and is not liable for the potentially harmful effects thereof.
-
2010-05-07$20,000 348-char remark
Show marketing remark (348 chars)
HUD home. Sold 'AS IS' by Elec Bid only. For Prop. conditions, Forms, Discl, & Avail see Website in Agent Remarks * . Insured w Escrow repairs $3190. Bids due by 5-16-10 11:59 PM or daily until sold. MCB makes no warranty as to current or future existence of mold in this property and is not liable for the potentially harmful effects thereof.
-
2002-07-12soldstatus $85,000
-
2002-04-29$81,900
-
2001-09-30historical
-
2001-01-09$84,900
-
1999-03-30soldstatus $72,000
-
1998-12-21$69,900
-
1998-04-02soldstatus $37,500
-
1998-03-05$37,500
ⓘ Source: listings_history table (triggers on properties + properties_extension) + one-shot
backfill from property_details.listing_events for pre-trigger history.
Tax reassessment forecast MI · Partial reset (capped growth)
- Current annual tax
- $979 · $82/mo
- Projected year-2 tax
- $1,259 · $105/mo
- Expected delta
- +$280/yr (+$23/mo · 28.6%)
ⓘ Screening estimate from a state-policy table — verify with the county assessor before closing.
Climate risk First Street
- Flood 1/10 Low FEMA zone X (unshaded) · 0% chance over 30 yrs
- Wildfire 1/10 Low
- Heat 2/10 Low 7 d/yr ≥98°F today · 14 d/yr by 30 yrs out
- Wind 1/10 Low
- Air quality 2/10 Low 1 unhealthy d/yr today · 2 by 30 yrs out
Nearby sold comps map
Loading sold comps map…
Walkable amenities ~0.75 mi
Loading nearby amenities…
Taxation est. · year 1
- Rental income
- $13,998
- − Mortgage interest
- −$5,596
- − Property taxes
- −$979
- − Insurance
- −$500
- − Repairs & maintenance
- −$1,120
- − Management
- −$1,120
- − Depreciation
- −$2,906
- Taxable income
- $1,778
- Est. tax owed @ 24.0%
- −$427
- After-tax cash flow
- $2,867/yr
For passive investors: Depreciation is non-cash, so a rental often shows a tax loss while cash-flowing — sheltering income. Rental losses are passive: they offset passive income freely, and up to $25,000/yr can offset ordinary (W-2) income if you actively participate and your MAGI is under $100k (phasing out to $0 by $150k); unused losses carry forward. On sale, claimed depreciation is recaptured at up to 25%, and gains may owe capital-gains tax (a 1031 exchange can defer both). Figures are a year-1 estimate at your 24.0% rate — not tax advice; consult a CPA.
Schools (NCES district)
- District
- Port Huron Area School District
- NCES district ID
- 2628830
- Math proficiency
- 23% ▼ -5.00%
- Reading proficiency
- 37% ▼ -2.00%
- Median HH income
- $42,093
- Composite
- 25.4/100
- National rank
- #7462
- State rank
- #368 of 540 in MI
Livability — Port Huron
- Score
- 65/100
- State rank
- #445
- US rank
- #12478
Category grades
Schools grade is shown separately in the Schools card above.
Census & demographics
- Census place
- Port Huron, MI
- County
- Saint Clair County · 44,760 people
- City population
- 39,342
- Metro
- Detroit-Warren-Dearborn, MI
- Population (ZIP)
- 39,342
- Household income
- $53,018
- Rent vs Own
- Severe rent burden
- 1808.0
Population outlook (St. Clair County) Hauer SSP2
- Today (2025)
- 154,587 people
- By 2030
- 150,031 · -2.9%
- By 2040
- 138,177 · -10.6%
- By 2050
- 124,390 · -19.5%
- By 2075
- 95,825 · -38.0%
- By 2100
- 68,672 · -55.6%
Race, ethnicity, and origin ACS 2023
- Neighborhood character
- Predominantly White (80%)
- Race & ethnicity
- White 80% Black 7% Two or more races 7% Hispanic / Latino 6%
- Hispanic origin (detail)
- Mexican 4%
- Common ancestry
- Romanian 6% Lithuanian 4% Slovak 3%
- Foreign-born
- 2% · Canada
- Languages at home
- 97% English-only · Spanish 2%
Political lean MEDSL · St. Clair
- 2024 margin
- Solid R (+34.6) · D 32.0% · R 66.6% · Other 1.4%
- 2008→2024 swing
- -37.3pp toward R · 2008: 2.6pp · 2024: -34.6pp
- All cycles
- 2024: R+34.6 2020: R+30.2 2016: R+31.4 2012: R+7.1 2008: D+2.6
Not yet ingested
- Civics
- —
Market trends
- HPI YoY
- ▼ -134.75%
- Current HPI
- 177.2401
- Rent YoY
- ▲ 3.61%
- Metro
- Detroit-Warren-Dearborn, MI
- State GDP YoY
- ▲ 1.37%
- F500 in state
- 28
Industry mix (Fortune 500 HQ in MI)
| Industry | F500 HQs | Revenue |
|---|---|---|
| Automotive Parts | 3 | $48B |
|
||
| Automotive | 2 | $372B |
|
||
| Chemicals | 1 | $45B |
|
||
| Automotive Retail | 1 | $29B |
|
||
| Healthcare / Medical Devices | 1 | $23B |
|
||
| Automotive Technology | 1 | $20B |
|
||
Price history
+166.4% since first listed15 events — show timeline
- 2026-05-04 Listed $99,900 MiRealSource-MiMLS
- 2026-05-04 Listing Removed — MiRealSource-MiMLS
- 2026-05-04 Listing Removed — REALCOMP
- 2026-05-04 Listed $99,900 REALCOMP
- 2010-07-06 Sold (MLS) $14,350 MiRealSource-MiMLS
- 2010-06-08 Listing Removed — MiRealSource-MiMLS
- 2010-05-07 Listed $20,000 MiRealSource-MiMLS
- 2002-07-12 Sold (MLS) $85,000 REALCOMP
- 2002-04-29 Listed $81,900 REALCOMP
- 2001-09-30 Listing Removed — REALCOMP
- 2001-01-09 Listed $84,900 REALCOMP
- 1999-03-30 Sold (MLS) $72,000 REALCOMP
- 1998-12-21 Listed $69,900 REALCOMP
- 1998-04-02 Sold (MLS) $37,500 REALCOMP
- 1998-03-05 Listed $37,500 REALCOMP
Property tax history
+6.2%/yrLatest (2025): $979 · +3.0% YoY. Source: county tax records.
Cash-flow waterfall
monthlySold comps — $/sqft
last 12 mo · ≤1 miLoading sold comps…