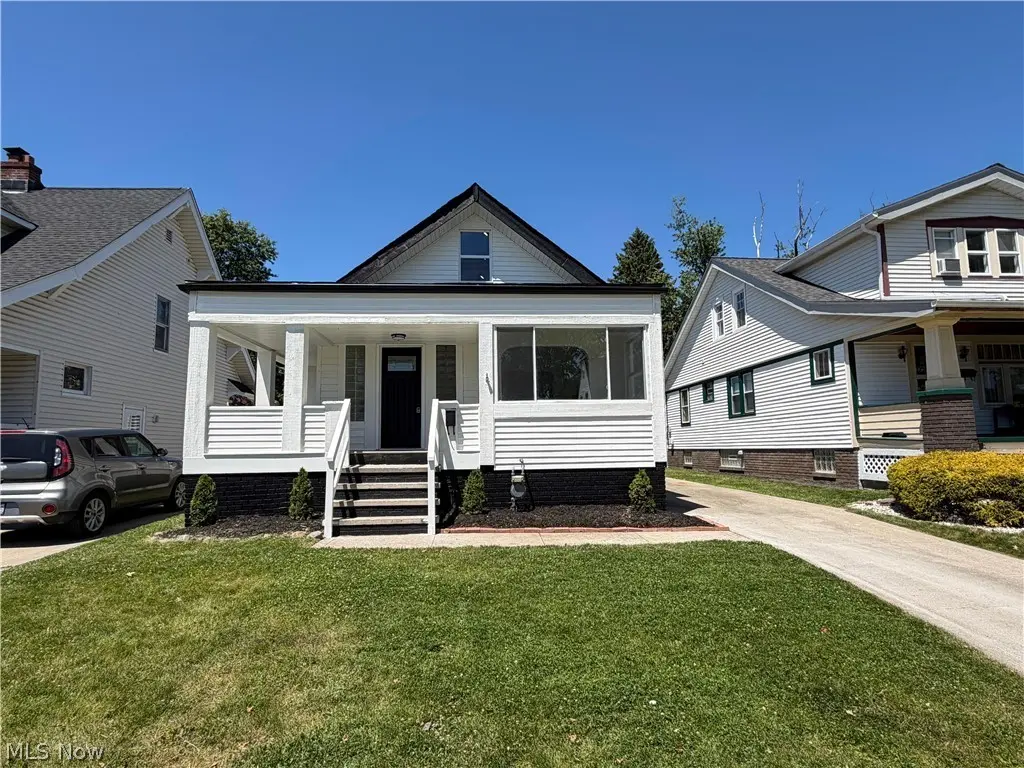
4202 Albertly Ave · Parma, OH
Flood risk 1/10 · Minimal
- FEMA flood zone
- X (unshaded)
- Chance of flooding over 30 yrs
- 0.0%
- Est. flood insurance / yr
- $507 – $1,088
Fire risk 1/10 · Minimal
- Est. fire insurance / yr
- $713 – $1,323
Heat risk 3/10 · Minor
- Hot days now (above 95°F)
- 7 days/yr
- Hot days in 30 yrs
- 17 days/yr
Wind risk 1/10 · Minimal
- Chance of severe wind over 30 yrs
- —
Air-quality risk 3/10 · Minor
- Unhealthy air days now
- 2 days/yr
- Unhealthy air days in 30 yrs
- 4 days/yr
Risk factors via First Street. Map © Google.
Why this score? — see what drove the D grade
The composite is a weighted blend of 9 inputs, each scored 0–100. Each bar is that input's sub-score; the figure is the points it added to the 100-point composite (weight × sub-score).
- Cash flow +17.6/30.0
- DSCR +5.5/10.0
- Rent growth +5.0/5.0
- 1% rule +4.4/10.0
- Schools +4.1/10.0
- Livability +4.1/5.0
- Condition / age +2.5/5.0
- ARV discount +0.0/15.0
- Appreciation +0.0/10.0
$269,900
🖨 Deal sheet (PDF) 📄 Offer letter ✓ Due diligence
Listing remarks MLS
Attention all investors and the handy homeowner looking to build equity. This 3 bedroom, 2 bathroom home with over 1400 square feet of living area features tons of character just waiting to be brought back to her former glory. Located on a quiet street and yet close to highway access, bars, restaurants, shopping and parks, this home is a must see. The finished basement features a wet bar for entertaining. The front porch is a great spot for your morning coffee or to mingle with the friendly neighbors. This is truly a diamond int he rough with so many possibilities.
Key facts
- Quartz countertops
- Stainless appliances
- Huge island
Tags
Neighborhood map
What this means for you Summary
Snapshot
- This is a 5-bed/1.0-bath single-family listed at $270k.
Deal economics
- At list price, monthly cash flow is $210 ($3k/yr) — positive.
- The deal already cash-flows at list — no discount required.
- To meet the 1% rule (rent ≥ 1% of price), the offer needs to be $253k (6.2% below list).
- Recommended offer: $253k (6.2% below list) — sets the bar for 1% rule.
- Cap rate 7.2% vs local median 5.0% in Parma — top-decile yield for the area; either an underpriced asset or a hidden risk that comps aren't pricing in. Stress-test before assuming the spread holds.
Location & tenants
- Location reads 82/100 on livability (#84 in OH, #1,232 nationally) — a professional / high-income tenant draw. Strengths: crime A+, amenities A+, cost of living A+; Watch: employment C-, commute F.
- Parma City (suburban): math 43% / reading 52% proficiency, ranked #469 of 656 in OH (top 72%) — families likely to look elsewhere, expect single-tenant / working-renter base with shorter leases.
- Market conditions: Rents rising fast (+10.6%/yr); 118 active listings in the ZIP; 4 comparable units currently listed for rent nearby; rentals leasing fast (median 8d on market — plan ~1-2 weeks tenant-placement turnaround); 1,441 units permitted in Cuyahoga County in 2024 (700 in 5+ unit buildings).
- This rent runs 44% of the median local income ($69k/yr) — at the standard rent-burdened threshold; future hikes will face affordability resistance.
Forward outlook
- Local home prices are declining (-3.0%/yr); year-one equity from $2k of loan paydown is wiped out by about $8k of value loss. Plan a longer hold.
- Cuyahoga County population projected to shrink 8% by 2050 — rents likely to lag national; underwrite the cash flow, not the appreciation.
- At projected returns (-3.0% appreciation + 8.0% rent growth), your $76k cash investment doubles in ~10 years — after that, you're playing with house money.
Negotiation context
- Only 4 days on market — expect competitive offers; lowballing is unlikely to land.
- 2 sale attempts with the ask held roughly flat each time — persistent listings suggest the price (not the market) is what's stuck; bring a comps-based counter.
- Current owner paid $156k; list at $270k implies a 73% gain — meaningful room to come down on a strong offer.
Risks & watch-outs
- Watch-outs: built in 1929 — expect roof / HVAC / electrical / plumbing capex.
Questions for the listing agent
- Built in 1929 — when were the roof, HVAC, electrical panel, plumbing, and water heater last replaced?
- Is there a deadline driving the sale (1031 exchange, divorce, estate, relocation)? That informs how much negotiation room exists.
- Schools are B-rated — typically a magnet for longer-tenancy family renters. What's the average tenant stay here, and is there a school-zone premium baked into asking?
- The area grade is low — what's the realistic commute time and amenity access for the typical tenant pool here? Any planned neighborhood developments (good or bad) we should know about?
- What's the average days-on-market for RENTAL listings here right now (not sales)? A rising rental-DOM trend means longer vacancies and softer asking-rent achievability than the comps imply.
- What's the recent tenant-quality profile in this submarket — average credit score on applications, eviction rate, late-payment / NSF rate, and stable-employment percentage? A property-management company in the area should have these aggregated.
- How much new for-sale + rental construction is in the pipeline within 1–3 miles? Heavy new supply typically softens prices + rents 12–24 months out; constrained supply supports both.
Investment metrics
- 1% rule
- 0.94% ✗
- Cap rate
- 7.23%
- Cash-on-cash
- 3.34%
- DSCR
- 1.15
- GRM
- 8.9
CMA / ARV
- ARV (on-the-fly)
- $226,257
- Comps found
- 12
Show comp detail 12 sales within ~0.75 mi
| Address | Dist | Beds/Ba | Sqft | Sold | Price | $/sf | Match |
|---|---|---|---|---|---|---|---|
| 4315 Redfern Rd | 0.15mi | 4/2.0 (-1) | 1,347 (-5%) | 16mo | $213,000 | $158 | 62 |
| 5706 Brownfield Dr | 0.66mi | 4/1.5 (-1) | 1,418 (-0%) | 1mo | $200,000 | $141 | 61 |
| 4207 Dawnshire Dr | 0.08mi | 4/2.0 (-1) | 1,254 (-12%) | 11mo | $200,000 | $159 | 58 |
| 5000 Torrington Ave | 0.73mi | 4/1.0 (-1) | 1,431 (+1%) | 7mo | $150,000 | $105 | 54 |
| 3910 Wood Ave | 0.51mi | 4/1.5 (-1) | 1,279 (-10%) | 5mo | $155,000 | $121 | 48 |
| 3218 Somia Dr | 0.64mi | 4/2.0 (-1) | 1,312 (-8%) | 8mo | $255,000 | $194 | 42 |
| 3318 Hearthstone Rd | 0.53mi | 5/2.5 | 1,580 (+11%) | 14mo | $259,000 | $164 | 39 |
| 5906 Morningside Dr | 0.66mi | 4/2.0 (-1) | 1,326 (-7%) | 14mo | $208,000 | $157 | 37 |
| 4507 Pershing Ave | 0.56mi | 4/2.0 (-1) | 1,227 (-14%) | 11mo | $250,000 | $204 | 33 |
| 5810 Renwood Dr | 0.72mi | 4/1.0 (-1) | 1,236 (-13%) | 14mo | $180,000 | $146 | 28 |
| 6206 Hampstead Ave | 0.75mi | 4/2.0 (-1) | 1,269 (-11%) | 14mo | $218,000 | $172 | 26 |
| 5707 Forest Ave | 0.75mi | 4/1.5 (-1) | 1,219 (-14%) | 13mo | $229,300 | $188 | 23 |
Match score weights: distance 35% · size 25% · config 20% · recency 20%. Top-matched comps best support the ARV.
Projected returns pro-forma
-3.0% appreciation · 8.0% rent growth · sell at horizon
- IRR
- -5.8%
- Equity multiple
- 0.78×
- Total profit
- $-16,963
- Equity at exit
- $40,243
- IRR
- 9.0%
- Equity multiple
- 1.84×
- Total profit
- $63,346
- Equity at exit
- $23,336
Cash invested: $75,572 (down + closing). Projections, not guarantees.
Landlord ↔ Tenant lean methodology
- Overall (STATE)
- 73 Landlord-Friendly
- State Ohio
- 73 Landlord-Friendly · R+6
- County
- — inherits STATE
- City
- — inherits STATE
ZIP-level market 44134
- Rents YoY
- 10.6%
- Active inventory
- 118
- Price-to-rent
- 8.9×
Monthly cashflow live
- Estimated rent
- $2,532 medium interval (Pro) →
- Mortgage (P&I)
- −$1,415
- Tax from tax record
- −$262 /mo · $3,141/yr
- Insurance
- −$112
- HOA
- −$0
- Vacancy / Maint / Mgmt
- −$532
- Net cashflow
- $210
Break-even live
Sensitivity live
| Price | -10% $363 | -5% $287 | +0% $210 | +5% $134 | +10% $58 |
|---|---|---|---|---|---|
| Rent | -10% $10 | -5% $110 | +0% $210 | +5% $310 | +10% $410 |
| Rate | -1.0pp $346 | -0.5pp $279 | base $210 | +0.5pp $140 | +1.0pp $69 |
UW: 25.0% down · 7.5% · 30yr · 1.5% tax · 5.0% vac · 8.0% maint · 8.0% mgmt
Financing live
Cash to close
- Down payment
- $67,475
- Closing costs
- $8,097
- Reserves months
- —
- Total cash needed
- —
Loan-product check · same deal, 3 products live
Conventional
25% down · 7.5% · 30yr
- Down + closing
- —
- Monthly P&I
- —
- Monthly cashflow
- —
- DSCR
- —
- Eligible?
- —
Personal DTI + credit; lowest rate.
DSCR
20% down · 8.5% · 30yr
- Down + closing
- —
- Monthly P&I
- —
- Monthly cashflow
- —
- DSCR
- —
- Eligible?
- —
No personal income docs; deal must DSCR.
Hard money
10% down · 12.0% · 12mo
- Down + closing
- —
- Monthly P&I
- —
- Monthly cashflow
- —
- DSCR
- —
- Eligible?
- —
Short-term bridge; refi at stabilization.
Rent comps 4 comps
| Address | Beds | Baths | Sqft | Rent | $/sqft | DOM | Units | Dist |
|---|---|---|---|---|---|---|---|---|
| 4191 W Ridgewood Dr Unit 4193 Parma, OH | 4.0 | 3.0 | 1800 | $1,950 | $1.08 | 44d | 1 | 1.04mi |
| 2716 Lincoln Ave Unit 1288912P Parma, OH | 4.0 | 2.0 | 1205 | $4,125 | $3.42 | 8d | 1 | 1.11mi |
| 7514 Bertha Ave Cleveland, OH | 5.0 | 2.0 | 1672 | $1,776 | $1.06 | 2d | 1 | 1.18mi |
| 7906 Lanyard Dr Unit 1496071P Parma, OH | 4.0 | 1.5 | 1227 | $5,834 | $4.75 | 8d | 1 | 1.33mi |
Listing history 5 events
-
2026-06-13statusdays on market $269,900 Pending 4 DOM
-
2026-06-09days on market $269,900 Active 3 DOM
-
2026-06-08days on market $269,900 Active 2 DOM
-
2026-06-07remarks 699-char remark
-
2026-06-07$269,900 Active 1 DOM
ⓘ Source: listings_history table (triggers on properties + properties_extension) + one-shot
backfill from property_details.listing_events for pre-trigger history.
Tax reassessment forecast OH · Partial reset (capped growth)
- Current annual tax
- $3,141 · $262/mo
- Projected year-2 tax
- $3,676 · $306/mo
- Expected delta
- +$535/yr (+$45/mo · 17.0%)
ⓘ Screening estimate from a state-policy table — verify with the county assessor before closing.
Climate risk First Street
- Flood 1/10 Low FEMA zone X (unshaded) · 0% chance over 30 yrs
- Wildfire 1/10 Low
- Heat 3/10 Moderate 7 d/yr ≥95°F today · 17 d/yr by 30 yrs out
- Wind 1/10 Low
- Air quality 3/10 Moderate 2 unhealthy d/yr today · 4 by 30 yrs out
Nearby sold comps map
Loading sold comps map…
Walkable amenities ~0.75 mi
Loading nearby amenities…
Taxation est. · year 1
- Rental income
- $30,380
- − Mortgage interest
- −$15,119
- − Property taxes
- −$3,141
- − Insurance
- −$1,350
- − Repairs & maintenance
- −$2,430
- − Management
- −$2,430
- − Depreciation
- −$7,852
- Taxable loss
- −$1,942
- Est. tax savings @ 24.0%
- +$466
- After-tax cash flow
- $2,991/yr
For passive investors: Depreciation is non-cash, so a rental often shows a tax loss while cash-flowing — sheltering income. Rental losses are passive: they offset passive income freely, and up to $25,000/yr can offset ordinary (W-2) income if you actively participate and your MAGI is under $100k (phasing out to $0 by $150k); unused losses carry forward. On sale, claimed depreciation is recaptured at up to 25%, and gains may owe capital-gains tax (a 1031 exchange can defer both). Figures are a year-1 estimate at your 24.0% rate — not tax advice; consult a CPA.
Schools (NCES district)
- District
- Parma City
- NCES district ID
- 3904463
- Math proficiency
- 43% ▼ -18.00%
- Reading proficiency
- 52% ▼ -10.00%
- Median HH income
- $50,371
- Composite
- 40.72/100
- National rank
- #3662
- State rank
- #469 of 656 in OH
Livability — Parma
- Score
- 82/100
- State rank
- #84
- US rank
- #1232
Category grades
Schools grade is shown separately in the Schools card above.
Census & demographics
- Census place
- Parma, OH
- County
- Cuyahoga County · 1,090,369 people
- City population
- 66,574
- Metro
- Cleveland-Elyria, OH
- Population (ZIP)
- 37,774
- Household income
- $68,625
- Rent vs Own
- Severe rent burden
- 668.0
Population outlook (Cuyahoga County) Hauer SSP2
- Today (2025)
- 1,244,621 people
- By 2030
- 1,230,093 · -1.2%
- By 2040
- 1,189,108 · -4.5%
- By 2050
- 1,145,706 · -7.9%
- By 2075
- 1,076,557 · -13.5%
- By 2100
- 978,987 · -21.3%
Race, ethnicity, and origin ACS 2023
- Neighborhood character
- Predominantly White (85%)
- Race & ethnicity
- White 85% Two or more races 6% Hispanic / Latino 5% Black 3% Asian 3%
- Common ancestry
- Romanian 14% Subsaharan African 6% Slovak 1%
- Foreign-born
- 11% · Canada, Vietnam
- Languages at home
- 84% English-only · Russian/Polish/Slavic 7% Spanish 3% Other Indo-European 2%
Political lean MEDSL · Cuyahoga
- 2024 margin
- Solid D (+31.5) · D 65.4% · R 33.9%
- 2008→2024 swing
- -7.4pp toward R · 2008: 38.9pp · 2024: 31.5pp
- All cycles
- 2024: D+31.5 2020: D+34.1 2016: D+35.0 2012: D+38.7 2008: D+38.9
Not yet ingested
- Civics
- —
Market trends
- HPI YoY
- ▼ -215.17%
- Current HPI
- 184.0553
- Rent YoY
- ▲ 10.56%
- Metro
- Cleveland-Elyria, OH
- State GDP YoY
- ▲ 1.98%
- F500 in state
- 48
Industry mix (Fortune 500 HQ in OH)
| Industry | F500 HQs | Revenue |
|---|---|---|
| Insurance | 3 | $145B |
|
||
| Industrial Machinery | 3 | $49B |
|
||
| Financial Services | 3 | $24B |
|
||
| Consumer Goods | 2 | $93B |
|
||
| Aerospace / Defense | 2 | $47B |
|
||
| Utilities | 2 | $33B |
|
||
Price history
+86.8% since first listed4 events — show timeline
- 2026-06-06 Listed $269,900 MLSNOW
- 2026-04-10 Sold (MLS) $155,700 MLSNOW
- 2026-03-27 Pending — MLSNOW
- 2026-03-23 Listed $144,500 MLSNOW
Property tax history
+2.3%/yrLatest (2025): $3,141 · -5.4% YoY. Source: county tax records.
Cash-flow waterfall
monthlySold comps — $/sqft
last 12 mo · ≤1 miLoading sold comps…