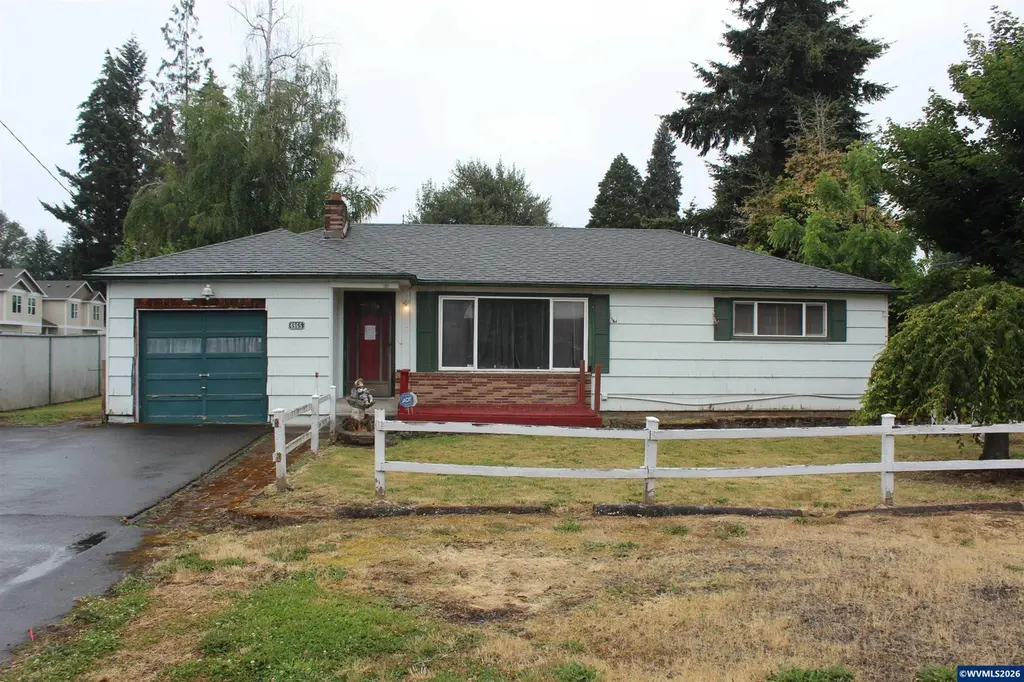
4965 Elizabeth St N · Keizer, OR
Flood risk 6/10 · Moderate
- FEMA flood zone
- X (shaded)
- Chance of flooding over 30 yrs
- 0.72%
- Est. flood insurance / yr
- $507 – $1,088
Fire risk 4/10 · Minor
- Est. fire insurance / yr
- $498 – $926
Heat risk 3/10 · Minor
- Hot days now (above 92°F)
- 7 days/yr
- Hot days in 30 yrs
- 14 days/yr
Wind risk 1/10 · Minimal
- Chance of severe wind over 30 yrs
- —
Air-quality risk 10/10 · Severe
- Unhealthy air days now
- 13 days/yr
- Unhealthy air days in 30 yrs
- 14 days/yr
Risk factors via First Street. Map © Google.
Why this score? — see what drove the C- grade
The composite is a weighted blend of 9 inputs, each scored 0–100. Each bar is that input's sub-score; the figure is the points it added to the 100-point composite (weight × sub-score).
- ARV discount +15.0/15.0
- Cash flow +14.8/30.0
- DSCR +4.5/10.0
- Livability +4.0/5.0
- Schools +3.7/10.0
- 1% rule +3.4/10.0
- Rent growth +3.4/5.0
- Condition / age +2.5/5.0
- Appreciation +0.0/10.0
$285,000
🖨 Deal sheet (PDF) 📄 Offer letter ✓ Due diligence
Listing remarks
Prime investment opportunity! This ranch-style home offers a functional layout with tons of potential, featuring hardwood floors, a classic brick fireplace, and spacious rooms throughout. Situated on an oversized flat RM-zoned multifamily lot, the property presents additional possibilities for future development. Convenient Keizer location close to shopping, dining, schools, and commuter routes.
Key facts
- Brick fireplace
- Hardwood floors
- 0.27 acre lot
Tags
Property features AI
Finance
- Other: Situated on an oversized RM-zoned multifamily lot
Exterior
- Parking: Attached 1-car garage
- Utilities: City water; Gas water heater
- Home design: Single-story ranch-style home; Built in 1954; White exterior
- Construction: Wood siding; Composition (asphalt) roof; Continuous foundation
- Exterior features: Fenced yard; Covered patio; Shed (outbuilding)
Interior
- Kitchen: Electric range; Dishwasher
- Bedrooms: Main-level primary bedroom approximately 15' x 11'; Main-level second bedroom approximately 13' x 11'; Third bedroom approximately 12' x 11'
- Flooring: Wood flooring; Vinyl flooring
- Bathrooms: Two full bathrooms
- Interior features: Wood and vinyl flooring throughout; Brick wood-burning fireplace in the living room; Rec room (bonus room)
- Laundry & utility: Main-level utility room
Neighborhood map
What this means for you Summary
Snapshot
- This is a 3-bed/2.0-bath single-family listed at $285k.
Deal economics
- At list price, monthly cash flow is $80 ($956/yr) — positive.
- The deal already cash-flows at list — no discount required.
- To meet the 1% rule (rent ≥ 1% of price), the offer needs to be $240k (15.7% below list).
- Recommended offer: $240k (15.7% below list) — sets the bar for 1% rule.
- Cap rate 6.6% vs local median 2.9% in Keizer — top-decile yield for the area; either an underpriced asset or a hidden risk that comps aren't pricing in. Stress-test before assuming the spread holds.
Location & tenants
- Location reads 80/100 on livability (#56 in OR, #1,918 nationally) — a professional / high-income tenant draw. Strengths: housing A+, health & safety A+, crime B+; Watch: commute D+.
- Salem-Keizer SD 24J (urban): math 34% / reading 47% proficiency, ranked #103 of 183 in OR (top 56%) — families likely to look elsewhere, expect single-tenant / working-renter base with shorter leases.
- Zoned schools: Cummings Elementary School (435 students, 97% FRL); Claggett Creek Middle School (829 students, 73% FRL); Mcnary High School (2,081 students, 92% FRL) — zoned schools average 87% FRL vs 53% district-wide (34 pts higher); higher-poverty schools than district average — tighter screening recommended.
- Market conditions: Rents rising (+3.7%/yr); 177 active listings in the ZIP; 7 comparable units currently listed for rent nearby; rentals at typical pace (median 23d on market — plan ~3-4 weeks tenant-placement turnaround); solid renter incomes; 1,591 units permitted in Marion County in 2024 (716 in 5+ unit buildings).
- This rent runs 34% of the median local income ($85k/yr) — at the standard rent-burdened threshold; future hikes will face affordability resistance.
Forward outlook
- Local home prices are declining (-3.0%/yr); year-one equity from $2k of loan paydown is wiped out by about $9k of value loss. Plan a longer hold.
- Marion County population projected at +17% by 2050 — long-run rental-demand tailwind backs the buy-and-hold thesis.
Negotiation context
- Only 3 days on market — expect competitive offers; lowballing is unlikely to land.
- 2 sale attempts since 19y ago with the ask held roughly flat each time — persistent listings suggest the price (not the market) is what's stuck; bring a comps-based counter.
- Current owner paid $165k; list at $285k implies a 73% gain — meaningful room to come down on a strong offer.
Risks & watch-outs
- Watch-outs: built in 1954 — expect roof / HVAC / electrical / plumbing capex.
- Climate carrying-cost: major flood risk — expect insurance premiums to compound above CPI over the hold.
Questions for the listing agent
- Built in 1954 — when were the roof, HVAC, electrical panel, plumbing, and water heater last replaced?
- Is there a deadline driving the sale (1031 exchange, divorce, estate, relocation)? That informs how much negotiation room exists.
- Schools are D-rated, which usually means shorter tenancies and higher turnover. Who's the typical renter profile here, and what's been the actual vacancy rate?
- What's the average days-on-market for RENTAL listings here right now (not sales)? A rising rental-DOM trend means longer vacancies and softer asking-rent achievability than the comps imply.
- What's the recent tenant-quality profile in this submarket — average credit score on applications, eviction rate, late-payment / NSF rate, and stable-employment percentage? A property-management company in the area should have these aggregated.
- How much new for-sale + rental construction is in the pipeline within 1–3 miles? Heavy new supply typically softens prices + rents 12–24 months out; constrained supply supports both.
Investment metrics
- 1% rule
- 0.84% ✗
- Cap rate
- 6.63%
- Cash-on-cash
- 1.20%
- DSCR
- 1.05
- GRM
- 9.9
CMA / ARV
- ARV (on-the-fly)
- $497,620
- Comps found
- 12
Show comp detail 12 sales within ~0.75 mi
| Address | Dist | Beds/Ba | Sqft | Sold | Price | $/sf | Match |
|---|---|---|---|---|---|---|---|
| 291 Janet Ave N | 0.06mi | 3/2.0 | 1,869 (+4%) | 7mo | $425,000 | $227 | 84 |
| 613 Lakefair Pl N | 0.59mi | 3/2.0 | 1,839 (+3%) | 8mo | $625,000 | $340 | 62 |
| 755 Ventura St N | 0.35mi | 3/2.0 | 1,560 (-13%) | 2mo | $445,000 | $285 | 61 |
| 818 Chehalis Pl N | 0.58mi | 4/3.0 (+1) | 1,800 (+1%) | 2mo | $490,000 | $272 | 61 |
| 4875 Crater Ave N | 0.33mi | 3/2.0 | 1,556 (-13%) | 3mo | $440,000 | $283 | 60 |
| 820 Ivy Way NE | 0.64mi | 3/2.0 | 1,665 (-7%) | 1mo | $349,231 | $210 | 58 |
| 870 Rafael Ave N | 0.61mi | 3/2.0 | 1,638 (-8%) | 4mo | $455,700 | $278 | 54 |
| 4575 Clark Ave NE | 0.63mi | 3/2.0 | 1,632 (-9%) | 2mo | $330,000 | $202 | 54 |
| 1073 Rafael Ave N | 0.69mi | 4/2.5 (+1) | 1,908 (+7%) | 1mo | $495,000 | $259 | 49 |
| 988 Ventura Ave N | 0.59mi | 3/1.5 | 1,954 (+9%) | 8mo | $410,000 | $210 | 49 |
| 5749 Waterford Way | 0.75mi | 3/2.0 | 1,579 (-12%) | 7mo | $484,000 | $307 | 40 |
| 845 Sonata Ln N | 0.75mi | 3/2.0 | 1,546 (-14%) | 4mo | $470,000 | $304 | 38 |
Match score weights: distance 35% · size 25% · config 20% · recency 20%. Top-matched comps best support the ARV.
Projected returns pro-forma
-3.0% appreciation · 3.74% rent growth · sell at horizon
- IRR
- -13.6%
- Equity multiple
- 0.51×
- Total profit
- $-39,364
- Equity at exit
- $42,494
- IRR
- -3.7%
- Equity multiple
- 0.74×
- Total profit
- $-20,468
- Equity at exit
- $24,642
Cash invested: $79,800 (down + closing). Projections, not guarantees.
Landlord ↔ Tenant lean methodology
- Overall (STATE)
- 28 Tenant-Leaning
- State Oregon
- 28 Tenant-Leaning · D+6
- County
- — inherits STATE
- City
- — inherits STATE
ZIP-level market 97303
- Rents YoY
- 3.7%
- Active inventory
- 177
- Price-to-rent
- 9.9×
Monthly cashflow live
- Estimated rent
- $2,403 high interval (Pro) →
- Mortgage (P&I)
- −$1,495
- Tax from tax record
- −$205 /mo · $2,460/yr
- Insurance
- −$119
- HOA
- −$0
- Vacancy / Maint / Mgmt
- −$505
- Net cashflow
- $80
Break-even live
Sensitivity live
| Price | -10% $241 | -5% $160 | +0% $80 | +5% $-1 | +10% $-82 |
|---|---|---|---|---|---|
| Rent | -10% $-110 | -5% $-15 | +0% $80 | +5% $175 | +10% $269 |
| Rate | -1.0pp $223 | -0.5pp $152 | base $80 | +0.5pp $6 | +1.0pp $-69 |
UW: 25.0% down · 7.5% · 30yr · 1.5% tax · 5.0% vac · 8.0% maint · 8.0% mgmt
Financing live
Cash to close
- Down payment
- $71,250
- Closing costs
- $8,550
- Reserves months
- —
- Total cash needed
- —
Loan-product check · same deal, 3 products live
Conventional
25% down · 7.5% · 30yr
- Down + closing
- —
- Monthly P&I
- —
- Monthly cashflow
- —
- DSCR
- —
- Eligible?
- —
Personal DTI + credit; lowest rate.
DSCR
20% down · 8.5% · 30yr
- Down + closing
- —
- Monthly P&I
- —
- Monthly cashflow
- —
- DSCR
- —
- Eligible?
- —
No personal income docs; deal must DSCR.
Hard money
10% down · 12.0% · 12mo
- Down + closing
- —
- Monthly P&I
- —
- Monthly cashflow
- —
- DSCR
- —
- Eligible?
- —
Short-term bridge; refi at stabilization.
Rent comps 7 comps
| Address | Beds | Baths | Sqft | Rent | $/sqft | DOM | Units | Dist |
|---|---|---|---|---|---|---|---|---|
| 4848 Elvira Pl N Keizer, OR | 3.0 | 2.5 | 1838 | $2,600 | $1.41 | 45d | 2 | 0.22mi |
| 776 Dearborn Ave NE Keizer, OR | 3.0 | 1.0 | 1230 | $2,300 | $1.87 | 45d | 1 | 0.42mi |
| 491 Marino Dr N Unit 495 Keizer, OR | 3.0 | 2.0 | 1285 | $2,350 | $1.83 | 15d | 1 | 0.62mi |
| 4928 13th Ave NE Keizer, OR | 4.0 | 1.5 | 1312 | $2,425 | $1.85 | 23d | 1 | 0.69mi |
| 4853 Verda Ln NE Keizer, OR | 1.0–3.0 | 1.0–2.0 | 968 | $2,279 | $2.35 | 15d | 10 | 0.85mi |
| 5188 Perry St NE Keizer, OR | 3.0 | 2.0 | 1362 | $2,550 | $1.87 | 15d | 1 | 1.02mi |
| 6766 Fenwick Ct N Keizer, OR | 4.0 | 2.0 | 1488 | $2,500 | $1.68 | 25d | 1 | 1.36mi |
Listing history 5 events
-
2026-06-14statusdays on market $285,000 Pending 3 DOM
-
2026-06-10remarks 398-char remark
-
2026-06-10days on market $285,000 Active 2 DOM
-
2026-06-09remarks 393-char remark
-
2026-06-09$285,000 Active 1 DOM
ⓘ Source: listings_history table (triggers on properties + properties_extension) + one-shot
backfill from property_details.listing_events for pre-trigger history.
Tax reassessment forecast OR · Resets to sale price
- Current annual tax
- $2,460 · $205/mo
- Projected year-2 tax
- $2,764 · $230/mo
- Expected delta
- +$304/yr (+$25/mo · 12.4%)
ⓘ Screening estimate from a state-policy table — verify with the county assessor before closing.
Climate risk First Street
- Flood 6/10 Major FEMA zone X (shaded) · 72% chance over 30 yrs
- Wildfire 4/10 Moderate
- Heat 3/10 Moderate 7 d/yr ≥92°F today · 14 d/yr by 30 yrs out
- Wind 1/10 Low
- Air quality 10/10 Extreme 13 unhealthy d/yr today · 14 by 30 yrs out
Nearby sold comps map
Loading sold comps map…
Walkable amenities ~0.75 mi
Loading nearby amenities…
Taxation est. · year 1
- Rental income
- $28,830
- − Mortgage interest
- −$15,964
- − Property taxes
- −$2,460
- − Insurance
- −$1,425
- − Repairs & maintenance
- −$2,306
- − Management
- −$2,306
- − Depreciation
- −$8,291
- Taxable loss
- −$3,923
- Est. tax savings @ 24.0%
- +$942
- After-tax cash flow
- $1,897/yr
For passive investors: Depreciation is non-cash, so a rental often shows a tax loss while cash-flowing — sheltering income. Rental losses are passive: they offset passive income freely, and up to $25,000/yr can offset ordinary (W-2) income if you actively participate and your MAGI is under $100k (phasing out to $0 by $150k); unused losses carry forward. On sale, claimed depreciation is recaptured at up to 25%, and gains may owe capital-gains tax (a 1031 exchange can defer both). Figures are a year-1 estimate at your 24.0% rate — not tax advice; consult a CPA.
Schools (NCES district)
- District
- Salem-Keizer SD 24J
- NCES district ID
- 4110820
- Math proficiency
- 34% ▼ -1.00%
- Reading proficiency
- 47% ▼ -2.00%
- Median HH income
- $48,632
- Composite
- 37.16/100
- National rank
- #9017
- State rank
- #103 of 183 in OR
Livability — Keizer
- Score
- 80/100
- State rank
- #56
- US rank
- #1918
Category grades
Schools grade is shown separately in the Schools card above.
Census & demographics
- Census place
- Keizer, OR
- County
- Marion County · 258,219 people
- City population
- 40,659
- Metro
- Salem, OR
- Population (ZIP)
- 40,659
- Household income
- $84,871
- Rent vs Own
- Severe rent burden
- 1297.0
Population outlook (Marion County) Hauer SSP2
- Today (2025)
- 360,940 people
- By 2030
- 375,178 · +3.9%
- By 2040
- 400,914 · +11.1%
- By 2050
- 422,187 · +17.0%
- By 2075
- 460,305 · +27.5%
- By 2100
- 464,025 · +28.6%
Race, ethnicity, and origin ACS 2023
- Neighborhood character
- Predominantly White (67%)
- Race & ethnicity
- White 67% Hispanic / Latino 25% Two or more races 14% Native American 1% Asian 1%
- Hispanic origin (detail)
- Mexican 21%
- Common ancestry
- Lithuanian 4% Portuguese 3% Italian 3%
- Foreign-born
- 10% · Canada, China
- Languages at home
- 83% English-only · Spanish 13% Other Asian/Pacific 1% French/Haitian/Cajun 1%
Political lean MEDSL · Marion
- 2024 margin
- Toss-up / Even · D 47.5% · R 49.5% · Other 3.0%
- 2008→2024 swing
- -4.2pp toward R · 2008: 2.2pp · 2024: -2.0pp
- All cycles
- 2024: R+2.0 2020: D+1.1 2016: R+5.0 2012: R+3.5 2008: D+2.2
Not yet ingested
- Civics
- —
Market trends
- HPI YoY
- ▼ -428.84%
- Current HPI
- 292.0057
- Rent YoY
- ▲ 3.74%
- Metro
- Salem, OR
- State GDP YoY
- ▲ 2.05%
- F500 in state
- 2
Industry mix (Fortune 500 HQ in OR)
| Industry | F500 HQs | Revenue |
|---|---|---|
| Consumer Goods | 1 | $51B |
|
||
Price history
+375.0% since first listed6 events — show timeline
- 2026-06-08 Listed $285,000 WVMLS
- 2007-12-21 Sold (Public Records) $165,000 Public Records
- 2007-12-21 Sold (MLS) $165,000 WVMLS
- 2007-07-13 Listed $175,000 WVMLS
- 1996-12-31 Sold (Public Records) $66,700 Public Records
- 1993-06-18 Sold (Public Records) $60,000 Public Records
Property tax history
+2.2%/yrLatest (2025): $2,460 · +3.0% YoY. Source: county tax records.
Cash-flow waterfall
monthlySold comps — $/sqft
last 12 mo · ≤1 miLoading sold comps…