1066 49th · San Bernardino, CA
Flood risk 1/10 · Minimal
- FEMA flood zone
- X (shaded)
- Chance of flooding over 30 yrs
- 0.0%
- Est. flood insurance / yr
- $507 – $1,088
Fire risk 8/10 · Major
- Est. fire insurance / yr
- $659 – $1,223
Heat risk 8/10 · Major
- Hot days now (above 102°F)
- 7 days/yr
- Hot days in 30 yrs
- 20 days/yr
Wind risk 1/10 · Minimal
- Chance of severe wind over 30 yrs
- —
Air-quality risk 10/10 · Severe
- Unhealthy air days now
- 26 days/yr
- Unhealthy air days in 30 yrs
- 33 days/yr
Risk factors via First Street. Map © Google.
Why this score? — see what drove the C+ grade
The composite is a weighted blend of 9 inputs, each scored 0–100. Each bar is that input's sub-score; the figure is the points it added to the 100-point composite (weight × sub-score).
- Cash flow +27.9/30.0
- DSCR +9.9/10.0
- 1% rule +7.6/10.0
- ARV discount +7.5/15.0
- Rent growth +3.4/5.0
- Schools +3.1/10.0
- Livability +3.0/5.0
- Condition / age +2.5/5.0
- Appreciation +0.0/10.0
$190,000
🖨 Deal sheet 📄 Offer letter ✓ Due diligence
Listing remarks MLS
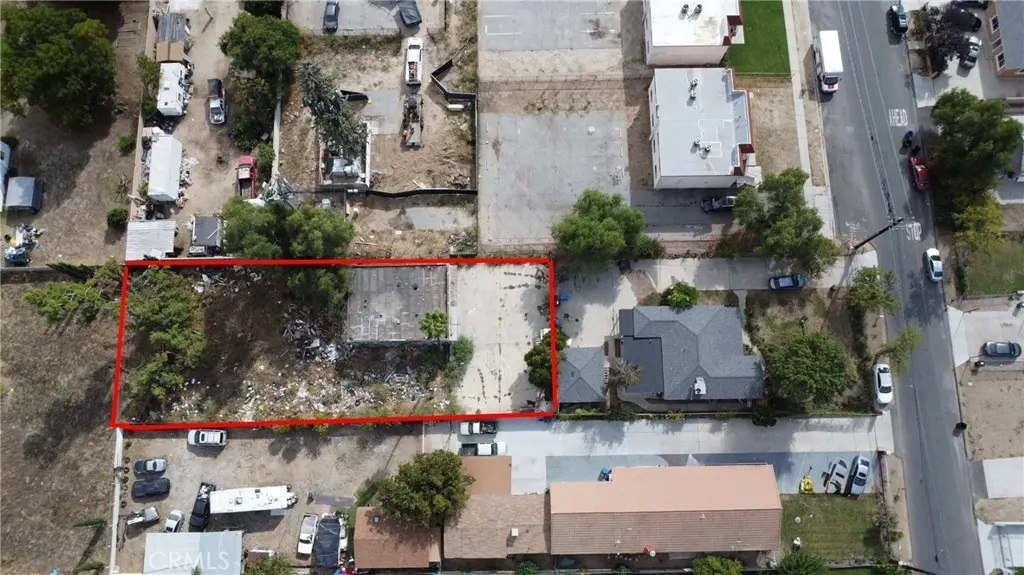
BUILDER’S SPECIAL - Unlock the potential of this flat, 9,000+ sqft infill lot located in a rapidly growing pocket of North San Bernardino. Zoned for single or multi-unit development, this site is perfect for a builder looking for their next project in a high-demand rental and resale market. The lot already includes existing slab/foundation areas, utilities alley access, and a layout that allows for efficient site planning. Whether you’re building ADUs, a duplex/triplex, or a modern single-family with additional income units — this is a rare blank canvas. Go Direct, DO NOT USE SHOWTIME! Contact Hannah Suri 951-238-9751
Key facts
- 9,715 sq ft lot
- 2 garage spots
- Built 1980
Neighborhood map
What this means for you Summary
Snapshot
- This is a 2-bed/1.0-bath other listed at $190k.
Deal economics
- At list price, monthly cash flow is $585 ($7k/yr) — positive.
- The deal already cash-flows at list — no discount required.
- Meets the 1% rule at list price ($2k rent vs $190k).
- Recommended offer: $167k (12.0% below list) — sets the bar for market timing.
- Cap rate 10.0% vs local median 3.5% in San Bernardino — top-decile yield for the area; either an underpriced asset or a hidden risk that comps aren't pricing in. Stress-test before assuming the spread holds.
Location & tenants
- Location reads 59/100 on livability (#661 in CA) — a working-class tenant base; expect higher turnover. Strengths: commute A+, housing A; Watch: schools D, employment D, crime F.
- San Bernardino City Unified (urban): math 27% / reading 40% proficiency, ranked #959 of 1,400 in CA (top 68%) — families likely to look elsewhere, expect single-tenant / working-renter base with shorter leases; 81% free/reduced lunch — lower-income household profile, screen leases tightly.
- Market conditions: Rents rising (+3.4%/yr); 125 active listings in the ZIP; 10 comparable units currently listed for rent nearby; rentals at typical pace (median 21d on market — plan ~3-4 weeks tenant-placement turnaround); 40% of comp listings sitting > 30 days — soft ceiling on asking rent; solid renter incomes; 5,458 units permitted in San Bernardino County in 2024 (1,500 in 5+ unit buildings).
- This rent runs 31% of the median local income ($94k/yr) — at the standard rent-burdened threshold; future hikes will face affordability resistance.
Forward outlook
- Local home prices are declining (-3.0%/yr); year-one equity from $1k of loan paydown is wiped out by about $6k of value loss. Plan a longer hold.
- San Bernardino County population projected at +15% by 2050 — modest demand growth; plan on rents tracking national, not racing it.
- At projected returns (-3.0% appreciation + 3.4% rent growth), your $53k cash investment doubles in ~9 years — after that, you're playing with house money.
Negotiation context
- It's been on market 237 days — a 12% lower offer ($167k) is reasonable based on typical stale-listing flexibility.
- 2 sale attempts; this cycle's ask has dropped $10k (5%) from the opening price — seller is motivated, your offer sets the floor, not the list.
Risks & watch-outs
- Climate carrying-cost: severe wildfire risk; extreme-heat days projected 7→20/yr by 2055 (HVAC capex compounding) — expect insurance premiums to compound above CPI over the hold.
Questions for the listing agent
- It's been on market 237 days. Have you received any prior offers? Is the seller open to a 12% concession, seller financing, or rate buy-down credit?
- Why hasn't it sold? Are there any deal-killer items the seller is aware of (foundation, flood, title, zoning, code violations)?
- Is there a deadline driving the sale (1031 exchange, divorce, estate, relocation)? That informs how much negotiation room exists.
- Schools are D-rated, which usually means shorter tenancies and higher turnover. Who's the typical renter profile here, and what's been the actual vacancy rate?
- Crime grade is F in this area — have there been break-ins, vandalism, or insurance claims at this property in the last 3 years? What carrier currently insures it and at what premium?
- What's the average days-on-market for RENTAL listings here right now (not sales)? A rising rental-DOM trend means longer vacancies and softer asking-rent achievability than the comps imply.
- What's the recent tenant-quality profile in this submarket — average credit score on applications, eviction rate, late-payment / NSF rate, and stable-employment percentage? A property-management company in the area should have these aggregated.
- How much new for-sale + rental construction is in the pipeline within 1–3 miles? Heavy new supply typically softens prices + rents 12–24 months out; constrained supply supports both.
Investment metrics
- 1% rule
- 1.26% ✓
- Cap rate
- 9.99%
- Cash-on-cash
- 13.21%
- DSCR
- 1.59
- GRM
- 6.6
CMA / ARV
- ARV (median comp)
- $486,949
- List price
- $190,000
- Delta
- -60.98%
- Verdict
- UNDERPRICED
- Comps
- 20 within 1.0 mi
Projected returns pro-forma
-3.0% appreciation · 3.41% rent growth · sell at horizon
- IRR
- 3.7%
- Equity multiple
- 1.14×
- Total profit
- $7,532
- Equity at exit
- $28,330
- IRR
- 13.6%
- Equity multiple
- 2.11×
- Total profit
- $58,839
- Equity at exit
- $16,428
Cash invested: $53,200 (down + closing). Projections, not guarantees.
Landlord ↔ Tenant lean methodology
- Overall (STATE)
- 18 Strongly Tenant-Friendly
- State California
- 18 Strongly Tenant-Friendly · D+13
- County
- — inherits STATE
- City
- — inherits STATE
ZIP-level market 92407
- Rents YoY
- 3.4%
- Active inventory
- 125
- Price-to-rent
- 6.6×
Monthly cashflow live
- Estimated rent
- $2,403 high interval (Pro) →
- Mortgage (P&I)
- −$996
- Tax est. 1.5%
- −$238 /mo · $2,850/yr
- Insurance
- −$79
- HOA
- −$0
- Vacancy / Maint / Mgmt
- −$505
- Net cashflow
- $585
Break-even live
UW: 25.0% down · 7.5% · 30yr · 1.5% tax · 5.0% vac · 8.0% maint · 8.0% mgmt
Financing live
Cash to close
- Down payment
- $47,500
- Closing costs
- $5,700
- Reserves months
- —
- Total cash needed
- —
Loan-product check · same deal, 3 products live
Conventional
25% down · 7.5% · 30yr
- Down + closing
- —
- Monthly P&I
- —
- Monthly cashflow
- —
- DSCR
- —
- Eligible?
- —
Personal DTI + credit; lowest rate.
DSCR
20% down · 8.5% · 30yr
- Down + closing
- —
- Monthly P&I
- —
- Monthly cashflow
- —
- DSCR
- —
- Eligible?
- —
No personal income docs; deal must DSCR.
Hard money
10% down · 12.0% · 12mo
- Down + closing
- —
- Monthly P&I
- —
- Monthly cashflow
- —
- DSCR
- —
- Eligible?
- —
Short-term bridge; refi at stabilization.
Rent comps 10 comps
| Address | Beds | Baths | Sqft | Rent | $/sqft | DOM | Units | Dist |
|---|---|---|---|---|---|---|---|---|
| 1380 W 48th St Unit 33 San Bernardino, CA | 2.0 | 1.5 | 1202 | $2,400 | $2.00 | 43d | 1 | 0.60mi |
| 1380 W 48th St #116 San Bernardino, CA | 2.0 | 1.5 | 1055 | $2,200 | $2.09 | 20d | 1 | 0.60mi |
| 5280 Little Mountain Dr San Bernardino, CA | 1.0–2.0 | 1.0–2.0 | 850 | $2,184 | $2.57 | 1d | 16 | 0.63mi |
| 4555 Acacia Ave San Bernardino, CA | 3.0 | 2.0 | 896 | $3,750 | $4.19 | 43d | 1 | 0.68mi |
| 1460 Kendall Dr #59 San Bernardino, CA | 3.0 | 2.0 | 1021 | $2,598 | $2.54 | 43d | 1 | 0.74mi |
| 1460 Kendall Dr San Bernardino, CA | 2.0 | 1.5–2.0 | 900 | $1,998 | $2.22 | 5d | 2 | 0.78mi |
| 1505 Northpark Blvd San Bernardino, CA | 1.0–2.0 | 1.5–2.0 | 870 | $2,125 | $2.44 | 5d | 1 | 0.97mi |
| 313 W 44th St San Bernardino, CA | 2.0 | 1.0 | 902 | $1,850 | $2.05 | 15d | 1 | 0.98mi |
| 425 Edgerton Dr San Bernardino, CA | 3.0 | 2.0 | 1566 | $3,900 | $2.49 | 5d | 1 | 1.15mi |
| 4378 Sepulveda Ave Apt 3 San Bernardino, CA | 2.0 | 1.5 | 930 | $1,895 | $2.04 | 43d | 1 | 1.35mi |
Listing history 18 events
-
2026-06-18days on market $190,000 Active 237 DOM
-
2026-06-17days on market $190,000 Active 236 DOM
-
2026-06-16days on market $190,000 Active 235 DOM
-
2026-06-15days on market $190,000 Active 234 DOM
-
2026-06-13days on market $190,000 Active 232 DOM
-
2026-06-09days on market $190,000 Active 228 DOM
-
2026-06-08days on market $190,000 Active 227 DOM
-
2026-06-07days on market $190,000 Active 226 DOM
-
2026-06-04days on market $190,000 Active 223 DOM
-
2026-06-03days on market $190,000 Active 222 DOM
-
2026-06-02days on market $190,000 Active 221 DOM
-
2026-06-01days on market $190,000 Active 220 DOM
-
2026-05-31days on market $190,000 Active 219 DOM
-
2025-11-18price $190,000 655-char remark
Show marketing remark (655 chars)
BUILDER’S SPECIAL - Unlock the potential of this flat, 9,000+ sqft infill lot located in a rapidly growing pocket of North San Bernardino. Zoned for single or multi-unit development, this site is perfect for a builder looking for their next project in a high-demand rental and resale market. The lot already includes existing slab/foundation areas, utilities alley access, and a layout that allows for efficient site planning. Whether you’re building ADUs, a duplex/triplex, or a modern single-family with additional income units — this is a rare blank canvas. Go Direct, DO NOT USE SHOWTIME! Contact Hannah Suri 951-238-9751
-
2025-11-09status Active 655-char remark
Show marketing remark (655 chars)
BUILDER’S SPECIAL - Unlock the potential of this flat, 9,000+ sqft infill lot located in a rapidly growing pocket of North San Bernardino. Zoned for single or multi-unit development, this site is perfect for a builder looking for their next project in a high-demand rental and resale market. The lot already includes existing slab/foundation areas, utilities alley access, and a layout that allows for efficient site planning. Whether you’re building ADUs, a duplex/triplex, or a modern single-family with additional income units — this is a rare blank canvas. Go Direct, DO NOT USE SHOWTIME! Contact Hannah Suri 951-238-9751
-
2025-11-03historical Active Under Contract 655-char remark
Show marketing remark (655 chars)
BUILDER’S SPECIAL - Unlock the potential of this flat, 9,000+ sqft infill lot located in a rapidly growing pocket of North San Bernardino. Zoned for single or multi-unit development, this site is perfect for a builder looking for their next project in a high-demand rental and resale market. The lot already includes existing slab/foundation areas, utilities alley access, and a layout that allows for efficient site planning. Whether you’re building ADUs, a duplex/triplex, or a modern single-family with additional income units — this is a rare blank canvas. Go Direct, DO NOT USE SHOWTIME! Contact Hannah Suri 951-238-9751
-
2025-10-24$200,000 Active 655-char remark
Show marketing remark (655 chars)
BUILDER’S SPECIAL - Unlock the potential of this flat, 9,000+ sqft infill lot located in a rapidly growing pocket of North San Bernardino. Zoned for single or multi-unit development, this site is perfect for a builder looking for their next project in a high-demand rental and resale market. The lot already includes existing slab/foundation areas, utilities alley access, and a layout that allows for efficient site planning. Whether you’re building ADUs, a duplex/triplex, or a modern single-family with additional income units — this is a rare blank canvas. Go Direct, DO NOT USE SHOWTIME! Contact Hannah Suri 951-238-9751
-
2025-10-23historical $200,000 655-char remark
Show marketing remark (655 chars)
BUILDER’S SPECIAL - Unlock the potential of this flat, 9,000+ sqft infill lot located in a rapidly growing pocket of North San Bernardino. Zoned for single or multi-unit development, this site is perfect for a builder looking for their next project in a high-demand rental and resale market. The lot already includes existing slab/foundation areas, utilities alley access, and a layout that allows for efficient site planning. Whether you’re building ADUs, a duplex/triplex, or a modern single-family with additional income units — this is a rare blank canvas. Go Direct, DO NOT USE SHOWTIME! Contact Hannah Suri 951-238-9751
ⓘ Source: listings_history table (triggers on properties + properties_extension) + one-shot
backfill from property_details.listing_events for pre-trigger history.
Climate risk First Street
- Flood 1/10 Low FEMA zone X (shaded) · 0% chance over 30 yrs
- Wildfire 8/10 Severe
- Heat 8/10 Severe 7 d/yr ≥102°F today · 20 d/yr by 30 yrs out
- Wind 1/10 Low
- Air quality 10/10 Extreme 26 unhealthy d/yr today · 33 by 30 yrs out
Nearby sold comps map
Loading sold comps map…
Walkable amenities ~0.75 mi
Loading nearby amenities…
Taxation est. · year 1
- Rental income
- $28,838
- − Mortgage interest
- −$10,643
- − Property taxes
- −$2,850
- − Insurance
- −$950
- − Repairs & maintenance
- −$2,307
- − Management
- −$2,307
- − Depreciation
- −$5,527
- Taxable income
- $4,254
- Est. tax owed @ 24.0%
- −$1,021
- After-tax cash flow
- $6,005/yr
For passive investors: Depreciation is non-cash, so a rental often shows a tax loss while cash-flowing — sheltering income. Rental losses are passive: they offset passive income freely, and up to $25,000/yr can offset ordinary (W-2) income if you actively participate and your MAGI is under $100k (phasing out to $0 by $150k); unused losses carry forward. On sale, claimed depreciation is recaptured at up to 25%, and gains may owe capital-gains tax (a 1031 exchange can defer both). Figures are a year-1 estimate at your 24.0% rate — not tax advice; consult a CPA.
Schools (NCES district)
- District
- San Bernardino City Unified
- NCES district ID
- 0634170
- Math proficiency
- 27% ▲ 1.00%
- Reading proficiency
- 40% ▬ 0.00%
- Median HH income
- $39,758
- Composite
- 30.8/100
- National rank
- #11385
- State rank
- #959 of 1400 in CA
Livability — San Bernardino
- Score
- 59/100
- State rank
- #661
- US rank
- #20479
Category grades
Schools grade is shown separately in the Schools card above.
Census & demographics
- County
- San Bernardino County · 2,030,291 people
- City population
- 255,614
- Metro
- Riverside-San Bernardino-Ontario, CA
- Population (ZIP)
- 71,711
- Household income
- $94,032
- Rent vs Own
- Severe rent burden
- 2040.0
Population outlook (San Bernardino County) Hauer SSP2
- Today (2025)
- 2,300,329 people
- By 2030
- 2,378,907 · +3.4%
- By 2040
- 2,523,137 · +9.7%
- By 2050
- 2,642,388 · +14.9%
- By 2075
- 2,880,769 · +25.2%
- By 2100
- 2,909,436 · +26.5%
Race, ethnicity, and origin ACS 2023
- Neighborhood character
- Majority Hispanic (65%)
- Race & ethnicity
- Hispanic / Latino 65% Two or more races 17% White 17% Black 10% Asian 4%
- Hispanic origin (detail)
- Mexican 56%
- Common ancestry
- Lithuanian 1% Italian 1% Iranian 1%
- Foreign-born
- 21% · Canada
- Languages at home
- 51% English-only · Spanish 44% Other Asian/Pacific 1% Tagalog/Filipino 1%
Political lean MEDSL · San Bernardino
- 2024 margin
- Toss-up / Even · D 47.5% · R 49.7% · Other 2.8%
- 2008→2024 swing
- -8.5pp toward R · 2008: 6.3pp · 2024: -2.1pp
- All cycles
- 2024: R+2.1 2020: D+10.7 2016: D+9.8 2012: D+5.4 2008: D+6.3
Not yet ingested
- Civics
- —
Market trends
- HPI YoY
- ▼ -254.51%
- Current HPI
- 449.2624
- Rent YoY
- ▲ 3.41%
- Metro
- Riverside-San Bernardino-Ontario, CA
- State GDP YoY
- ▲ 3.21%
- F500 in state
- 116
Industry mix (Fortune 500 HQ in CA)
| Industry | F500 HQs | Revenue |
|---|---|---|
| Technology | 27 | $1,492B |
|
||
| Financial Services | 3 | $174B |
|
||
| Retail | 3 | $44B |
|
||
| Insurance | 3 | $26B |
|
||
| Media / Entertainment | 2 | $115B |
|
||
| Pharmaceuticals / Biotech | 2 | $62B |
|
||
Price history
-5.0% since first listed5 events — show timeline
- 2025-11-18 Price Changed $190,000 CRMLS
- 2025-11-09 Relisted — CRMLS
- 2025-11-03 Contingent — CRMLS
- 2025-10-24 Listed $200,000 CRMLS
- 2025-10-23 Coming Soon $200,000 CRMLS
Property tax history
+5.9%/yrLatest (2025): $361 · +2.4% YoY. Source: county tax records.
Cash-flow waterfall
monthlySold comps — $/sqft
last 12 mo · ≤1 miLoading sold comps…