1801 SW 12th St · Lincoln, NE
Flood risk 1/10 · Minimal
- FEMA flood zone
- X (unshaded)
- Chance of flooding over 30 yrs
- 0.0%
- Est. flood insurance / yr
- $507 – $1,088
Fire risk 4/10 · Minor
- Est. fire insurance / yr
- $1,161 – $2,155
Heat risk 3/10 · Minor
- Hot days now (above 104°F)
- 7 days/yr
- Hot days in 30 yrs
- 16 days/yr
Wind risk 2/10 · Minimal
- Chance of severe wind over 30 yrs
- —
Air-quality risk 1/10 · Minimal
- Unhealthy air days now
- 0 days/yr
- Unhealthy air days in 30 yrs
- 0 days/yr
Risk factors via First Street. Map © Google.
Why this score? — see what drove the B grade
The composite is a weighted blend of 9 inputs, each scored 0–100. Each bar is that input's sub-score; the figure is the points it added to the 100-point composite (weight × sub-score).
- Cash flow +30.0/30.0
- 1% rule +10.0/10.0
- DSCR +10.0/10.0
- ARV discount +7.5/15.0
- Schools +4.4/10.0
- Livability +4.2/5.0
- Rent growth +3.1/5.0
- Condition / age +2.2/5.0
- Appreciation +0.0/10.0
$45,000
🖨 Deal sheet (PDF) 📄 Offer letter ✓ Due diligence
Listing remarks
??Investment Opportunity!?? Are you looking for a great investment opportunity in Sw Lincoln? Look no further! This Doublewide 3 Bed/2Bath mobile home is a great way to get your feet wet with either renting or flipping. Just off the highway, this home sits on a spacious corner lot in the beautiful Harbour West Mobile Home Park. Home has a great roof, updated furnace, water heater and an outdoor shed with electricity! Lot rent is $850/month. Contact for private showing!
Key facts
- Spacious corner lot
- Updated furnace
- Built 1977
Tags
Neighborhood map
What this means for you Summary
Snapshot
- This is a 3-bed/2.0-bath other listed at $45k. Condition is rated fair.
Deal economics
- At list price, monthly cash flow is $955 ($11k/yr) — positive.
- The deal already cash-flows at list — no discount required.
- Meets the 1% rule at list price ($2k rent vs $45k).
- Recommended offer: $44k (3.0% below list) — sets the bar for market timing.
- Cap rate 31.8% vs local median 3.0% in Lincoln — top-decile yield for the area; either an underpriced asset or a hidden risk that comps aren't pricing in. Stress-test before assuming the spread holds.
Location & tenants
- Location reads 85/100 on livability (#5 in NE, #545 nationally) — a professional / high-income tenant draw. Strengths: amenities A+, cost of living A+, housing A+; Watch: crime D+.
- Lincoln Public Schools (urban): math 50% / reading 53% proficiency, ranked #59 of 111 in NE (top 53%) — acceptable for families but not a draw, mixed tenant base, ~2y average lease.
- Zoned schools: Roper Elementary School (math 46% / reading 44%, grade D-, #287 of 502 statewide, top 57%, 863 students, 58% FRL); Park Middle School (math 37% / reading 37%, grade F, #99 of 128 statewide, top 79%, 834 students, 68% FRL); Lincoln High School (math 38% / reading 41%, grade F, #184 of 261 statewide, top 76%, 2,196 students, 59% FRL) — zoned schools average 62% FRL vs 37% district-wide (25 pts higher); higher-poverty schools than district average — tighter screening recommended.
- Market conditions: Rents rising (+2.4%/yr); 91 active listings in the ZIP; 8 comparable units currently listed for rent nearby; rentals at typical pace (median 15d on market — plan ~3-4 weeks tenant-placement turnaround); solid renter incomes; 1,940 units permitted in Lancaster County in 2024 (895 in 5+ unit buildings).
Forward outlook
- Local home prices are declining (-3.0%/yr); year-one equity from $311 of loan paydown is wiped out by about $1k of value loss. Plan a longer hold.
- Lancaster County population projected at +37% by 2050 — long-run rental-demand tailwind backs the buy-and-hold thesis.
- At projected returns (-3.0% appreciation + 2.4% rent growth), your $13k cash investment doubles in ~2 years — after that, you're playing with house money.
Negotiation context
- It's been on market 34 days — a 3% lower offer ($44k) is reasonable based on typical stale-listing flexibility.
Questions for the listing agent
- It's been on market 34 days. Have you received any prior offers? Is the seller open to a 3% concession, seller financing, or rate buy-down credit?
- Have any recent inspections been done? Can we get a copy of the seller's disclosures and any deferred-maintenance estimates?
- Built in 1977 — when were the roof, HVAC, electrical panel, plumbing, and water heater last replaced?
- Is there a deadline driving the sale (1031 exchange, divorce, estate, relocation)? That informs how much negotiation room exists.
- Schools are A-rated — typically a magnet for longer-tenancy family renters. What's the average tenant stay here, and is there a school-zone premium baked into asking?
- Crime grade is D in this area — have there been break-ins, vandalism, or insurance claims at this property in the last 3 years? What carrier currently insures it and at what premium?
- What's the average days-on-market for RENTAL listings here right now (not sales)? A rising rental-DOM trend means longer vacancies and softer asking-rent achievability than the comps imply.
- What's the recent tenant-quality profile in this submarket — average credit score on applications, eviction rate, late-payment / NSF rate, and stable-employment percentage? A property-management company in the area should have these aggregated.
- How much new for-sale + rental construction is in the pipeline within 1–3 miles? Heavy new supply typically softens prices + rents 12–24 months out; constrained supply supports both.
Investment metrics
- 1% rule
- 3.56% ✓
- Cap rate
- 31.76%
- Cash-on-cash
- 90.95%
- DSCR
- 5.05
- GRM
- 2.3
CMA / ARV
No comps found within radius.
Projected returns pro-forma
-3.0% appreciation · 2.38% rent growth · sell at horizon
- IRR
- 91.0%
- Equity multiple
- 5.17×
- Total profit
- $52,564
- Equity at exit
- $6,710
- IRR
- 93.8%
- Equity multiple
- 10.54×
- Total profit
- $120,167
- Equity at exit
- $3,891
Cash invested: $12,600 (down + closing). Projections, not guarantees.
Landlord ↔ Tenant lean methodology
- Overall (STATE)
- 83 Strongly Landlord-Friendly
- State Nebraska
- 83 Strongly Landlord-Friendly · R+13
- County
- — inherits STATE
- City
- — inherits STATE
ZIP-level market 68522
- Home prices YoY
- -31.6%
- Rents YoY
- 2.4%
- Active inventory
- 91
- Price-to-rent
- 2.3×
Monthly cashflow live
- Estimated rent
- $1,603 high interval (Pro) →
- Mortgage (P&I)
- −$236
- Tax est. 1.5%
- −$56 /mo · $675/yr
- Insurance
- −$19
- HOA
- −$0
- Vacancy / Maint / Mgmt
- −$337
- Net cashflow
- $955
Break-even live
Sensitivity live
| Price | -10% $986 | -5% $971 | +0% $955 | +5% $939 | +10% $924 |
|---|---|---|---|---|---|
| Rent | -10% $828 | -5% $892 | +0% $955 | +5% $1,018 | +10% $1,082 |
| Rate | -1.0pp $978 | -0.5pp $966 | base $955 | +0.5pp $943 | +1.0pp $931 |
UW: 25.0% down · 7.5% · 30yr · 1.5% tax · 5.0% vac · 8.0% maint · 8.0% mgmt
Financing live
Cash to close
- Down payment
- $11,250
- Closing costs
- $1,350
- Reserves months
- —
- Total cash needed
- —
Loan-product check · same deal, 3 products live
Conventional
25% down · 7.5% · 30yr
- Down + closing
- —
- Monthly P&I
- —
- Monthly cashflow
- —
- DSCR
- —
- Eligible?
- —
Personal DTI + credit; lowest rate.
DSCR
20% down · 8.5% · 30yr
- Down + closing
- —
- Monthly P&I
- —
- Monthly cashflow
- —
- DSCR
- —
- Eligible?
- —
No personal income docs; deal must DSCR.
Hard money
10% down · 12.0% · 12mo
- Down + closing
- —
- Monthly P&I
- —
- Monthly cashflow
- —
- DSCR
- —
- Eligible?
- —
Short-term bridge; refi at stabilization.
Rent comps 8 comps
| Address | Beds | Baths | Sqft | Rent | $/sqft | DOM | Units | Dist |
|---|---|---|---|---|---|---|---|---|
| 1309 W Plum St #73 Lincoln, NE | 3.0 | 2.0 | 1088 | $1,679 | $1.54 | 45d | 1 | 0.20mi |
| 1101 W C St Lincoln, NE | 1.0–3.0 | 1.0 | 1045 | $1,385 | $1.33 | 15d | 9 | 0.42mi |
| 705 Folsom Ln Lincoln, NE | 1.0–3.0 | 1.0–2.5 | 1173 | $2,105 | $1.79 | 15d | 16 | 0.47mi |
| 760 W C St Lincoln, NE | 1.0–3.0 | 1.0–2.0 | 1018 | $1,419 | $1.39 | 15d | 8 | 0.63mi |
| 701 W C St Lincoln, NE | 2.0 | 1.0 | 1554 | $1,650 | $1.06 | 22d | 1 | 0.68mi |
| 2960 S Coddington Ave Lincoln, NE | 1.0–2.0 | 1.0 | 798 | $1,419 | $1.78 | 15d | 10 | 0.89mi |
| 1170 SW 27th St Lincoln, NE | 2.0–3.0 | 2.0 | 1022 | $1,349 | $1.32 | 15d | 12 | 1.02mi |
| 1708 S 6th St Unit 2 Lincoln, NE | 4.0 | 2.0 | 1444 | $1,800 | $1.25 | 15d | 1 | 1.48mi |
Listing history 12 events
-
2026-06-15days on market $45,000 Active 34 DOM
-
2026-06-14days on market $45,000 Active 32 DOM
-
2026-06-10days on market $45,000 Active 29 DOM
-
2026-06-09days on market $45,000 Active 28 DOM
-
2026-06-08days on market $45,000 Active 27 DOM
-
2026-06-07days on market $45,000 Active 26 DOM
-
2026-06-05days on market $45,000 Active 23 DOM
-
2026-06-03days on market $45,000 Active 22 DOM
-
2026-06-02days on market $45,000 Active 21 DOM
-
2026-05-31days on market $45,000 Active 19 DOM
-
2026-05-30days on market $45,000 Active 18 DOM
-
2026-05-12$45,000 Active 473-char remark
ⓘ Source: listings_history table (triggers on properties + properties_extension) + one-shot
backfill from property_details.listing_events for pre-trigger history.
Climate risk First Street
- Flood 1/10 Low FEMA zone X (unshaded) · 0% chance over 30 yrs
- Wildfire 4/10 Moderate
- Heat 3/10 Moderate 7 d/yr ≥104°F today · 16 d/yr by 30 yrs out
- Wind 2/10 Low
- Air quality 1/10 Low 0 unhealthy d/yr today · 0 by 30 yrs out
Nearby sold comps map
Loading sold comps map…
Walkable amenities ~0.75 mi
Loading nearby amenities…
Taxation est. · year 1
- Rental income
- $19,230
- − Mortgage interest
- −$2,521
- − Property taxes
- −$675
- − Insurance
- −$225
- − Repairs & maintenance
- −$1,538
- − Management
- −$1,538
- − Depreciation
- −$1,309
- Taxable income
- $11,424
- Est. tax owed @ 24.0%
- −$2,742
- After-tax cash flow
- $8,719/yr
For passive investors: Depreciation is non-cash, so a rental often shows a tax loss while cash-flowing — sheltering income. Rental losses are passive: they offset passive income freely, and up to $25,000/yr can offset ordinary (W-2) income if you actively participate and your MAGI is under $100k (phasing out to $0 by $150k); unused losses carry forward. On sale, claimed depreciation is recaptured at up to 25%, and gains may owe capital-gains tax (a 1031 exchange can defer both). Figures are a year-1 estimate at your 24.0% rate — not tax advice; consult a CPA.
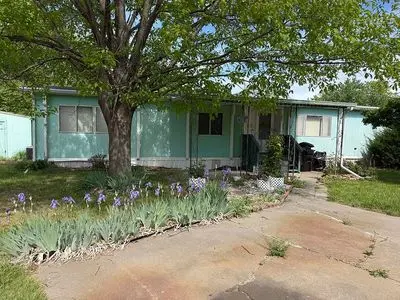
Condition & rehab AI · 1 photo
This doublewide mobile home requires moderate renovations to improve its curb appeal and interior condition, enhancing its resale and rental value.
Repairs flagged
- Major exterior siding — Significant wear and tear
- Major landscaping — Overgrown and unkempt
- Major flooring — Worn carpet in need of replacement
Value-add opportunities
- Both landscaping — Improves curb appeal and rental value
- Both exterior siding — Enhances home's appearance and value
- Both flooring — Fresh carpet improves comfort and rental appeal
Renovation cost estimate screening
| Repair item | Severity | Est. cost |
|---|---|---|
| exterior siding · Significant wear and tear | Major | $15,000–50,000 |
| landscaping · Overgrown and unkempt | Major | $15,000–50,000 |
| flooring · Worn carpet in need of replacement | Major | $15,000–50,000 |
| Total estimated repair cost · 3 items | $45,000–150,000 |
Value-add ROI direction
- Both landscaping — Improves curb appeal and rental value ↑
- Both exterior siding — Enhances home's appearance and value ↑
- Both flooring — Fresh carpet improves comfort and rental appeal ↑
ⓘ Cost ranges are severity-bucket heuristics (US national rule-of-thumb). Get contractor quotes + a written scope before underwriting a rehab budget.
Schools (NCES district)
- District
- Lincoln Public Schools
- NCES district ID
- 3172840
- Math proficiency
- 50% ▼ -6.00%
- Reading proficiency
- 53% ▼ -3.00%
- Median HH income
- $50,273
- Composite
- 44.05/100
- National rank
- #2880
- State rank
- #59 of 111 in NE
Livability — Lincoln
- Score
- 85/100
- State rank
- #5
- US rank
- #545
Category grades
Schools grade is shown separately in the Schools card above.
Census & demographics
- Census place
- Lincoln, NE
- County
- Lancaster County · 291,509 people
- City population
- 291,509
- Metro
- Lincoln, NE
- Population (ZIP)
- 14,836
- Household income
- $77,597
- Rent vs Own
- Severe rent burden
- 366.0
Population outlook (Lancaster County) Hauer SSP2
- Today (2025)
- 352,806 people
- By 2030
- 377,899 · +7.1%
- By 2040
- 428,582 · +21.5%
- By 2050
- 483,103 · +36.9%
- By 2075
- 632,390 · +79.2%
- By 2100
- 759,513 · +115.3%
Race, ethnicity, and origin ACS 2023
- Neighborhood character
- Predominantly White (71%)
- Race & ethnicity
- White 71% Hispanic / Latino 9% Two or more races 8% Black 8% Asian 3%
- Hispanic origin (detail)
- Mexican 7%
- Common ancestry
- Arab 4% Italian 2% Romanian 2%
- Foreign-born
- 11% · Canada, Philippines, Vietnam
- Languages at home
- 85% English-only · Spanish 5% Other Indo-European 4% Other Asian/Pacific 2%
Political lean MEDSL · Lancaster
- 2024 margin
- Toss-up / Even · D 51.4% · R 47.1% · Other 1.5%
- 2008→2024 swing
- -0.7pp no change · 2008: 5.0pp · 2024: 4.3pp
- All cycles
- 2024: D+4.3 2020: D+7.8 2016: D+0.1 2012: R+1.0 2008: D+5.0
Not yet ingested
- Civics
- —
Market trends
- HPI YoY
- ▼ -114.49%
- Current HPI
- 247.8809
- Rent YoY
- ▲ 2.38%
- Metro
- Lincoln, NE
- State GDP YoY
- ▲ 0.68%
- F500 in state
- 2
Industry mix (Fortune 500 HQ in NE)
| Industry | F500 HQs | Revenue |
|---|---|---|
| Conglomerate | 1 | $371B |
|
||
Cash-flow waterfall
monthlySold comps — $/sqft
last 12 mo · ≤1 miLoading sold comps…