5105 April Ln · Pace, FL
Flood risk 1/10 · Minimal
- FEMA flood zone
- X (unshaded)
- Chance of flooding over 30 yrs
- 0.0%
- Est. flood insurance / yr
- $507 – $1,088
Fire risk 4/10 · Minor
- Est. fire insurance / yr
- $947 – $1,759
Heat risk 9/10 · Severe
- Hot days now (above 105°F)
- 6 days/yr
- Hot days in 30 yrs
- 18 days/yr
Wind risk 9/10 · Severe
- Chance of severe wind over 30 yrs
- 99.0%
Air-quality risk 1/10 · Minimal
- Unhealthy air days now
- 0 days/yr
- Unhealthy air days in 30 yrs
- 0 days/yr
Risk factors via First Street. Map © Google.
Why this score? — see what drove the D grade
The composite is a weighted blend of 9 inputs, each scored 0–100. Each bar is that input's sub-score; the figure is the points it added to the 100-point composite (weight × sub-score).
- Cash flow +19.9/30.0
- DSCR +6.3/10.0
- Schools +5.3/10.0
- 1% rule +4.0/10.0
- Livability +3.5/5.0
- Rent growth +3.2/5.0
- Condition / age +2.5/5.0
- ARV discount +0.0/15.0
- Appreciation +0.0/10.0
$236,000
🖨 Deal sheet 📄 Offer letter ✓ Due diligence
Listing remarks MLS
BEAUTIFUL PROPERTY IN ONE OF THE MOST POPULAR AREAS OF PACE. MOBILE HOME JUST BEEN MOVED OFF THE PROPERTY, READY FOR YOUR NEW HOME. GREAT AREA, CLOSE TO EVERYTHING.
Key facts
- Solid wood cabinetry
- Lighted ceiling fans
- Large island
Tags
Property features AI
Finance
- Other: Homestead exemption indicated
- HOA & community: No homeowners association
Exterior
- Parking: One covered parking space; Carport at the front entrance
- Utilities: Circuit breaker electric; Septic tank
- Home design: Mobile/Manufactured home (modular); One story; Resale property; Paved, county-maintained road access
- Construction: Shingle roof; Pillar/post/pier foundation
- Exterior features: Rain gutters; Deck with screened area; Privacy, chain link and other fencing; Located on a cul-de-sac
Interior
- Kitchen: Kitchen island; Laminate counters; Built-in microwave; Desk area
- Bedrooms: Bedroom on the first floor (approx. 11.5' x 9.3'); Bedroom on the first floor (approx. 10.6' x 13.1')
- Flooring: Vinyl flooring; Carpet
- Bathrooms: Two full bathrooms
- Heating & cooling: Central heating; Central air conditioning; Ceiling fans; Whole house fan
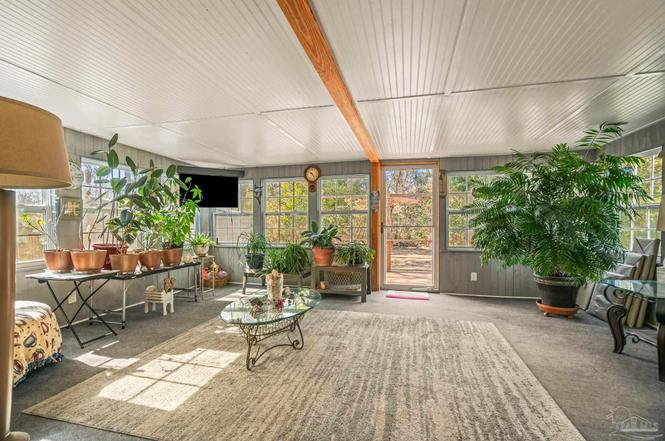
- Interior features: Storage; Baseboards; Bookcases; Ceiling fans; Chair rail; Crown molding; High-speed internet; Vaulted ceilings; Sun room; Blinds, drapes and drapery rods
- Laundry & utility: Washer and dryer included; Inside laundry with washer/dryer hookups; Electric water heater
Neighborhood map
What this means for you Summary
Snapshot
- This is a 3-bed/2.0-bath manufactured listed at $236k.
Deal economics
- At list price, monthly cash flow is $285 ($3k/yr) — positive.
- The deal already cash-flows at list — no discount required.
- To meet the 1% rule (rent ≥ 1% of price), the offer needs to be $212k (10.3% below list).
- Recommended offer: $212k (10.3% below list) — sets the bar for 1% rule.
- Cap rate 7.7% vs local median 4.5% in Pace — top-decile yield for the area; either an underpriced asset or a hidden risk that comps aren't pricing in. Stress-test before assuming the spread holds.
Location & tenants
- Location reads 69/100 on livability (#475 in FL) — a middle-class / working-renter tenant base. Strengths: cost of living A+, housing A+, schools B+; Watch: amenities F, commute F, health & safety F.
- Santa Rosa (suburban): math 63% / reading 60% proficiency, ranked #8 of 73 in FL (top 11%) — acceptable for families but not a draw, mixed tenant base, ~2y average lease.
- Market conditions: Rents rising (+2.7%/yr); 665 active listings in the ZIP; 5 comparable units currently listed for rent nearby; rentals at typical pace (median 23d on market — plan ~3-4 weeks tenant-placement turnaround); solid renter incomes; 1,983 units permitted in Santa Rosa County in 2024 (128 in 5+ unit buildings).
Forward outlook
- Local home prices are declining (-3.0%/yr); year-one equity from $2k of loan paydown is wiped out by about $7k of value loss. Plan a longer hold.
- Santa Rosa County population projected at +31% by 2050 — long-run rental-demand tailwind backs the buy-and-hold thesis.
Negotiation context
- It's been on market 101 days — a 9% lower offer ($215k) is reasonable based on typical stale-listing flexibility.
- 6 sale attempts since 26y ago with the ask held roughly flat each time — persistent listings suggest the price (not the market) is what's stuck; bring a comps-based counter.
- Current owner paid $18k; list at $236k implies a 1211% gain — meaningful room to come down on a strong offer.
Risks & watch-outs
- Climate carrying-cost: severe wind risk, 99% chance of damaging wind over 30y; extreme-heat days projected 6→18/yr by 2055 (HVAC capex compounding) — expect insurance premiums to compound above CPI over the hold.
Questions for the listing agent
- It's been on market 101 days. Have you received any prior offers? Is the seller open to a 10% concession, seller financing, or rate buy-down credit?
- Why hasn't it sold? Are there any deal-killer items the seller is aware of (foundation, flood, title, zoning, code violations)?
- Is there a deadline driving the sale (1031 exchange, divorce, estate, relocation)? That informs how much negotiation room exists.
- Schools are B-rated — typically a magnet for longer-tenancy family renters. What's the average tenant stay here, and is there a school-zone premium baked into asking?
- The area grade is low — what's the realistic commute time and amenity access for the typical tenant pool here? Any planned neighborhood developments (good or bad) we should know about?
- What's the average days-on-market for RENTAL listings here right now (not sales)? A rising rental-DOM trend means longer vacancies and softer asking-rent achievability than the comps imply.
- What's the recent tenant-quality profile in this submarket — average credit score on applications, eviction rate, late-payment / NSF rate, and stable-employment percentage? A property-management company in the area should have these aggregated.
- How much new for-sale + rental construction is in the pipeline within 1–3 miles? Heavy new supply typically softens prices + rents 12–24 months out; constrained supply supports both.
Investment metrics
- 1% rule
- 0.90% ✗
- Cap rate
- 7.74%
- Cash-on-cash
- 5.18%
- DSCR
- 1.23
- GRM
- 9.3
CMA / ARV
- ARV (on-the-fly)
- $163,072
- Comps found
- 4
Show comp detail 4 sales within ~0.75 mi
| Address | Dist | Beds/Ba | Sqft | Sold | Price | $/sf | Match |
|---|---|---|---|---|---|---|---|
| 5105 April Ln | 0.00mi | 3/2.0 | 1,568 (0%) | 0mo | $233,000 | $149 | 100 |
| 4017 Scottsdale Ave | 0.12mi | 3/2.0 | 1,714 (+9%) | 6mo | $178,000 | $104 | 74 |
| 4065 Scottsdale Ave | 0.23mi | 3/2.0 | 1,455 (-7%) | 14mo | $94,500 | $65 | 65 |
| 4060 Windsor Ln | 0.20mi | 3/2.0 | 1,782 (+14%) | 12mo | $142,500 | $80 | 58 |
Match score weights: distance 35% · size 25% · config 20% · recency 20%. Top-matched comps best support the ARV.
Projected returns pro-forma
-3.0% appreciation · 2.72% rent growth · sell at horizon
- IRR
- -8.6%
- Equity multiple
- 0.69×
- Total profit
- $-20,779
- Equity at exit
- $35,188
- IRR
- 0.5%
- Equity multiple
- 1.04×
- Total profit
- $2,405
- Equity at exit
- $20,405
Cash invested: $66,080 (down + closing). Projections, not guarantees.
Landlord ↔ Tenant lean methodology
- Overall (STATE)
- 87 Strongly Landlord-Friendly
- State Florida
- 87 Strongly Landlord-Friendly · R+3
- County
- — inherits STATE
- City
- — inherits STATE
ZIP-level market 32571
- Home prices YoY
- -17.7%
- Rents YoY
- 2.7%
- Active inventory
- 665
- Price-to-rent
- 9.3×
Monthly cashflow live
- Estimated rent
- $2,117 high interval (Pro) →
- Mortgage (P&I)
- −$1,238
- Tax from tax record
- −$51 /mo · $610/yr
- Insurance
- −$98
- HOA
- −$0
- Vacancy / Maint / Mgmt
- −$445
- Net cashflow
- $285
Break-even live
UW: 25.0% down · 7.5% · 30yr · 1.5% tax · 5.0% vac · 8.0% maint · 8.0% mgmt
Financing live
Cash to close
- Down payment
- $59,000
- Closing costs
- $7,080
- Reserves months
- —
- Total cash needed
- —
Loan-product check · same deal, 3 products live
Conventional
25% down · 7.5% · 30yr
- Down + closing
- —
- Monthly P&I
- —
- Monthly cashflow
- —
- DSCR
- —
- Eligible?
- —
Personal DTI + credit; lowest rate.
DSCR
20% down · 8.5% · 30yr
- Down + closing
- —
- Monthly P&I
- —
- Monthly cashflow
- —
- DSCR
- —
- Eligible?
- —
No personal income docs; deal must DSCR.
Hard money
10% down · 12.0% · 12mo
- Down + closing
- —
- Monthly P&I
- —
- Monthly cashflow
- —
- DSCR
- —
- Eligible?
- —
Short-term bridge; refi at stabilization.
Rent comps 5 comps
| Address | Beds | Baths | Sqft | Rent | $/sqft | DOM | Units | Dist |
|---|---|---|---|---|---|---|---|---|
| 4203 Frasier Ln Milton, FL | 4.0 | 2.0 | 1755 | $2,195 | $1.25 | 23d | 1 | 0.86mi |
| 5097 Conservation Cir Milton, FL | 3.0–5.0 | 2.0–3.0 | 2080 | $2,100 | $1.01 | 23d | 1 | 1.08mi |
| 3614 Hawks Landing Cir Milton, FL | 4.0 | 2.0 | 1953 | $2,100 | $1.08 | 23d | 1 | 1.16mi |
| 4742 Spencer Oaks Blvd Milton, FL | 4.0 | 2.0 | 1783 | $1,925 | $1.08 | 23d | 1 | 1.17mi |
| 4606 Southern Pl Milton, FL | 3.0 | 1.5 | 1431 | $1,500 | $1.05 | 13d | 1 | 1.45mi |
Listing history 17 events
-
2026-05-16status Pending
-
2026-04-22historical Contingent
-
2026-03-15price $236,000
-
2026-03-05price $238,000
-
2026-02-04$240,000 Active
-
2013-01-16historical
-
2012-10-19$69,900
-
2009-07-02soldstatus $18,000 164-char remark
Show marketing remark (164 chars)
BEAUTIFUL PROPERTY IN ONE OF THE MOST POPULAR AREAS OF PACE. MOBILE HOME JUST BEEN MOVED OFF THE PROPERTY, READY FOR YOUR NEW HOME. GREAT AREA, CLOSE TO EVERYTHING.
-
2009-03-20historical
-
2009-03-16$19,995 164-char remark
Show marketing remark (164 chars)
BEAUTIFUL PROPERTY IN ONE OF THE MOST POPULAR AREAS OF PACE. MOBILE HOME JUST BEEN MOVED OFF THE PROPERTY, READY FOR YOUR NEW HOME. GREAT AREA, CLOSE TO EVERYTHING.
-
2008-10-15$49,900
-
2004-03-08soldstatus $26,500
-
2001-11-06soldstatus $13,250
-
2001-07-17$14,900
-
2001-05-27historical
-
2000-11-27$19,900
-
1997-12-17soldstatus $19,500
ⓘ Source: listings_history table (triggers on properties + properties_extension) + one-shot
backfill from property_details.listing_events for pre-trigger history.
Tax reassessment forecast FL · Resets to sale price
- Current annual tax
- $610 · $51/mo
- Projected year-2 tax
- $1,959 · $163/mo
- Expected delta
- +$1,349/yr (+$112/mo · 221.1%)
ⓘ Screening estimate from a state-policy table — verify with the county assessor before closing.
Climate risk First Street
- Flood 1/10 Low FEMA zone X (unshaded) · 0% chance over 30 yrs
- Wildfire 4/10 Moderate
- Heat 9/10 Extreme 6 d/yr ≥105°F today · 18 d/yr by 30 yrs out
- Wind 9/10 Extreme 99% chance of damaging wind over 30 yrs
- Air quality 1/10 Low 0 unhealthy d/yr today · 0 by 30 yrs out
Nearby sold comps map
Loading sold comps map…
Walkable amenities ~0.75 mi
Loading nearby amenities…
Taxation est. · year 1
- Rental income
- $25,400
- − Mortgage interest
- −$13,220
- − Property taxes
- −$610
- − Insurance
- −$1,180
- − Repairs & maintenance
- −$2,032
- − Management
- −$2,032
- − Depreciation
- −$6,865
- Taxable loss
- −$539
- Est. tax savings @ 24.0%
- +$129
- After-tax cash flow
- $3,554/yr
For passive investors: Depreciation is non-cash, so a rental often shows a tax loss while cash-flowing — sheltering income. Rental losses are passive: they offset passive income freely, and up to $25,000/yr can offset ordinary (W-2) income if you actively participate and your MAGI is under $100k (phasing out to $0 by $150k); unused losses carry forward. On sale, claimed depreciation is recaptured at up to 25%, and gains may owe capital-gains tax (a 1031 exchange can defer both). Figures are a year-1 estimate at your 24.0% rate — not tax advice; consult a CPA.
Schools (NCES district)
- District
- Santa Rosa
- NCES district ID
- 1201650
- Math proficiency
- 63% ▼ -6.00%
- Reading proficiency
- 60% ▼ -5.00%
- Median HH income
- $58,161
- Composite
- 53.12/100
- National rank
- #1511
- State rank
- #8 of 73 in FL
Livability — Pace
- Score
- 69/100
- State rank
- #475
- US rank
- #8593
Category grades
Schools grade is shown separately in the Schools card above.
Census & demographics
- Census place
- Pace, FL
- County
- Santa Rosa County · 194,764 people
- City population
- 42,171
- Metro
- Pensacola-Ferry Pass-Brent, FL
- Population (ZIP)
- 42,171
- Household income
- $87,617
- Rent vs Own
- Severe rent burden
- 301.0
Population outlook (Santa Rosa County) Hauer SSP2
- Today (2025)
- 195,978 people
- By 2030
- 209,782 · +7.0%
- By 2040
- 235,293 · +20.1%
- By 2050
- 256,408 · +30.8%
- By 2075
- 298,074 · +52.1%
- By 2100
- 303,216 · +54.7%
Race, ethnicity, and origin ACS 2023
- Neighborhood character
- Predominantly White (80%)
- Race & ethnicity
- White 80% Two or more races 9% Hispanic / Latino 6% Black 4% Asian 2%
- Hispanic origin (detail)
- Mexican 3%
- Common ancestry
- Lithuanian 4% Italian 3% Slovak 2%
- Foreign-born
- 6% · Canada, South Korea
- Languages at home
- 93% English-only · Spanish 2% Other Indo-European 1% Russian/Polish/Slavic 1%
Political lean MEDSL · Santa Rosa
- 2024 margin
- Solid R (+51.0) · D 24.1% · R 75.0%
- 2008→2024 swing
- -3.0pp toward R · 2008: -47.9pp · 2024: -51.0pp
- All cycles
- 2024: R+51.0 2020: R+46.5 2016: R+53.5 2012: R+52.6 2008: R+47.9
Not yet ingested
- Civics
- —
Market trends
- HPI YoY
- ▼ -62.39%
- Current HPI
- 290.2953
- Rent YoY
- ▲ 2.72%
- Metro
- Pensacola-Ferry Pass-Brent, FL
- State GDP YoY
- ▲ 3.28%
- F500 in state
- 36
Industry mix (Fortune 500 HQ in FL)
| Industry | F500 HQs | Revenue |
|---|---|---|
| Industrial Technology | 2 | $29B |
|
||
| Insurance | 2 | $17B |
|
||
| Retail | 1 | $60B |
|
||
| Technology Distribution | 1 | $58B |
|
||
| Homebuilding | 1 | $35B |
|
||
| Technology Manufacturing | 1 | $35B |
|
||
Price history
+1110.3% since first listed17 events — show timeline
- 2026-05-16 Pending — PARMLS
- 2026-04-22 Contingent — PARMLS
- 2026-03-15 Price Changed $236,000 PARMLS
- 2026-03-05 Price Changed $238,000 PARMLS
- 2026-02-04 Listed $240,000 PARMLS
- 2013-01-16 Listing Removed — PARMLS
- 2012-10-19 Listed $69,900 PARMLS
- 2009-07-02 Sold (MLS) $18,000 PARMLS
- 2009-03-20 Listing Removed — PARMLS
- 2009-03-16 Listed $19,995 PARMLS
- 2008-10-15 Listed $49,900 PARMLS
- 2004-03-08 Sold (Public Records) $26,500 Public Records
- 2001-11-06 Sold (MLS) $13,250 PARMLS
- 2001-07-17 Listed $14,900 PARMLS
- 2001-05-27 Listing Removed — PARMLS
- 2000-11-27 Listed $19,900 PARMLS
- 1997-12-17 Sold (Public Records) $19,500 Public Records
Property tax history
-3.4%/yrLatest (2025): $610 · +1.9% YoY. Source: county tax records.
Cash-flow waterfall
monthlySold comps — $/sqft
last 12 mo · ≤1 miLoading sold comps…