 5-Plex
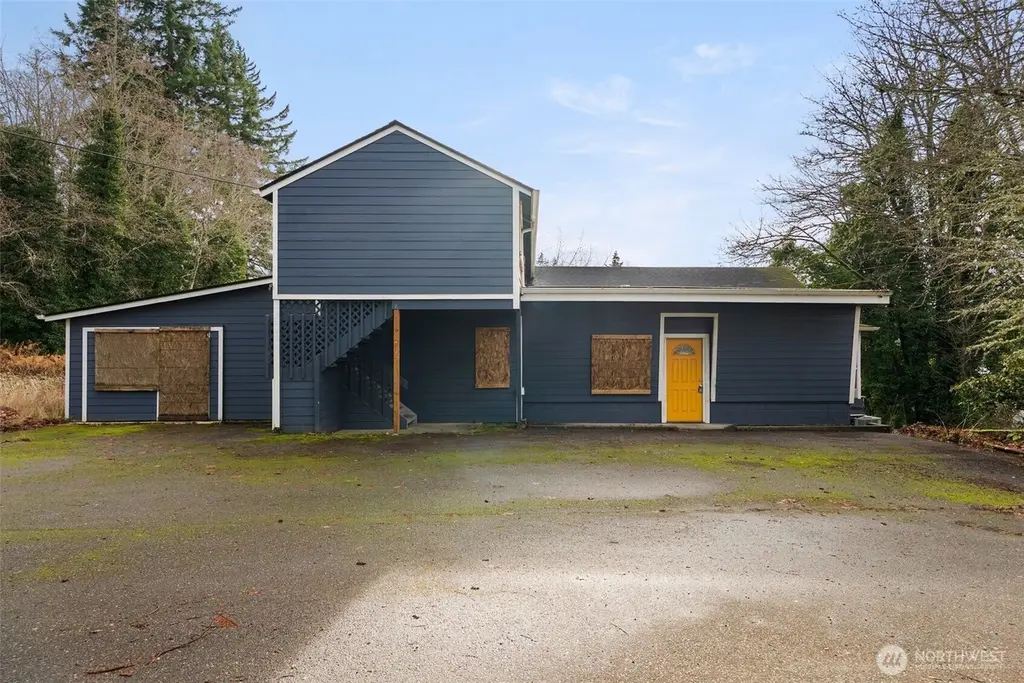
6323 Kitsap Way · Bremerton, WA
Flood risk No data
- FEMA flood zone
- —
- Chance of flooding over 30 yrs
- —
- Est. flood insurance / yr
- —
Fire risk No data
- Est. fire insurance / yr
- —
Heat risk No data
- Hot days now (above threshold)
- —
- Hot days in 30 yrs
- —
Wind risk No data
- Chance of severe wind over 30 yrs
- —
Air-quality risk No data
- Unhealthy air days now
- —
- Unhealthy air days in 30 yrs
- —
Risk factors via First Street. Map © Google.
Why this score? — see what drove the B+ grade
The composite is a weighted blend of 9 inputs, each scored 0–100. Each bar is that input's sub-score; the figure is the points it added to the 100-point composite (weight × sub-score).
- Cash flow +30.0/30.0
- ARV discount +15.0/15.0
- 1% rule +10.0/10.0
- DSCR +10.0/10.0
- Livability +4.3/5.0
- Schools +3.9/10.0
- Rent growth +2.6/5.0
- Condition / age +2.2/5.0
- Appreciation +0.0/10.0
$495,000
🖨 Deal sheet 📄 Offer letter ✓ Due diligence
Multi-family units
County records classify this as Multi-Family (5+ Unit). Listing-text estimate: 5 units. confirmed
5+ unit building — per-unit beds/baths from public records are typically unavailable; the breakdown below (if shown) is an estimate from the listing text.
Listing remarks
Remodeled 5-plex in the heart of Bremerton. Previous owner updated this property beautifully, but did not obtain the necessary permits from the City of Bremerton. General Commercial zoning allows for the potential to use for multi-family, retail, office or mixed use. Lot size is over half an acre so might be possible to subdivide. Owner financing may be available. * * Buyer to verify any and all information on what is needed to obtain permits from the City of Bremerton. * *
Key facts
- Remodeled 5-plex
- 0.69 acre lot
- 10 parking spots
Tags
Neighborhood map
What this means for you Summary
Snapshot
- This is a 4×2bd/1ba + 1×1bd/1ba units multifamily listed at $495k. Condition is rated fair.
Deal economics
- At list price, monthly cash flow is $4k ($45k/yr) — positive. Per door: $750/mo.
- The deal already cash-flows at list — no discount required.
- Meets the 1% rule at list price ($9k rent vs $495k).
- Recommended offer: $436k (12.0% below list) — sets the bar for market timing.
- Cap rate 15.4% vs local median 3.5% in Bremerton — top-decile yield for the area; either an underpriced asset or a hidden risk that comps aren't pricing in. Stress-test before assuming the spread holds.
Location & tenants
- Location reads 86/100 on livability (#22 in WA, #431 nationally) — a professional / high-income tenant draw. Strengths: amenities A+, commute A+, housing A+; Watch: crime F.
- Bremerton School District (urban): math 36% / reading 51% proficiency, ranked #194 of 291 in WA (top 67%) — families likely to look elsewhere, expect single-tenant / working-renter base with shorter leases.
- Market conditions: Rents flat; 349 active listings in the ZIP; solid renter incomes; 1,294 units permitted in Kitsap County in 2024 (302 in 5+ unit buildings).
- At $8,864/mo this rent would consume 118% of the median local household income ($90k/yr) (locally 993% of renters already pay >50% of income on rent) — very limited rent-growth headroom before tenants either downsize or default.
Forward outlook
- Local home prices are declining (-3.0%/yr); year-one equity from $3k of loan paydown is wiped out by about $15k of value loss. Plan a longer hold.
- Kitsap County population projected at +8% by 2050 — modest demand growth; plan on rents tracking national, not racing it.
- At projected returns (-3.0% appreciation + 0.3% rent growth), your $139k cash investment doubles in ~4 years — after that, you're playing with house money.
Negotiation context
- It's been on market 159 days — a 12% lower offer ($436k) is reasonable based on typical stale-listing flexibility.
- Current owner paid $305k; list at $495k implies a 62% gain — meaningful room to come down on a strong offer.
Risks & watch-outs
- Watch-outs: built in 1945 — expect roof / HVAC / electrical / plumbing capex.
Questions for the listing agent
- It's been on market 159 days. Have you received any prior offers? Is the seller open to a 12% concession, seller financing, or rate buy-down credit?
- Can we see the unit-by-unit rent roll, current vacancy, and any below-market leases? What's the average tenancy length?
- What capital expenditures (roof, boiler, parking lot, exteriors) have been made in the last 5 years, and what's planned in the next 2?
- Have any recent inspections been done? Can we get a copy of the seller's disclosures and any deferred-maintenance estimates?
- Built in 1945 — when were the roof, HVAC, electrical panel, plumbing, and water heater last replaced?
- Why hasn't it sold? Are there any deal-killer items the seller is aware of (foundation, flood, title, zoning, code violations)?
- Is there a deadline driving the sale (1031 exchange, divorce, estate, relocation)? That informs how much negotiation room exists.
- Schools are B-rated — typically a magnet for longer-tenancy family renters. What's the average tenant stay here, and is there a school-zone premium baked into asking?
- Crime grade is F in this area — have there been break-ins, vandalism, or insurance claims at this property in the last 3 years? What carrier currently insures it and at what premium?
- What's the average days-on-market for RENTAL listings here right now (not sales)? A rising rental-DOM trend means longer vacancies and softer asking-rent achievability than the comps imply.
- What's the recent tenant-quality profile in this submarket — average credit score on applications, eviction rate, late-payment / NSF rate, and stable-employment percentage? A property-management company in the area should have these aggregated.
- How much new apartment / multifamily construction is in the pipeline within 1–3 miles? Heavy new supply (>2% of stock underway) typically softens rents 12–24 months out; light construction supports rent growth.
Investment metrics
- 1% rule
- 1.79% ✓
- Cap rate
- 15.39%
- Cash-on-cash
- 32.49%
- DSCR
- 2.45
- GRM
- 4.7
CMA / ARV
- ARV (median comp)
- $880,507
- List price
- $495,000
- Delta
- -43.78%
- Verdict
- UNDERPRICED
- Comps
- 3 within 2.0 mi
Projected returns pro-forma
-3.0% appreciation · 0.28% rent growth · sell at horizon
- IRR
- 24.5%
- Equity multiple
- 1.98×
- Total profit
- $135,190
- Equity at exit
- $73,806
- IRR
- 30.6%
- Equity multiple
- 3.41×
- Total profit
- $333,798
- Equity at exit
- $42,799
Cash invested: $138,600 (down + closing). Projections, not guarantees.
Landlord ↔ Tenant lean methodology
- Overall (STATE)
- 28 Tenant-Leaning
- State Washington
- 28 Tenant-Leaning · D+8
- County
- — inherits STATE
- City
- — inherits STATE
ZIP-level market 98312
- Rents YoY
- 0.3%
- Active inventory
- 349
- Price-to-rent
- 23.0×
Monthly cashflow live
- Estimated rent
- $8,864 high interval (Pro) →
- Mortgage (P&I)
- −$2,596
- Tax from tax record
- −$448 /mo · $5,377/yr
- Insurance
- −$206
- HOA
- −$0
- Vacancy / Maint / Mgmt
- −$1,861
- Net cashflow
- $3,752
Break-even live
5-unit breakdown (identical units grouped — click to expand)
| Units | Beds | Baths | Est. rent |
|---|---|---|---|
| 4× units | 2 | 1 | $7,176 |
| #1 | 2 | 1 | $1,794 |
| #2 | 2 | 1 | $1,794 |
| #3 | 2 | 1 | $1,794 |
| #4 | 2 | 1 | $1,794 |
| 1× unit | 1 | 1 | $1,687 |
| Total (5 units) | $8,864 | ||
UW: 25.0% down · 7.5% · 30yr · 1.5% tax · 5.0% vac · 8.0% maint · 8.0% mgmt
Financing live
Cash to close
- Down payment
- $123,750
- Closing costs
- $14,850
- Reserves months
- —
- Total cash needed
- —
Loan-product check · same deal, 3 products live
Conventional
25% down · 7.5% · 30yr
- Down + closing
- —
- Monthly P&I
- —
- Monthly cashflow
- —
- DSCR
- —
- Eligible?
- —
Personal DTI + credit; lowest rate.
DSCR
20% down · 8.5% · 30yr
- Down + closing
- —
- Monthly P&I
- —
- Monthly cashflow
- —
- DSCR
- —
- Eligible?
- —
No personal income docs; deal must DSCR.
Hard money
10% down · 12.0% · 12mo
- Down + closing
- —
- Monthly P&I
- —
- Monthly cashflow
- —
- DSCR
- —
- Eligible?
- —
Short-term bridge; refi at stabilization.
Listing history 20 events
-
2026-06-18days on market $495,000 Active 159 DOM
-
2026-06-17days on market $495,000 Active 158 DOM
-
2026-06-16days on market $495,000 Active 157 DOM
-
2026-06-15days on market $495,000 Active 156 DOM
-
2026-06-14days on market $495,000 Active 154 DOM
-
2026-06-13days on market $495,000 Active 153 DOM
-
2026-06-10days on market $495,000 Active 151 DOM
-
2026-06-09days on market $495,000 Active 150 DOM
-
2026-06-08days on market $495,000 Active 149 DOM
-
2026-06-07days on market $495,000 Active 148 DOM
-
2026-06-02days on market $495,000 Active 143 DOM
-
2026-06-01days on market $495,000 Active 142 DOM
-
2026-05-31days on market $495,000 Active 141 DOM
-
2026-05-30days on market $495,000 Active 140 DOM
-
2026-05-19price $495,000
-
2022-01-18soldstatus $305,000 Closed
-
2022-01-18soldstatus $305,000
-
2021-11-04status Pending
-
2021-10-27$250,000 Active
-
2017-02-15soldstatus $175,000
ⓘ Source: listings_history table (triggers on properties + properties_extension) + one-shot
backfill from property_details.listing_events for pre-trigger history.
Tax reassessment forecast WA · Resets to sale price
- Current annual tax
- $5,377 · $448/mo
- Projected year-2 tax
- $5,377 · $448/mo
- Expected delta
- $0/yr ($0/mo · 0.0%)
ⓘ Screening estimate from a state-policy table — verify with the county assessor before closing.
Nearby sold comps map
Loading sold comps map…
Walkable amenities ~0.75 mi
Loading nearby amenities…
Taxation est. · year 1
- Rental income
- $106,368
- − Mortgage interest
- −$27,728
- − Property taxes
- −$5,377
- − Insurance
- −$2,475
- − Repairs & maintenance
- −$8,509
- − Management
- −$8,509
- − Depreciation
- −$14,400
- Taxable income
- $39,369
- Est. tax owed @ 24.0%
- −$9,449
- After-tax cash flow
- $35,580/yr
For passive investors: Depreciation is non-cash, so a rental often shows a tax loss while cash-flowing — sheltering income. Rental losses are passive: they offset passive income freely, and up to $25,000/yr can offset ordinary (W-2) income if you actively participate and your MAGI is under $100k (phasing out to $0 by $150k); unused losses carry forward. On sale, claimed depreciation is recaptured at up to 25%, and gains may owe capital-gains tax (a 1031 exchange can defer both). Figures are a year-1 estimate at your 24.0% rate — not tax advice; consult a CPA.
Condition & rehab AI · 12 photos
This 5-plex property requires extensive repairs to its exterior and windows, but the interior is in good condition. Potential buyers should verify the need for permits from the City of Bremerton.
Repairs flagged
- Major Boarded windows — Structural damage
- Major Missing siding — Exterior damage
Value-add opportunities
- Both Replace boarded windows — Safety and curb appeal
- Both Replace missing siding — Safety and curb appeal
- Both Paint exterior — Safety and curb appeal
- Both Replace missing siding — Safety and curb appeal
Renovation cost estimate screening
| Repair item | Severity | Est. cost |
|---|---|---|
| Boarded windows · Structural damage | Major | $15,000–50,000 |
| Missing siding · Exterior damage | Major | $15,000–50,000 |
| Total estimated repair cost · 2 items | $30,000–100,000 |
Value-add ROI direction
- Both Replace boarded windows — Safety and curb appeal ↑
- Both Replace missing siding — Safety and curb appeal ↑
- Both Paint exterior — Safety and curb appeal ↑
- Both Replace missing siding — Safety and curb appeal ↑
ⓘ Cost ranges are severity-bucket heuristics (US national rule-of-thumb). Get contractor quotes + a written scope before underwriting a rehab budget.
Schools (NCES district)
- District
- Bremerton School District
- NCES district ID
- 5300660
- Math proficiency
- 36% ▼ -3.00%
- Reading proficiency
- 51% ▲ 1.00%
- Median HH income
- $46,765
- Composite
- 39.34/100
- National rank
- #8163
- State rank
- #194 of 291 in WA
Livability — Bremerton
- Score
- 86/100
- State rank
- #22
- US rank
- #431
Category grades
Schools grade is shown separately in the Schools card above.
Census & demographics
- Census place
- Bremerton, WA
- County
- Kitsap County · 243,099 people
- City population
- 94,488
- Metro
- Bremerton-Silverdale-Port Orchard, WA
- Population (ZIP)
- 36,307
- Household income
- $90,449
- Rent vs Own
- Severe rent burden
- 993.0
Population outlook (Kitsap County) Hauer SSP2
- Today (2025)
- 277,525 people
- By 2030
- 285,040 · +2.7%
- By 2040
- 294,957 · +6.3%
- By 2050
- 300,622 · +8.3%
- By 2075
- 315,580 · +13.7%
- By 2100
- 304,340 · +9.7%
Race, ethnicity, and origin ACS 2023
- Neighborhood character
- Predominantly White (68%)
- Race & ethnicity
- White 68% Two or more races 13% Hispanic / Latino 12% Asian 4% Black 4% Native American 1%
- Hispanic origin (detail)
- Mexican 6% Puerto Rican 1%
- Common ancestry
- Italian 7% Portuguese 5% Slovak 4%
- Foreign-born
- 6% · Canada, China
- Languages at home
- 91% English-only · Spanish 4% Tagalog/Filipino 2% Other Asian/Pacific 1%
Political lean MEDSL · Kitsap
- 2024 margin
- Strong D (+20.9) · D 58.8% · R 37.9% · Other 3.3%
- 2008→2024 swing
- +8.6pp toward D · 2008: 12.3pp · 2024: 20.9pp
- All cycles
- 2024: D+20.9 2020: D+18.1 2016: D+11.6 2012: D+11.1 2008: D+12.3
Not yet ingested
- Civics
- —
Market trends
- HPI YoY
- ▼ -436.68%
- Current HPI
- 379.2342
- Rent YoY
- ▲ 0.28%
- Metro
- Bremerton-Silverdale-Port Orchard, WA
- State GDP YoY
- ▲ 4.65%
- F500 in state
- 22
Industry mix (Fortune 500 HQ in WA)
| Industry | F500 HQs | Revenue |
|---|---|---|
| Retail | 2 | $269B |
|
||
| Technology / Retail | 1 | $638B |
|
||
| Technology | 1 | $245B |
|
||
| Telecommunications | 1 | $38B |
|
||
| Food / Beverage | 1 | $36B |
|
||
| Automotive / Trucks | 1 | $34B |
|
||
Price history
+182.9% since first listed6 events — show timeline
- 2026-05-19 Price Changed $495,000 NWMLS as Distributed by MLS Grid
- 2022-01-18 Sold (Public Records) $305,000 Public Records
- 2022-01-18 Sold (MLS) $305,000 NWMLS as Distributed by MLS Grid
- 2021-11-04 Pending — NWMLS as Distributed by MLS Grid
- 2021-10-27 Listed $250,000 NWMLS as Distributed by MLS Grid
- 2017-02-15 Sold (Public Records) $175,000 Public Records
Property tax history
+47.4%/yrLatest (2026): $5,377 · +0.5% YoY. Source: county tax records.
Cash-flow waterfall
monthlySold comps — $/sqft
last 12 mo · ≤1 miLoading sold comps…