1313 Beman St · Augusta-Richmond County consolidated government (balance), GA
Flood risk 6/10 · Moderate
- FEMA flood zone
- X (unshaded)
- Chance of flooding over 30 yrs
- 0.72%
- Est. flood insurance / yr
- $507 – $1,088
Fire risk 1/10 · Minimal
- Est. fire insurance / yr
- $963 – $1,789
Heat risk 8/10 · Major
- Hot days now (above 108°F)
- 7 days/yr
- Hot days in 30 yrs
- 17 days/yr
Wind risk 6/10 · Moderate
- Chance of severe wind over 30 yrs
- 66.0%
Air-quality risk 4/10 · Minor
- Unhealthy air days now
- 4 days/yr
- Unhealthy air days in 30 yrs
- 4 days/yr
Risk factors via First Street. Map © Google.
Why this score? — see what drove the C+ grade
The composite is a weighted blend of 9 inputs, each scored 0–100. Each bar is that input's sub-score; the figure is the points it added to the 100-point composite (weight × sub-score).
- Cash flow +24.6/30.0
- ARV discount +15.0/15.0
- DSCR +7.9/10.0
- 1% rule +6.5/10.0
- Rent growth +3.6/5.0
- Livability +2.5/5.0
- Condition / age +2.5/5.0
- Schools +1.3/10.0
- Appreciation +0.0/10.0
$143,000
🖨 Deal sheet 📄 Offer letter ✓ Due diligence
Listing remarks MLS
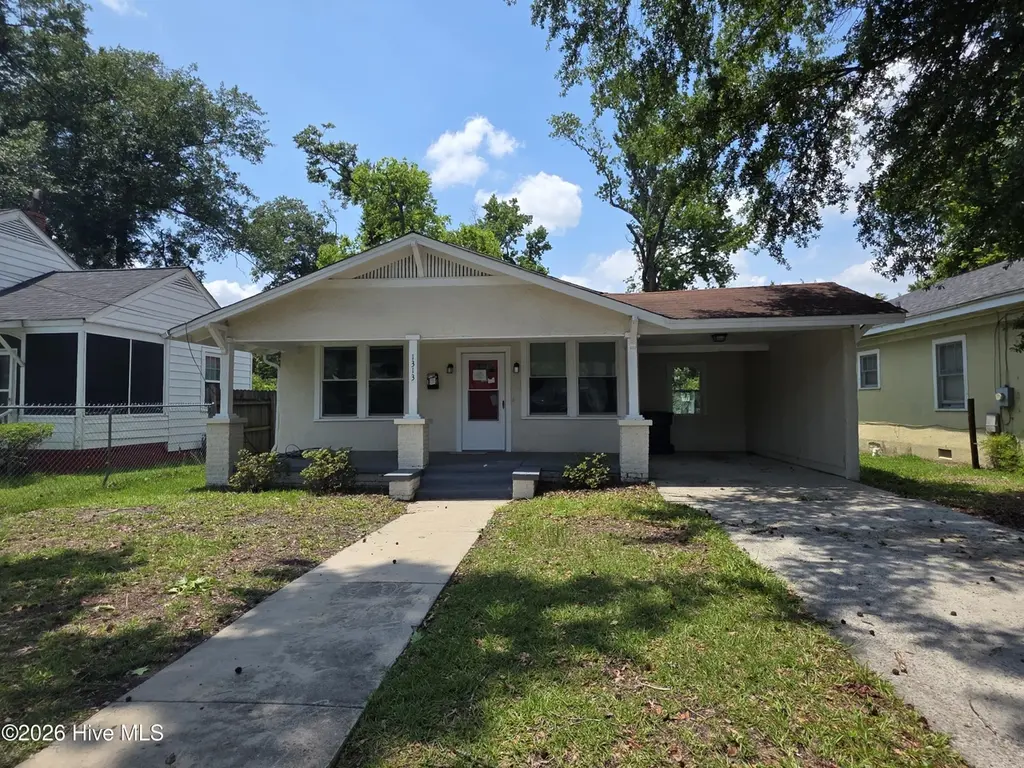
Charming and cozy 2-bedroom, 1-bath cottage offering over 1,250 square feet of comfortable living space! This home features an open floor plan that creates a warm and inviting atmosphere, perfect for everyday living and entertaining. Enjoy relaxing on the covered front porch or spending time outdoors in the fenced backyard. Conveniently located near the downtown hospital district, shopping, and restaurants, this home offers both comfort and convenience in a great location!
Key facts
- Covered front porch
- Open floor plan
- Fenced backyard
Tags
Property features AI
Exterior
- Parking: Attached garage (1 car); Total of 1 parking space
- Utilities: Public water; Public sewer; Natural gas connected; Water connected; Sewer connected; Cable available
- Home design: Single family residence; One-level / One story; Entry level: 1; R3 zoning
- Construction: Stucco and frame construction; Composition roof; Built on crawl space
- Exterior features: Front porch; Back yard fencing; Has view; Paved road access; City street and state road frontage
Interior
- Kitchen: Refrigerator; Dishwasher; Electric range; Vented exhaust fan
- Bedrooms: 7 total rooms (includes bedrooms and living spaces)
- Flooring: Carpet; Laminate; Vinyl
- Bathrooms: 1 full bathroom
- Heating & cooling: Forced air heating (natural gas); Central air conditioning; Ceiling fan(s)
- Interior features: Ceiling fan(s); Eat-in kitchen; Window coverings; Unfurnished; Crawl space
- Laundry & utility: Washer hookup; Laundry room; Electric water heater
Neighborhood map
What this means for you Summary
Snapshot
- This is a 3-bed/1.0-bath single-family listed at $143k.
Deal economics
- At list price, monthly cash flow is $296 ($4k/yr) — positive.
- The deal already cash-flows at list — no discount required.
- Meets the 1% rule at list price ($2k rent vs $143k).
- Recommended offer: $141k (1.5% below list) — sets the bar for market timing.
- Cap rate 8.8% vs local median 5.3% in Augusta-Richmond County consolidated government (balance) — top-decile yield for the area; either an underpriced asset or a hidden risk that comps aren't pricing in. Stress-test before assuming the spread holds.
Location & tenants
- Location reads: area grade C — affects rentability + tenant quality, not the cash-flow math above.
- Richmond County (urban): math 12% / reading 20% proficiency, ranked #154 of 174 in GA (top 88%) — low school quality limits family demand, transient renter base, plan for 1-2y turnover; 72% free/reduced lunch — lower-income household profile, screen leases tightly.
- Zoned schools: Monte Sano Elementary School (math 2% / reading 8%, grade F, #1,160 of 1,228 statewide, top 98%, 410 students, 98% FRL); Tutt Middle School (math 7% / reading 21%, grade F, #405 of 470 statewide, top 86%, 476 students, 98% FRL); Academy of Richmond County High School (math 2% / reading 17%, grade F, #365 of 424 statewide, top 88%, 1,141 students, 98% FRL) — zoned schools average 98% FRL vs 72% district-wide (26 pts higher); higher-poverty schools than district average — tighter screening recommended.
- Market conditions: Rents rising fast (+4.3%/yr); 222 active listings in the ZIP; 40 comparable units currently listed for rent nearby; rentals at typical pace (median 23d on market — plan ~3-4 weeks tenant-placement turnaround); 45% of comp listings sitting > 30 days — soft ceiling on asking rent; 561 units permitted in Richmond County in 2024 (0 in 5+ unit buildings).
- This rent runs 42% of the median local income ($47k/yr) — at the standard rent-burdened threshold; future hikes will face affordability resistance.
Forward outlook
- Local home prices are declining (-3.0%/yr); year-one equity from $989 of loan paydown is wiped out by about $4k of value loss. Plan a longer hold.
- Richmond County population projected to shrink 5% by 2050 — rents likely to lag national; underwrite the cash flow, not the appreciation.
- At projected returns (-3.0% appreciation + 4.3% rent growth), your $40k cash investment doubles in ~10 years — after that, you're playing with house money.
Negotiation context
- It's been on market 15 days — a 2% lower offer ($141k) is reasonable based on typical stale-listing flexibility.
- 12 sale attempts since 27y ago with the ask held roughly flat each time — persistent listings suggest the price (not the market) is what's stuck; bring a comps-based counter.
Risks & watch-outs
- Watch-outs: built in 1930 — expect roof / HVAC / electrical / plumbing capex.
- Climate carrying-cost: major flood risk; major wind risk, 66% chance of damaging wind over 30y; extreme-heat days projected 7→17/yr by 2055 (HVAC capex compounding) — expect insurance premiums to compound above CPI over the hold.
Questions for the listing agent
- Built in 1930 — when were the roof, HVAC, electrical panel, plumbing, and water heater last replaced?
- Is there a deadline driving the sale (1031 exchange, divorce, estate, relocation)? That informs how much negotiation room exists.
- What's the average days-on-market for RENTAL listings here right now (not sales)? A rising rental-DOM trend means longer vacancies and softer asking-rent achievability than the comps imply.
- What's the recent tenant-quality profile in this submarket — average credit score on applications, eviction rate, late-payment / NSF rate, and stable-employment percentage? A property-management company in the area should have these aggregated.
- How much new for-sale + rental construction is in the pipeline within 1–3 miles? Heavy new supply typically softens prices + rents 12–24 months out; constrained supply supports both.
Investment metrics
- 1% rule
- 1.15% ✓
- Cap rate
- 8.77%
- Cash-on-cash
- 8.86%
- DSCR
- 1.39
- GRM
- 7.2
CMA / ARV
- ARV (on-the-fly)
- $174,150
- Comps found
- 12
Show comp detail 12 sales within ~0.75 mi
| Address | Dist | Beds/Ba | Sqft | Sold | Price | $/sf | Match |
|---|---|---|---|---|---|---|---|
| 1135 Merry St | 0.27mi | 3/2.0 | 1,294 (+0%) | 6mo | $113,500 | $88 | 78 |
| 1834 Woodrow St | 0.31mi | 3/1.5 | 1,326 (+3%) | 2mo | $233,000 | $176 | 78 |
| 1835 Mcdowell St | 0.34mi | 2/1.0 (-1) | 1,296 (+0%) | 4mo | $230,000 | $177 | 74 |
| 1823 Wrightsboro Rd | 0.27mi | 3/3.0 | 1,256 (-3%) | 1mo | $224,900 | $179 | 74 |
| 924 Beman St | 0.47mi | 3/1.0 | 1,395 (+8%) | 5mo | $165,000 | $118 | 61 |
| 1430 Heard Ave | 0.70mi | 2/1.0 (-1) | 1,260 (-2%) | 1mo | $155,000 | $123 | 58 |
| 1208 Hickman Rd | 0.75mi | 3/1.0 | 1,323 (+3%) | 4mo | $160,000 | $121 | 58 |
| 947 Beman St | 0.38mi | 2/2.0 (-1) | 1,200 (-7%) | 5mo | $185,000 | $154 | 57 |
| 1802 Wrighstboro Rd Rd | 0.19mi | 2/2.0 (-1) | 1,114 (-14%) | 5mo | $122,880 | $110 | 55 |
| 940 Russell St | 0.55mi | 2/1.5 (-1) | 1,376 (+7%) | 1mo | $249,900 | $182 | 55 |
| 1804 Starnes St | 0.70mi | 3/1.0 | 1,196 (-7%) | 4mo | $65,000 | $54 | 52 |
| 1408 Holley St | 0.67mi | 3/2.0 | 1,181 (-8%) | 4mo | $160,000 | $135 | 48 |
Match score weights: distance 35% · size 25% · config 20% · recency 20%. Top-matched comps best support the ARV.
Projected returns pro-forma
-3.0% appreciation · 4.29% rent growth · sell at horizon
- IRR
- -1.4%
- Equity multiple
- 0.95×
- Total profit
- $-2,140
- Equity at exit
- $21,322
- IRR
- 9.7%
- Equity multiple
- 1.79×
- Total profit
- $31,646
- Equity at exit
- $12,364
Cash invested: $40,040 (down + closing). Projections, not guarantees.
Landlord ↔ Tenant lean methodology
- Overall (STATE)
- 90 Strongly Landlord-Friendly
- State Georgia
- 90 Strongly Landlord-Friendly · R+3
- County
- — inherits STATE
- City
- — inherits STATE
ZIP-level market 30904
- Rents YoY
- 4.3%
- Active inventory
- 222
- Price-to-rent
- 7.2×
Monthly cashflow live
- Estimated rent
- $1,646 high interval (Pro) →
- Mortgage (P&I)
- −$750
- Tax from tax record
- −$195 /mo · $2,344/yr
- Insurance
- −$60
- HOA
- −$0
- Vacancy / Maint / Mgmt
- −$346
- Net cashflow
- $296
Break-even live
UW: 25.0% down · 7.5% · 30yr · 1.5% tax · 5.0% vac · 8.0% maint · 8.0% mgmt
Financing live
Cash to close
- Down payment
- $35,750
- Closing costs
- $4,290
- Reserves months
- —
- Total cash needed
- —
Loan-product check · same deal, 3 products live
Conventional
25% down · 7.5% · 30yr
- Down + closing
- —
- Monthly P&I
- —
- Monthly cashflow
- —
- DSCR
- —
- Eligible?
- —
Personal DTI + credit; lowest rate.
DSCR
20% down · 8.5% · 30yr
- Down + closing
- —
- Monthly P&I
- —
- Monthly cashflow
- —
- DSCR
- —
- Eligible?
- —
No personal income docs; deal must DSCR.
Hard money
10% down · 12.0% · 12mo
- Down + closing
- —
- Monthly P&I
- —
- Monthly cashflow
- —
- DSCR
- —
- Eligible?
- —
Short-term bridge; refi at stabilization.
Rent comps 40 comps
| Address | Beds | Baths | Sqft | Rent | $/sqft | DOM | Units | Dist |
|---|---|---|---|---|---|---|---|---|
| 1315 Merry St Augusta, GA | 3.0 | 2.0 | 1610 | $1,450 | $0.90 | 23d | 1 | 0.16mi |
| 1804 Central Ave Augusta, GA | 2.0 | 1.0 | 1200 | $1,100 | $0.92 | 23d | 1 | 0.19mi |
| 1812 Central Ave Unit 1 Augusta, GA | 3.0 | 1.5 | 1528 | $2,600 | $1.70 | 43d | 1 | 0.24mi |
| 1812 Central Ave Augusta, GA | 3.0 | 1.5 | 1568 | $2,200 | $1.40 | 43d | 1 | 0.24mi |
| 1812 Central Ave Augusta, GA | 3.0 | 1.5 | 1568 | $2,200 | $1.40 | 23d | 1 | 0.24mi |
| 1313 Wilson St Apt C Augusta, GA | 2.0 | 2.0 | 900 | $1,350 | $1.50 | 43d | 1 | 0.28mi |
| 1812 Slaton St Augusta, GA | 2.0 | 2.0 | 1615 | $1,665 | $1.03 | 23d | 10 | 0.29mi |
| 1861 Central Ave Unit A Augusta, GA | 2.0 | 2.5 | 1611 | $1,750 | $1.09 | 43d | 1 | 0.33mi |
| 1861 Central Ave Unit A Augusta, GA | 2.0 | 2.5 | 1611 | $1,750 | $1.09 | 23d | 1 | 0.33mi |
| 1105 Merry St Augusta, GA | 3.0 | 1.0 | 1281 | $1,350 | $1.05 | 23d | 1 | 0.39mi |
| 1480 Wrightsboro Rd Augusta, GA | 1.0–3.0 | 1.0–2.0 | 1046 | $2,375 | $2.27 | 21d | 13 | 0.40mi |
| 1425 Lee Beard Way Augusta, GA | 1.0–2.0 | 1.0 | 776 | $1,181 | $1.52 | 43d | 1 | 0.52mi |
| 2031 Wrightsboro Rd Augusta, GA | 2.0 | 2.0 | 1240 | $1,750 | $1.41 | 43d | 1 | 0.61mi |
| 1712 Morgan St Augusta, GA | 3.0 | 1.0 | 1209 | $1,330 | $1.10 | 23d | 1 | 0.63mi |
| 1432 Heard Ave Augusta, GA | 3.0 | 2.0 | 1278 | $1,500 | $1.17 | 43d | 1 | 0.72mi |
| 1508 Heard Ave Augusta, GA | 3.0 | 2.0 | 1314 | $1,400 | $1.07 | 43d | 1 | 0.72mi |
| 936 Hickman Rd Unit 3 Augusta, GA | 2.0 | 2.0 | 875 | $1,195 | $1.37 | 13d | 1 | 0.80mi |
| 2139 Holt St Augusta, GA | 3.0 | 2.0 | 1611 | $1,550 | $0.96 | 43d | 1 | 0.85mi |
| 2139 Holt St Augusta, GA | 3.0 | 2.0 | 1611 | $1,475 | $0.92 | 23d | 1 | 0.85mi |
| 1110 Troupe St Augusta, GA | 2.0 | 1.0 | 1035 | $1,100 | $1.06 | 23d | 1 | 0.91mi |
| 1112 Troupe St Augusta, GA | 2.0 | 1.0 | 1035 | $1,100 | $1.06 | 23d | 1 | 0.91mi |
| 1912 Watkins St #1912 Augusta, GA | 3.0 | 1.0 | 1126 | $1,325 | $1.18 | 23d | 1 | 0.92mi |
| 1912 Watkins St #1912 Augusta, GA | 3.0 | 1.0 | 1126 | $1,425 | $1.27 | 43d | 1 | 0.92mi |
| 2009 Starnes St Augusta, GA | 2.0 | 1.0 | 1305 | $975 | $0.75 | 43d | 1 | 0.93mi |
| 1742 Walker St Augusta, GA | 3.0 | 2.0 | 1384 | $1,600 | $1.16 | 44d | 1 | 0.94mi |
| 2198 Central Ave Unit D Augusta, GA | 2.0 | 1.0 | 900 | $950 | $1.06 | 23d | 1 | 0.94mi |
| 1610 Cornell Dr Augusta, GA | 3.0 | 1.0 | 1025 | $1,100 | $1.07 | 43d | 1 | 0.95mi |
| 1610 Cornell Dr Augusta, GA | 3.0 | 1.0 | 1025 | $1,100 | $1.07 | 23d | 1 | 0.95mi |
| 2110 Gary St Augusta, GA | 2.0 | 1.5 | 1173 | $1,195 | $1.02 | 43d | 1 | 0.97mi |
| 1506 Pendleton Rd Augusta, GA | 2.0 | 1.0 | 1026 | $1,300 | $1.27 | 43d | 1 | 1.01mi |
| 1506 Pendleton Rd Augusta, GA | 2.0 | 1.0 | 1026 | $1,300 | $1.27 | 23d | 1 | 1.01mi |
| 1509 Troupe St Augusta, GA | 3.0 | 2.0 | 1200 | $1,695 | $1.41 | 13d | 1 | 1.02mi |
| 1326 Wingfield St Augusta, GA | 2.0 | 1.0 | 1507 | $1,700 | $1.13 | 13d | 1 | 1.03mi |
| 2028 Battle Row Augusta, GA | 2.0 | 2.0 | 1100 | $1,650 | $1.50 | 43d | 1 | 1.04mi |
| 1399 Walton Way Augusta, GA | 2.0 | 2.0 | 1017 | $1,690 | $1.66 | 23d | 1 | 1.10mi |
| 2219 Archer Augusta, GA | 2.0 | 2.0 | 1103 | $1,495 | $1.36 | 43d | 1 | 1.10mi |
| 2221 Archer LN Augusta, GA | 2.0 | 2.0 | 1103 | $1,495 | $1.36 | 43d | 1 | 1.10mi |
| 1613 Pendleton Rd Augusta, GA | 3.0 | 2.0 | 1418 | $1,695 | $1.20 | 13d | 1 | 1.14mi |
| 1712 Kissingbower Rd Augusta, GA | 2.0 | 1.0 | 1072 | $1,400 | $1.31 | 13d | 1 | 1.16mi |
| 1946 Greene St Augusta, GA | 3.0 | 1.0 | 952 | $1,350 | $1.42 | 13d | 1 | 1.17mi |
Listing history 10 events
-
2026-06-18days on market $143,000 Active 15 DOM
-
2026-06-17days on market $143,000 Active 14 DOM
-
2026-06-16days on market $143,000 Active 13 DOM
-
2026-06-15days on market $143,000 Active 12 DOM
-
2026-06-14days on market $143,000 Active 10 DOM
-
2026-06-10days on market $143,000 Active 7 DOM
-
2026-06-09days on market $143,000 Active 6 DOM
-
2026-06-08days on market $143,000 Active 5 DOM
-
2026-06-07remarks 477-char remark
-
2026-06-07$143,000 Active 4 DOM
ⓘ Source: listings_history table (triggers on properties + properties_extension) + one-shot
backfill from property_details.listing_events for pre-trigger history.
Tax reassessment forecast GA · Resets to sale price
- Current annual tax
- $2,344 · $195/mo
- Projected year-2 tax
- $2,344 · $195/mo
- Expected delta
- $0/yr ($0/mo · 0.0%)
ⓘ Screening estimate from a state-policy table — verify with the county assessor before closing.
Climate risk First Street
- Flood 6/10 Major FEMA zone X (unshaded) · 72% chance over 30 yrs
- Wildfire 1/10 Low
- Heat 8/10 Severe 7 d/yr ≥108°F today · 17 d/yr by 30 yrs out
- Wind 6/10 Major 66% chance of damaging wind over 30 yrs
- Air quality 4/10 Moderate 4 unhealthy d/yr today · 4 by 30 yrs out
Nearby sold comps map
Loading sold comps map…
Walkable amenities ~0.75 mi
Loading nearby amenities…
Taxation est. · year 1
- Rental income
- $19,755
- − Mortgage interest
- −$8,010
- − Property taxes
- −$2,344
- − Insurance
- −$715
- − Repairs & maintenance
- −$1,580
- − Management
- −$1,580
- − Depreciation
- −$4,160
- Taxable income
- $1,365
- Est. tax owed @ 24.0%
- −$328
- After-tax cash flow
- $3,221/yr
For passive investors: Depreciation is non-cash, so a rental often shows a tax loss while cash-flowing — sheltering income. Rental losses are passive: they offset passive income freely, and up to $25,000/yr can offset ordinary (W-2) income if you actively participate and your MAGI is under $100k (phasing out to $0 by $150k); unused losses carry forward. On sale, claimed depreciation is recaptured at up to 25%, and gains may owe capital-gains tax (a 1031 exchange can defer both). Figures are a year-1 estimate at your 24.0% rate — not tax advice; consult a CPA.
Schools (NCES district)
- District
- Richmond County
- NCES district ID
- 1304380
- Math proficiency
- 12% ▼ -9.00%
- Reading proficiency
- 20% ▼ -6.00%
- Median HH income
- $38,069
- Composite
- 13.43/100
- National rank
- #9524
- State rank
- #154 of 174 in GA
Livability — Augusta-Richmond County consolidated government (balance)
No livability data for this city. (Only ~50 U.S. cities are tracked.)
Census & demographics
- Census place
- Augusta-Richmond County consolidated government (balance), GA
- County
- Richmond County · 190,917 people
- City population
- 154,035
- Metro
- Augusta-Richmond County, GA-SC
- Population (ZIP)
- 23,400
- Household income
- $46,696
- Rent vs Own
- Severe rent burden
- 1594.0
Population outlook (Richmond County) Hauer SSP2
- Today (2025)
- 200,753 people
- By 2030
- 200,232 · -0.3%
- By 2040
- 196,813 · -2.0%
- By 2050
- 190,347 · -5.2%
- By 2075
- 172,496 · -14.1%
- By 2100
- 146,284 · -27.1%
Race, ethnicity, and origin ACS 2023
- Neighborhood character
- Diverse neighborhood (Simpson 0.61)
- Race & ethnicity
- Black 47% White 41% Hispanic / Latino 6% Two or more races 6% Asian 2%
- Hispanic origin (detail)
- Mexican 1%
- Common ancestry
- Italian 1% Slovak 1% Romanian 1%
- Foreign-born
- 3% · Canada, South Korea, Jamaica
- Languages at home
- 93% English-only · Spanish 4% Korean 1%
Political lean MEDSL · Richmond
- 2024 margin
- Solid D (+36.1) · D 67.8% · R 31.7%
- 2008→2024 swing
- +4.3pp toward D · 2008: 31.8pp · 2024: 36.1pp
- All cycles
- 2024: D+36.1 2020: D+37.2 2016: D+32.4 2012: D+33.8 2008: D+31.8
Not yet ingested
- Civics
- —
Market trends
- HPI YoY
- ▼ -211.97%
- Current HPI
- 199.0807
- Rent YoY
- ▲ 4.29%
- Metro
- Augusta-Richmond County, GA-SC
- State GDP YoY
- ▲ 2.66%
- F500 in state
- 28
Industry mix (Fortune 500 HQ in GA)
| Industry | F500 HQs | Revenue |
|---|---|---|
| Paper / Packaging | 2 | $29B |
|
||
| Retail | 1 | $160B |
|
||
| Transportation / Logistics | 1 | $91B |
|
||
| Airlines | 1 | $62B |
|
||
| Consumer Goods | 1 | $47B |
|
||
| Utilities | 1 | $25B |
|
||
Price history
+198.5% since first listed28 events — show timeline
- 2026-06-03 Listed $143,000 Hive MLS
- 2026-06-01 Listed $143,000 GAMLS
- 2026-05-11 Listing Removed — Hive MLS
- 2026-04-30 Sold (Public Records) $128,597 Public Records
- 2026-03-01 Listing Removed — Hive MLS
- 2026-02-13 Price Changed $47,900 Hive MLS
- 2025-07-25 Listed $177,900 Hive MLS
- 2025-07-25 Listed $177,900 Hive MLS
- 2023-08-10 Sold (Public Records) $161,400 Public Records
- 2023-07-13 Sold (MLS) $161,400 Hive MLS
- 2023-07-13 Sold (MLS) $161,400 Hive MLS
- 2023-04-18 Listed $161,400 Hive MLS
- 2023-04-18 Listed $161,400 Hive MLS
- 2022-09-27 Sold (Public Records) $80,300 Public Records
- 2020-03-09 Sold (MLS) $47,900 Hive MLS
- 2020-02-13 Listed $170,000 Hive MLS
- 2013-12-17 Sold (Public Records) $61,000 Public Records
- 2013-12-11 Sold (MLS) $61,000 Hive MLS
- 2013-12-11 Sold (MLS) $61,000 Hive MLS
- 2012-12-11 Listed $69,900 Hive MLS
- 2012-12-11 Listed $69,900 Hive MLS
- 2007-09-25 Sold (MLS) $40,200 Hive MLS
- 2007-09-25 Sold (MLS) $40,200 Hive MLS
- 2007-05-23 Listed $44,100 Hive MLS
- 2007-05-23 Listed $44,100 Hive MLS
- 2000-02-22 Sold (Public Records) $47,900 Public Records
- 2000-02-22 Sold (MLS) $47,900 Hive MLS
- 1999-10-11 Listed $47,900 Hive MLS
Property tax history
+6.4%/yrLatest (2025): $2,344 · +11.0% YoY. Source: county tax records.
Cash-flow waterfall
monthlySold comps — $/sqft
last 12 mo · ≤1 miLoading sold comps…