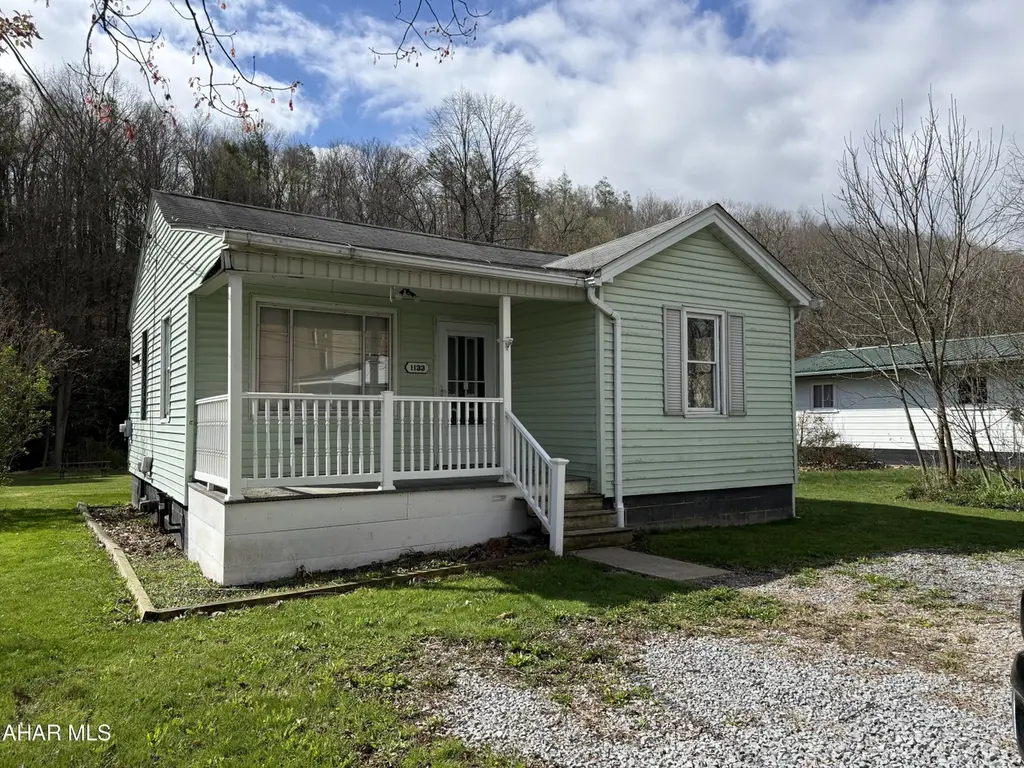
1133 Foot Of Ten Rd · Foot of Ten, PA
Flood risk 8/10 · Major
- FEMA flood zone
- X (unshaded)
- Chance of flooding over 30 yrs
- 0.99%
- Est. flood insurance / yr
- $507 – $1,088
Fire risk 3/10 · Minor
- Est. fire insurance / yr
- $511 – $949
Heat risk 3/10 · Minor
- Hot days now (above 96°F)
- 7 days/yr
- Hot days in 30 yrs
- 17 days/yr
Wind risk 2/10 · Minimal
- Chance of severe wind over 30 yrs
- —
Air-quality risk 3/10 · Minor
- Unhealthy air days now
- 2 days/yr
- Unhealthy air days in 30 yrs
- 4 days/yr
Risk factors via First Street. Map © Google.
Why this score? — see what drove the C+ grade
The composite is a weighted blend of 9 inputs, each scored 0–100. Each bar is that input's sub-score; the figure is the points it added to the 100-point composite (weight × sub-score).
- Cash flow +26.3/30.0
- DSCR +8.9/10.0
- ARV discount +8.4/15.0
- 1% rule +6.7/10.0
- Schools +4.6/10.0
- Livability +3.0/5.0
- Rent growth +2.5/5.0
- Condition / age +2.5/5.0
- Appreciation +0.0/10.0
$88,000
🖨 Deal sheet 📄 Offer letter ✓ Due diligence
Listing remarks MLS
Cute & Cozy. Easy one floor living with private backyard and tranquil stream. Convenient location - off street parking .
Key facts
- Covered front porch
- Fire pit area
- Walk-out basement
Tags
Neighborhood map
What this means for you Summary
Snapshot
- This is a 1-bed/1.0-bath single-family listed at $88k.
Deal economics
- At list price, monthly cash flow is $160 ($2k/yr) — positive.
- The deal already cash-flows at list — no discount required.
- Meets the 1% rule at list price ($1k rent vs $88k).
Location & tenants
- Location reads 59/100 on livability (#1,530 in PA) — a working-class tenant base; expect higher turnover. Strengths: cost of living A+, housing A+; Watch: amenities F, commute F, employment D-.
- Hollidaysburg Area SD (suburban): math 45% / reading 63% proficiency, ranked #129 of 539 in PA (top 24%) — acceptable for families but not a draw, mixed tenant base, ~2y average lease.
- Market conditions: 92 active listings in the ZIP; 99 units permitted in Blair County in 2024 (0 in 5+ unit buildings).
Forward outlook
- Local home prices are declining (-3.0%/yr); year-one equity from $608 of loan paydown is wiped out by about $3k of value loss. Plan a longer hold.
- Blair County population projected at -18% by 2050 — secular population decline; favor cash flow + early exit over multi-decade hold.
Negotiation context
- Only 1 days on market — expect competitive offers; lowballing is unlikely to land.
- 3 sale attempts since 9y ago with the ask held roughly flat each time — persistent listings suggest the price (not the market) is what's stuck; bring a comps-based counter.
- Current owner paid $74k; 20% above their basis — modest negotiation headroom, anchor on the comps not their cost.
Risks & watch-outs
- Watch-outs: flood insurance adds $66/mo; built in 1953 — expect roof / HVAC / electrical / plumbing capex.
- Climate carrying-cost: severe flood risk — expect insurance premiums to compound above CPI over the hold.
Questions for the listing agent
- Built in 1953 — when were the roof, HVAC, electrical panel, plumbing, and water heater last replaced?
- What's the actual annual flood-insurance premium (NFIP or private), and is the property in a SFHA with mandatory coverage?
- Is there a deadline driving the sale (1031 exchange, divorce, estate, relocation)? That informs how much negotiation room exists.
- What's the average days-on-market for RENTAL listings here right now (not sales)? A rising rental-DOM trend means longer vacancies and softer asking-rent achievability than the comps imply.
- What's the recent tenant-quality profile in this submarket — average credit score on applications, eviction rate, late-payment / NSF rate, and stable-employment percentage? A property-management company in the area should have these aggregated.
- How much new for-sale + rental construction is in the pipeline within 1–3 miles? Heavy new supply typically softens prices + rents 12–24 months out; constrained supply supports both.
Investment metrics
- 1% rule
- 1.17% ✓
- Cap rate
- 9.38%
- Cash-on-cash
- 11.02%
- DSCR
- 1.49
- GRM
- 7.1
CMA / ARV
- ARV (on-the-fly)
- $89,872
- Comps found
- 1
Show comp detail 1 sale within ~0.75 mi
| Address | Dist | Beds/Ba | Sqft | Sold | Price | $/sf | Match |
|---|---|---|---|---|---|---|---|
| 1133 Foot Of Ten Rd | 0.00mi | 1/1.0 | 656 (0%) | 1mo | $90,000 | $137 | 99 |
Match score weights: distance 35% · size 25% · config 20% · recency 20%. Top-matched comps best support the ARV.
Projected returns pro-forma
-3.0% appreciation · 3.0% rent growth · sell at horizon
- IRR
- -4.4%
- Equity multiple
- 0.84×
- Total profit
- $-4,034
- Equity at exit
- $13,121
- IRR
- 5.4%
- Equity multiple
- 1.40×
- Total profit
- $9,771
- Equity at exit
- $7,609
Cash invested: $24,640 (down + closing). Projections, not guarantees.
Landlord ↔ Tenant lean methodology
- Overall (STATE)
- 62 Landlord-Friendly
- State Pennsylvania
- 62 Landlord-Friendly · EVEN
- County
- — inherits STATE
- City
- — inherits STATE
ZIP-level market 16635
- Home prices YoY
- -4.0%
- Active inventory
- 92
- Price-to-rent
- 7.1×
Monthly cashflow live
- Estimated rent
- $1,027 medium interval (Pro) →
- Mortgage (P&I)
- −$461
- Tax from tax record
- −$87 /mo · $1,042/yr
- Insurance
- −$37
- Flood insurance flood zone
- −$66 /mo · $798/yr
- HOA
- −$0
- Vacancy / Maint / Mgmt
- −$216
- Net cashflow
- $160
Break-even live
UW: 25.0% down · 7.5% · 30yr · 1.5% tax · 5.0% vac · 8.0% maint · 8.0% mgmt
Financing live
Cash to close
- Down payment
- $22,000
- Closing costs
- $2,640
- Reserves months
- —
- Total cash needed
- —
Loan-product check · same deal, 3 products live
Conventional
25% down · 7.5% · 30yr
- Down + closing
- —
- Monthly P&I
- —
- Monthly cashflow
- —
- DSCR
- —
- Eligible?
- —
Personal DTI + credit; lowest rate.
DSCR
20% down · 8.5% · 30yr
- Down + closing
- —
- Monthly P&I
- —
- Monthly cashflow
- —
- DSCR
- —
- Eligible?
- —
No personal income docs; deal must DSCR.
Hard money
10% down · 12.0% · 12mo
- Down + closing
- —
- Monthly P&I
- —
- Monthly cashflow
- —
- DSCR
- —
- Eligible?
- —
Short-term bridge; refi at stabilization.
Listing history 10 events
-
2026-04-14status Pending
-
2026-04-13$88,000 Active
-
2022-05-19soldstatus $73,500
-
2022-05-18soldstatus $73,500 126-char remark
Show marketing remark (126 chars)
Cute & Cozy. Easy one floor living with private backyard and tranquil stream. Convenient location - off street parking .
-
2022-04-04$69,900 126-char remark
Show marketing remark (126 chars)
Cute & Cozy. Easy one floor living with private backyard and tranquil stream. Convenient location - off street parking .
-
2017-04-26soldstatus $54,900 142-char remark
Show marketing remark (142 chars)
Perfect for one or two people - this home is a ONE bedroom home and sits on a app 1/4 acre lot (FLAT lot) Hollidaysburg Area School District.
-
2017-04-26soldstatus $54,900
Show marketing remark (142 chars)
Perfect for one or two people - this home is a ONE bedroom home and sits on a app 1/4 acre lot (FLAT lot) Hollidaysburg Area School District.
-
2017-02-16$54,900 142-char remark
Show marketing remark (142 chars)
Perfect for one or two people - this home is a ONE bedroom home and sits on a app 1/4 acre lot (FLAT lot) Hollidaysburg Area School District.
-
1979-04-01soldstatus $25,000
-
1973-09-01soldstatus $12,900
ⓘ Source: listings_history table (triggers on properties + properties_extension) + one-shot
backfill from property_details.listing_events for pre-trigger history.
Tax reassessment forecast PA · Partial reset (capped growth)
- Current annual tax
- $1,042 · $87/mo
- Projected year-2 tax
- $1,216 · $101/mo
- Expected delta
- +$174/yr (+$15/mo · 16.7%)
ⓘ Screening estimate from a state-policy table — verify with the county assessor before closing.
Climate risk First Street
- Flood 8/10 Severe FEMA zone X (unshaded) · 99% chance over 30 yrs
- Wildfire 3/10 Moderate
- Heat 3/10 Moderate 7 d/yr ≥96°F today · 17 d/yr by 30 yrs out
- Wind 2/10 Low
- Air quality 3/10 Moderate 2 unhealthy d/yr today · 4 by 30 yrs out
Nearby sold comps map
Loading sold comps map…
Walkable amenities ~0.75 mi
Loading nearby amenities…
Taxation est. · year 1
- Rental income
- $12,324
- − Mortgage interest
- −$4,929
- − Property taxes
- −$1,042
- − Insurance
- −$1,238
- − Repairs & maintenance
- −$986
- − Management
- −$986
- − Depreciation
- −$2,560
- Taxable income
- $583
- Est. tax owed @ 24.0%
- −$140
- After-tax cash flow
- $1,779/yr
For passive investors: Depreciation is non-cash, so a rental often shows a tax loss while cash-flowing — sheltering income. Rental losses are passive: they offset passive income freely, and up to $25,000/yr can offset ordinary (W-2) income if you actively participate and your MAGI is under $100k (phasing out to $0 by $150k); unused losses carry forward. On sale, claimed depreciation is recaptured at up to 25%, and gains may owe capital-gains tax (a 1031 exchange can defer both). Figures are a year-1 estimate at your 24.0% rate — not tax advice; consult a CPA.
Schools (NCES district)
- District
- Hollidaysburg Area SD
- NCES district ID
- 4211940
- Math proficiency
- 45% ▼ -9.00%
- Reading proficiency
- 63% ▼ -8.00%
- Median HH income
- $50,676
- Composite
- 46.1/100
- National rank
- #2511
- State rank
- #129 of 539 in PA
Livability — Foot of Ten
- Score
- 59/100
- State rank
- #1530
- US rank
- #20015
Category grades
Schools grade is shown separately in the Schools card above.
Census & demographics
- Census place
- Foot of Ten, PA
- Population (ZIP)
- 12,115
Population outlook (Blair County) Hauer SSP2
- Today (2025)
- 121,571 people
- By 2030
- 117,966 · -3.0%
- By 2040
- 109,174 · -10.2%
- By 2050
- 99,542 · -18.1%
- By 2075
- 76,775 · -36.8%
- By 2100
- 54,326 · -55.3%
Race, ethnicity, and origin ACS 2023
- Neighborhood character
- Predominantly White (94%)
- Race & ethnicity
- White 94% Two or more races 3% Asian 2% Hispanic / Latino 2%
- Common ancestry
- Romanian 3% Slovak 2% Lithuanian 1%
- Foreign-born
- 2% · China
- Languages at home
- 96% English-only · Other Indo-European 2% Chinese 1% Spanish 1%
Political lean MEDSL · Blair
- 2024 margin
- Solid R (+43.5) · D 27.9% · R 71.4%
- 2008→2024 swing
- -19.2pp toward R · 2008: -24.3pp · 2024: -43.5pp
- All cycles
- 2024: R+43.5 2020: R+43.5 2016: R+46.4 2012: R+33.5 2008: R+24.3
Not yet ingested
- Civics
- —
Market trends
- HPI YoY
- ▼ -10.69%
- Current HPI
- 258.7396
- Rent YoY
- —
- Metro
- —
- State GDP YoY
- ▲ 1.68%
- F500 in state
- 34
Industry mix (Fortune 500 HQ in PA)
| Industry | F500 HQs | Revenue |
|---|---|---|
| Healthcare | 2 | $309B |
|
||
| Insurance | 2 | $27B |
|
||
| Telecommunications / Media | 1 | $124B |
|
||
| Industrial Distribution | 1 | $22B |
|
||
| Financial Services | 1 | $20B |
|
||
| Chemicals / Materials | 1 | $18B |
|
||
Price history
+582.2% since first listed10 events — show timeline
- 2026-04-14 Pending — AHARMLS
- 2026-04-13 Listed $88,000 AHARMLS
- 2022-05-19 Sold (Public Records) $73,500 Public Records
- 2022-05-18 Sold (MLS) $73,500 AHARMLS
- 2022-04-04 Listed $69,900 AHARMLS
- 2017-04-26 Sold (Public Records) $54,900 Public Records
- 2017-04-26 Sold (MLS) $54,900 AHARMLS
- 2017-02-16 Listed $54,900 AHARMLS
- 1979-04-01 Sold (Public Records) $25,000 Public Records
- 1973-09-01 Sold (Public Records) $12,900 Public Records
Property tax history
+0.3%/yrLatest (2025): $1,042 · +2.4% YoY. Source: county tax records.
Cash-flow waterfall
monthlySold comps — $/sqft
last 12 mo · ≤1 miLoading sold comps…