 5-Plex
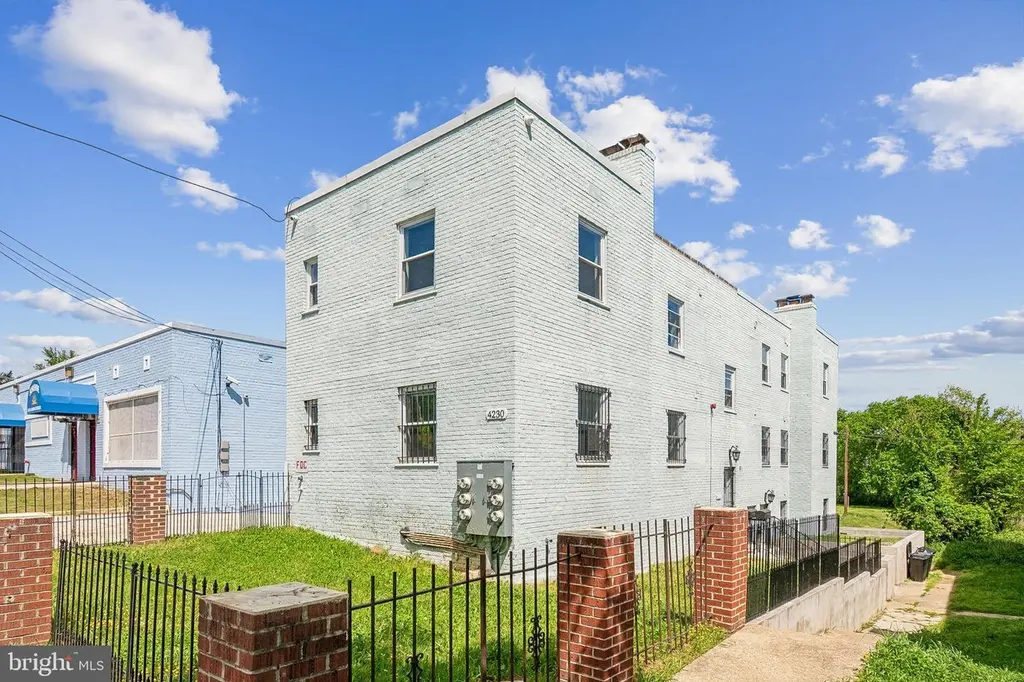
4230 6th St SE · Washington, DC
Flood risk 1/10 · Minimal
- FEMA flood zone
- X (unshaded)
- Chance of flooding over 30 yrs
- 0.0%
- Est. flood insurance / yr
- $507 – $1,088
Fire risk 3/10 · Minor
- Est. fire insurance / yr
- $631 – $1,173
Heat risk 8/10 · Major
- Hot days now (above 104°F)
- 7 days/yr
- Hot days in 30 yrs
- 16 days/yr
Wind risk 4/10 · Minor
- Chance of severe wind over 30 yrs
- 18.0%
Air-quality risk 3/10 · Minor
- Unhealthy air days now
- 2 days/yr
- Unhealthy air days in 30 yrs
- 3 days/yr
Risk factors via First Street. Map © Google.
Why this score? — see what drove the C- grade
The composite is a weighted blend of 9 inputs, each scored 0–100. Each bar is that input's sub-score; the figure is the points it added to the 100-point composite (weight × sub-score).
- Cash flow +21.5/30.0
- ARV discount +7.5/15.0
- DSCR +6.9/10.0
- 1% rule +4.4/10.0
- Livability +3.7/5.0
- Schools +3.6/10.0
- Rent growth +3.5/5.0
- Condition / age +2.5/5.0
- Appreciation +0.0/10.0
$799,900
🖨 Deal sheet (PDF) 📄 Offer letter ✓ Due diligence
Multi-family units
County records classify this as Multi-Family (5+ Unit). Listing-text estimate: 5 units. confirmed
5+ unit building — per-unit beds/baths from public records are typically unavailable; the breakdown below (if shown) is an estimate from the listing text.
Listing remarks
Turnkey 5-unit multifamily in Congress Heights offering strong cash flow and long-term appreciation potential. This fully renovated asset features five well-designed 2BR/1BA units ( 625 sq ft each Aprox), with four units located inside the main building and one unit with a separate exterior entrance—ideal for added privacy or flexible leasing options. All units have been updated with stainless steel appliances, in-unit washer/dryer, LVP flooring, central heating & cooling, and modern finishes to attract and retain quality tenants. Comprehensively renovated in 2025, the property requires no major capital improvements and delivers projected gross annual rents exceeding $94,000 wit
Key facts
- 6,462 sq ft lot
- Built 1953
- Listed 50 days
Property features AI
Finance
- Other: Above-grade finished area reported as 3,236 (source: Assessor)
- Financial info: Fee simple ownership; Total actual rent reported: $93,420
Exterior
- Parking: On-street parking
- Utilities: Public water; Public sewer; 120/240V electric service; Hot water: natural gas
- Home design: Detached structure; 3 total levels; Flat / built-up roof
- Construction: Brick construction; Slab foundation; Effective year of major renovation: 2025; Year built source: Assessor
- Exterior features: Level lot; Walkout-level basement
Interior
- Kitchen: Refrigerator; Stove; Dishwasher
- Bedrooms: Five 2-bedroom units (multi-unit property)
- Flooring: Vinyl
- Heating & cooling: Forced air heating (natural gas); Central air conditioning (electric)
- Interior features: 9'+ ceilings; Vinyl flooring
- Laundry & utility: Washer; Dryer
Neighborhood map
What this means for you Summary
Snapshot
- This is a 5 × 2.0-bed/1.0-bath units multifamily listed at $800k.
Deal economics
- At list price, monthly cash flow is $1k ($14k/yr) — positive. Per door: $240/mo.
- The deal already cash-flows at list — no discount required.
- To meet the 1% rule (rent ≥ 1% of price), the offer needs to be $753k (5.8% below list).
- Recommended offer: $753k (5.8% below list) — sets the bar for 1% rule.
- Cap rate 8.1% vs local median 2.5% in Washington — top-decile yield for the area; either an underpriced asset or a hidden risk that comps aren't pricing in. Stress-test before assuming the spread holds.
Location & tenants
- Location reads 73/100 on livability (#1 in DC) — a middle-class / working-renter tenant base. Strengths: amenities A+, commute A+, employment A+; Watch: crime F, cost of living F.
- District Of Columbia Public Schools (urban): math 33% / reading 40% proficiency, ranked #8 of 32 in DC (top 25%) — families likely to look elsewhere, expect single-tenant / working-renter base with shorter leases; 65% free/reduced lunch — lower-income household profile, screen leases tightly.
- Zoned schools: Hendley Es (289 students, 0% FRL); Hart Ms (386 students, 0% FRL); Ballou Hs (657 students, 0% FRL) — zoned schools average 0% FRL vs 65% district-wide (65 pts lower); this property's tenant base skews higher-income than the district average.
- Market conditions: Rents rising (+4.0%/yr); 145 active listings in the ZIP; 1,737 units permitted in District of Columbia in 2024 (1,506 in 5+ unit buildings).
- At $7,534/mo this rent would consume 184% of the median local household income ($49k/yr) (locally 4530% of renters already pay >50% of income on rent) — very limited rent-growth headroom before tenants either downsize or default.
Forward outlook
- Local home prices are declining (-3.0%/yr); year-one equity from $6k of loan paydown is wiped out by about $24k of value loss. Plan a longer hold.
- District of Columbia County population projected at +50% by 2050 — long-run rental-demand tailwind backs the buy-and-hold thesis.
Negotiation context
- It's been on market 51 days — a 3% lower offer ($776k) is reasonable based on typical stale-listing flexibility.
- 6 sale attempts since 32y ago; this cycle's ask has dropped $50k (6%) from the opening price — seller is motivated, your offer sets the floor, not the list.
- Current owner paid $229k; list at $800k implies a 249% gain — meaningful room to come down on a strong offer.
Risks & watch-outs
- Watch-outs: built in 1953 — expect roof / HVAC / electrical / plumbing capex.
- Climate carrying-cost: extreme-heat days projected 7→16/yr by 2055 (HVAC capex compounding) — expect insurance premiums to compound above CPI over the hold.
Questions for the listing agent
- It's been on market 51 days. Have you received any prior offers? Is the seller open to a 6% concession, seller financing, or rate buy-down credit?
- Can we see the unit-by-unit rent roll, current vacancy, and any below-market leases? What's the average tenancy length?
- What capital expenditures (roof, boiler, parking lot, exteriors) have been made in the last 5 years, and what's planned in the next 2?
- Built in 1953 — when were the roof, HVAC, electrical panel, plumbing, and water heater last replaced?
- Is there a deadline driving the sale (1031 exchange, divorce, estate, relocation)? That informs how much negotiation room exists.
- Crime grade is F in this area — have there been break-ins, vandalism, or insurance claims at this property in the last 3 years? What carrier currently insures it and at what premium?
- What's the average days-on-market for RENTAL listings here right now (not sales)? A rising rental-DOM trend means longer vacancies and softer asking-rent achievability than the comps imply.
- What's the recent tenant-quality profile in this submarket — average credit score on applications, eviction rate, late-payment / NSF rate, and stable-employment percentage? A property-management company in the area should have these aggregated.
- How much new apartment / multifamily construction is in the pipeline within 1–3 miles? Heavy new supply (>2% of stock underway) typically softens rents 12–24 months out; light construction supports rent growth.
Investment metrics
- 1% rule
- 0.94% ✗
- Cap rate
- 8.09%
- Cash-on-cash
- 6.42%
- DSCR
- 1.29
- GRM
- 8.8
CMA / ARV
No comps found within radius.
Projected returns pro-forma
-3.0% appreciation · 3.96% rent growth · sell at horizon
- IRR
- -5.5%
- Equity multiple
- 0.79×
- Total profit
- $-46,281
- Equity at exit
- $119,268
- IRR
- 5.1%
- Equity multiple
- 1.39×
- Total profit
- $87,284
- Equity at exit
- $69,161
Cash invested: $223,972 (down + closing). Projections, not guarantees.
Landlord ↔ Tenant lean methodology
- Overall (CITY)
- 0 Strongly Tenant-Friendly
- State District of Columbia
- 12 Strongly Tenant-Friendly · D+43
- County
- — inherits STATE
- City Washington
- 0 Strongly Tenant-Friendly · D+43
ZIP-level market 20032
- Home prices YoY
- -15.6%
- Rents YoY
- 4.0%
- Active inventory
- 145
- Price-to-rent
- 44.2×
Monthly cashflow live
- Estimated rent
- $7,534 high interval (Pro) →
- Mortgage (P&I)
- −$4,195
- Tax from tax record
- −$225 /mo · $2,700/yr
- Insurance
- −$333
- HOA
- −$0
- Vacancy / Maint / Mgmt
- −$1,582
- Net cashflow
- $1,199
Break-even live
Sensitivity live
| Price | -10% $1,652 | -5% $1,425 | +0% $1,199 | +5% $972 | +10% $746 |
|---|---|---|---|---|---|
| Rent | -10% $604 | -5% $901 | +0% $1,199 | +5% $1,496 | +10% $1,794 |
| Rate | -1.0pp $1,602 | -0.5pp $1,402 | base $1,199 | +0.5pp $992 | +1.0pp $781 |
5-unit breakdown (identical units grouped — click to expand)
| Units | Beds | Baths | Est. rent |
|---|---|---|---|
| 5× units | 2.0 | 1 | $7,535 |
| #1 | 2.0 | 1 | $1,507 |
| #2 | 2.0 | 1 | $1,507 |
| #3 | 2.0 | 1 | $1,507 |
| #4 | 2.0 | 1 | $1,507 |
| #5 | 2.0 | 1 | $1,507 |
| Total (5 units) | $7,534 | ||
UW: 25.0% down · 7.5% · 30yr · 1.5% tax · 5.0% vac · 8.0% maint · 8.0% mgmt
Financing live
Cash to close
- Down payment
- $199,975
- Closing costs
- $23,997
- Reserves months
- —
- Total cash needed
- —
Loan-product check · same deal, 3 products live
Conventional
25% down · 7.5% · 30yr
- Down + closing
- —
- Monthly P&I
- —
- Monthly cashflow
- —
- DSCR
- —
- Eligible?
- —
Personal DTI + credit; lowest rate.
DSCR
20% down · 8.5% · 30yr
- Down + closing
- —
- Monthly P&I
- —
- Monthly cashflow
- —
- DSCR
- —
- Eligible?
- —
No personal income docs; deal must DSCR.
Hard money
10% down · 12.0% · 12mo
- Down + closing
- —
- Monthly P&I
- —
- Monthly cashflow
- —
- DSCR
- —
- Eligible?
- —
Short-term bridge; refi at stabilization.
Listing history 34 events
-
2026-06-18days on market $799,900 Active 51 DOM
-
2026-06-17days on market $799,900 Active 50 DOM
-
2026-06-16days on market $799,900 Active 49 DOM
-
2026-06-15pricedays on market $799,900 Active 48 DOM
-
2026-06-13days on market $849,900 Active 46 DOM
-
2026-06-09days on market $849,900 Active 42 DOM
-
2026-06-08days on market $849,900 Active 41 DOM
-
2026-06-07days on market $849,900 Active 40 DOM
-
2026-06-04days on market $849,900 Active 37 DOM
-
2026-06-03days on market $849,900 Active 36 DOM
-
2026-06-02days on market $849,900 Active 35 DOM
-
2026-06-01days on market $849,900 Active 34 DOM
-
2026-05-31days on market $849,900 Active 33 DOM
-
2026-04-29$849,900 Active
-
2026-04-23historical $849,900
-
2025-09-15historical
-
2025-08-13$850,000 Active
-
2022-12-02historical
-
2021-11-02historical
-
2021-06-09price $775,000
-
2021-05-24$799,900 Active
-
2008-07-23soldstatus $229,000
-
2005-04-26soldstatus $345,000
-
2004-04-21soldstatus $245,000
-
2004-03-31soldstatus $250,000
-
2003-12-09historical
-
2003-11-22$250,000
-
2002-10-17soldstatus $160,000
-
2001-06-18soldstatus $62,800
-
2001-02-07historical
-
2000-08-31$31,500
-
1994-10-31soldstatus $34,000
-
1994-07-21historical
-
1994-07-21$34,000
ⓘ Source: listings_history table (triggers on properties + properties_extension) + one-shot
backfill from property_details.listing_events for pre-trigger history.
Tax reassessment forecast DC · Partial reset (capped growth)
- Current annual tax
- $2,700 · $225/mo
- Projected year-2 tax
- $3,790 · $316/mo
- Expected delta
- +$1,090/yr (+$91/mo · 40.4%)
ⓘ Screening estimate from a state-policy table — verify with the county assessor before closing.
Climate risk First Street
- Flood 1/10 Low FEMA zone X (unshaded) · 0% chance over 30 yrs
- Wildfire 3/10 Moderate
- Heat 8/10 Severe 7 d/yr ≥104°F today · 16 d/yr by 30 yrs out
- Wind 4/10 Moderate 18% chance of damaging wind over 30 yrs
- Air quality 3/10 Moderate 2 unhealthy d/yr today · 3 by 30 yrs out
Nearby sold comps map
Loading sold comps map…
Walkable amenities ~0.75 mi
Loading nearby amenities…
Taxation est. · year 1
- Rental income
- $90,408
- − Mortgage interest
- −$44,807
- − Property taxes
- −$2,700
- − Insurance
- −$4,000
- − Repairs & maintenance
- −$7,233
- − Management
- −$7,233
- − Depreciation
- −$23,270
- Taxable income
- $1,167
- Est. tax owed @ 24.0%
- −$280
- After-tax cash flow
- $14,106/yr
For passive investors: Depreciation is non-cash, so a rental often shows a tax loss while cash-flowing — sheltering income. Rental losses are passive: they offset passive income freely, and up to $25,000/yr can offset ordinary (W-2) income if you actively participate and your MAGI is under $100k (phasing out to $0 by $150k); unused losses carry forward. On sale, claimed depreciation is recaptured at up to 25%, and gains may owe capital-gains tax (a 1031 exchange can defer both). Figures are a year-1 estimate at your 24.0% rate — not tax advice; consult a CPA.
Schools (NCES district)
- District
- District Of Columbia Public Schools
- NCES district ID
- 1100030
- Math proficiency
- 33% ▲ 3.00%
- Reading proficiency
- 40% ▲ 5.00%
- Median HH income
- $67,671
- Composite
- 35.84/100
- National rank
- #9606
- State rank
- #8 of 32 in DC
Livability — Washington
- Score
- 73/100
- State rank
- #1
- US rank
- #5327
Category grades
Schools grade is shown separately in the Schools card above.
Census & demographics
- Census place
- Washington, DC
- County
- District of Columbia · 671,873 people
- City population
- 671,873
- Metro
- Washington-Arlington-Alexandria, DC-VA-MD-WV
- Population (ZIP)
- 40,920
- Household income
- $49,139
- Rent vs Own
- Severe rent burden
- 4530.0
Population outlook (District of Columbia County) Hauer SSP2
- Today (2025)
- 821,926 people
- By 2030
- 899,517 · +9.4%
- By 2040
- 1,061,162 · +29.1%
- By 2050
- 1,231,493 · +49.8%
- By 2075
- 1,603,312 · +95.1%
- By 2100
- 1,847,141 · +124.7%
Race, ethnicity, and origin ACS 2023
- Neighborhood character
- Predominantly Black (80%)
- Race & ethnicity
- Black 80% White 8% Two or more races 7% Hispanic / Latino 5%
- Foreign-born
- 4% · Canada
- Languages at home
- 95% English-only · Spanish 3%
Political lean MEDSL · District of Columbia
- 2024 margin
- Solid D (+86.1) · D 91.2% · R 5.1% · Other 3.8%
- 2008→2024 swing
- +0.1pp no change · 2008: 85.9pp · 2024: 86.1pp
- All cycles
- 2024: D+86.1 2020: D+86.8 2016: D+88.7 2012: D+84.2 2008: D+85.9
Not yet ingested
- Civics
- —
Market trends
- HPI YoY
- ▼ -60.34%
- Current HPI
- 326.4077
- Rent YoY
- ▲ 3.96%
- Metro
- Washington-Arlington-Alexandria, DC-VA-MD-WV
- State GDP YoY
- ▲ 1.33%
- F500 in state
- 6
Industry mix (Fortune 500 HQ in DC)
| Industry | F500 HQs | Revenue |
|---|---|---|
| Financial Services | 1 | $153B |
|
||
| Life Sciences / Industrials | 1 | $25B |
|
||
| Industrial Machinery | 1 | $8B |
|
||
Price history
+2399.7% since first listed21 events — show timeline
- 2026-04-29 Listed $849,900 BRIGHT MLS
- 2026-04-23 Coming Soon $849,900 BRIGHT MLS
- 2025-09-15 Listing Removed — BRIGHT MLS
- 2025-08-13 Listed $850,000 BRIGHT MLS
- 2022-12-02 Rental Removed — BRIGHTMLS
- 2021-11-02 Listing Removed — BRIGHT MLS
- 2021-06-09 Price Changed $775,000 BRIGHT MLS
- 2021-05-24 Listed $799,900 BRIGHT MLS
- 2008-07-23 Sold (Public Records) $229,000 Public Records
- 2005-04-26 Sold (Public Records) $345,000 Public Records
- 2004-04-21 Sold (Public Records) $245,000 Public Records
- 2004-03-31 Sold (MLS) $250,000 MRIS
- 2003-12-09 Delisted — MRIS
- 2003-11-22 Listed $250,000 MRIS
- 2002-10-17 Sold (Public Records) $160,000 Public Records
- 2001-06-18 Sold (MLS) $62,800 MRIS
- 2001-02-07 Delisted — MRIS
- 2000-08-31 Listed $31,500 MRIS
- 1994-10-31 Sold (MLS) $34,000 MRIS
- 1994-07-21 Listed $34,000 MRIS
- 1994-07-21 Delisted — MRIS
Property tax history
-12.5%/yrLatest (2025): $2,700 · -18.0% YoY. Source: county tax records.
Cash-flow waterfall
monthlySold comps — $/sqft
last 12 mo · ≤1 miLoading sold comps…