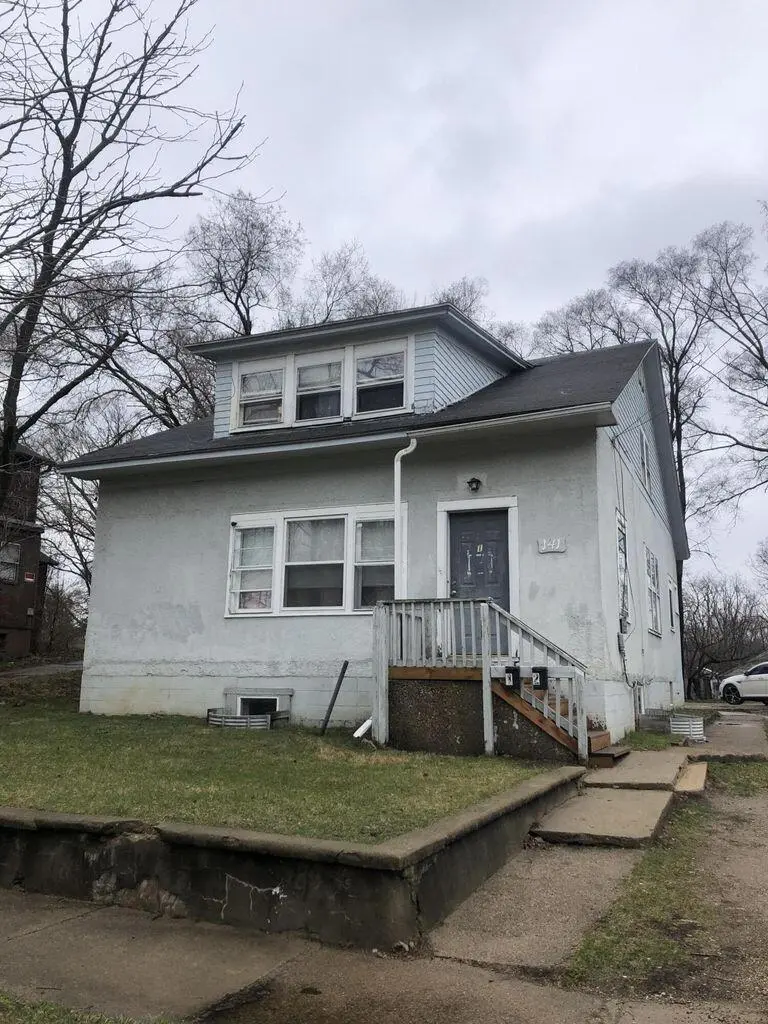
141 Reed St · Kalamazoo, MI
Flood risk 1/10 · Minimal
- FEMA flood zone
- X (unshaded)
- Chance of flooding over 30 yrs
- 0.0%
- Est. flood insurance / yr
- $507 – $1,088
Fire risk 1/10 · Minimal
- Est. fire insurance / yr
- $784 – $1,456
Heat risk 2/10 · Minimal
- Hot days now (above 98°F)
- 7 days/yr
- Hot days in 30 yrs
- 16 days/yr
Wind risk 2/10 · Minimal
- Chance of severe wind over 30 yrs
- —
Air-quality risk 2/10 · Minimal
- Unhealthy air days now
- 1 days/yr
- Unhealthy air days in 30 yrs
- 2 days/yr
Risk factors via First Street. Map © Google.
Why this score? — see what drove the B grade
The composite is a weighted blend of 9 inputs, each scored 0–100. Each bar is that input's sub-score; the figure is the points it added to the 100-point composite (weight × sub-score).
- Cash flow +30.0/30.0
- 1% rule +10.0/10.0
- DSCR +10.0/10.0
- ARV discount +7.5/15.0
- Schools +4.7/10.0
- Rent growth +4.1/5.0
- Livability +3.8/5.0
- Condition / age +2.5/5.0
- Appreciation +0.0/10.0
$104,900
🖨 Deal sheet 📄 Offer letter ✓ Due diligence
Listing remarks MLS
New Roof on this Kalamazoo duplex, each unit is a 3 bed 1 full bath. This duplex has had some updates done to it as of recent. Property includes a basement that presents potential for conversion into a third unit. The upside is there for more rental income, subject to municipal approval. Professionally managed and rents at or near market rents, call for financials. 24 hour notice for showings is a must. call today!
Key facts
- Basement potential
- Rental income
- New roof
Tags
Property features AI
Finance
- Other: Lot approximately 66 x 132 (0.2 acre)
- Financial info: One unit currently rented for $850 per month; One unit currently rented for $800 per month; Annual tax amount reported as $3,500
Exterior
- Parking: 4 total parking spaces
- Utilities: Public water; Public sewer; Electricity connected; Natural gas connected; Cable connected; Phone connected
- Home design: Multi-family residential income property
- Construction: Stucco exterior; Composition roof
- Exterior features: Paved public road access; Residential zoning
Interior
- Bedrooms: Two units each with 3 bedrooms
- Bathrooms: Each unit has 1 bathroom
- Heating & cooling: Forced-air heating; Natural gas heating
- Interior features: Full basement
Neighborhood map
What this means for you Summary
Snapshot
- This is a 3-bed/2.0-bath single-family listed at $105k.
Deal economics
- At list price, monthly cash flow is $848 ($10k/yr) — positive.
- The deal already cash-flows at list — no discount required.
- Meets the 1% rule at list price ($2k rent vs $105k).
- Recommended offer: $103k (1.5% below list) — sets the bar for market timing.
- Cap rate 16.0% vs local median 4.1% in Kalamazoo — top-decile yield for the area; either an underpriced asset or a hidden risk that comps aren't pricing in. Stress-test before assuming the spread holds.
Location & tenants
- Location reads 76/100 on livability (#141 in MI, #3,492 nationally) — a middle-class / working-renter tenant base. Strengths: commute A+, cost of living A+, housing A+; Watch: crime F, employment D-.
- Kalamazoo Public Schools (urban): math 43% / reading 72% proficiency, ranked #71 of 540 in MI (top 13%) — acceptable for families but not a draw, mixed tenant base, ~2y average lease; 66% free/reduced lunch — lower-income household profile, screen leases tightly.
- Market conditions: Rents rising fast (+6.4%/yr); 109 active listings in the ZIP; 5 comparable units currently listed for rent nearby; rentals leasing fast (median 14d on market — plan ~1-2 weeks tenant-placement turnaround); 339 units permitted in Kalamazoo County in 2024 (22 in 5+ unit buildings).
- At $2,194/mo this rent would consume 47% of the median local household income ($56k/yr) (locally 1184% of renters already pay >50% of income on rent) — very limited rent-growth headroom before tenants either downsize or default.
Forward outlook
- Local home prices are declining (-3.0%/yr); year-one equity from $725 of loan paydown is wiped out by about $3k of value loss. Plan a longer hold.
- Kalamazoo County population projected at +18% by 2050 — long-run rental-demand tailwind backs the buy-and-hold thesis.
- At projected returns (-3.0% appreciation + 6.4% rent growth), your $29k cash investment doubles in ~4 years — after that, you're playing with house money.
Negotiation context
- It's been on market 29 days — a 2% lower offer ($103k) is reasonable based on typical stale-listing flexibility.
- 23 sale attempts since 32y ago; this cycle's ask has dropped $10k (9%) from the opening price — seller is motivated, your offer sets the floor, not the list.
Risks & watch-outs
- Watch-outs: property tax is 3.3% of price; built in 1907 — expect roof / HVAC / electrical / plumbing capex.
Questions for the listing agent
- Built in 1907 — when were the roof, HVAC, electrical panel, plumbing, and water heater last replaced?
- Property tax is high relative to price — has the assessment been appealed recently, and will the sale trigger a re-assessment?
- Is there a deadline driving the sale (1031 exchange, divorce, estate, relocation)? That informs how much negotiation room exists.
- Crime grade is F in this area — have there been break-ins, vandalism, or insurance claims at this property in the last 3 years? What carrier currently insures it and at what premium?
- What's the average days-on-market for RENTAL listings here right now (not sales)? A rising rental-DOM trend means longer vacancies and softer asking-rent achievability than the comps imply.
- What's the recent tenant-quality profile in this submarket — average credit score on applications, eviction rate, late-payment / NSF rate, and stable-employment percentage? A property-management company in the area should have these aggregated.
- How much new for-sale + rental construction is in the pipeline within 1–3 miles? Heavy new supply typically softens prices + rents 12–24 months out; constrained supply supports both.
Investment metrics
- 1% rule
- 2.09% ✓
- Cap rate
- 16.00%
- Cash-on-cash
- 34.66%
- DSCR
- 2.54
- GRM
- 4.0
CMA / ARV
- ARV (on-the-fly)
- $264,600
- Comps found
- 12
Show comp detail 12 sales within ~0.75 mi
| Address | Dist | Beds/Ba | Sqft | Sold | Price | $/sf | Match |
|---|---|---|---|---|---|---|---|
| 2412 Glenwood Dr | 0.75mi | 3/2.5 | 1,802 (+2%) | 1mo | $310,000 | $172 | 59 |
| 2332 S Rose St | 0.52mi | 3/1.5 | 1,880 (+7%) | 7mo | $288,250 | $153 | 57 |
| 2327 Outlook St | 0.51mi | 3/2.0 | 1,568 (-11%) | 2mo | $193,000 | $123 | 56 |
| 2133 S Burdick St | 0.36mi | 4/2.0 (+1) | 1,519 (-14%) | 1mo | $240,000 | $158 | 54 |
| 2338 Glenwood Dr | 0.71mi | 3/3.5 | 1,711 (-3%) | 3mo | $418,000 | $244 | 54 |
| 117 Edgemoor Ave | 0.66mi | 3/1.5 | 1,918 (+9%) | 4mo | $286,000 | $149 | 49 |
| 1006 Hays Park Ave | 0.71mi | 4/2.0 (+1) | 1,613 (-9%) | 1mo | $185,000 | $115 | 47 |
| 2313 S Westnedge Ave | 0.60mi | 4/2.0 (+1) | 1,540 (-13%) | 4mo | $240,000 | $156 | 42 |
| 215 Inkster Ave | 0.58mi | 2/2.0 (-1) | 1,546 (-12%) | 8mo | $232,000 | $150 | 41 |
| 855 Lay Blvd | 0.62mi | 3/1.5 | 1,510 (-14%) | 6mo | $160,000 | $106 | 40 |
| 1002 Egleston Ave | 0.71mi | 3/2.0 | 1,978 (+12%) | 8mo | $130,000 | $66 | 40 |
| 1009 Oak St | 0.74mi | 4/2.0 (+1) | 1,526 (-14%) | 7mo | $141,000 | $92 | 32 |
Match score weights: distance 35% · size 25% · config 20% · recency 20%. Top-matched comps best support the ARV.
Projected returns pro-forma
-3.0% appreciation · 6.41% rent growth · sell at horizon
- IRR
- 34.4%
- Equity multiple
- 2.53×
- Total profit
- $44,957
- Equity at exit
- $15,641
- IRR
- 43.2%
- Equity multiple
- 5.89×
- Total profit
- $143,537
- Equity at exit
- $9,070
Cash invested: $29,372 (down + closing). Projections, not guarantees.
Landlord ↔ Tenant lean methodology
- Overall (STATE)
- 62 Landlord-Friendly
- State Michigan
- 62 Landlord-Friendly · EVEN
- County
- — inherits STATE
- City
- — inherits STATE
ZIP-level market 49001
- Rents YoY
- 6.4%
- Active inventory
- 109
- Price-to-rent
- 4.0×
Monthly cashflow live
- Estimated rent
- $2,194 medium interval (Pro) →
- Mortgage (P&I)
- −$550
- Tax from tax record
- −$291 /mo · $3,495/yr
- Insurance
- −$44
- HOA
- −$0
- Vacancy / Maint / Mgmt
- −$461
- Net cashflow
- $848
Break-even live
UW: 25.0% down · 7.5% · 30yr · 1.5% tax · 5.0% vac · 8.0% maint · 8.0% mgmt
Financing live
Cash to close
- Down payment
- $26,225
- Closing costs
- $3,147
- Reserves months
- —
- Total cash needed
- —
Loan-product check · same deal, 3 products live
Conventional
25% down · 7.5% · 30yr
- Down + closing
- —
- Monthly P&I
- —
- Monthly cashflow
- —
- DSCR
- —
- Eligible?
- —
Personal DTI + credit; lowest rate.
DSCR
20% down · 8.5% · 30yr
- Down + closing
- —
- Monthly P&I
- —
- Monthly cashflow
- —
- DSCR
- —
- Eligible?
- —
No personal income docs; deal must DSCR.
Hard money
10% down · 12.0% · 12mo
- Down + closing
- —
- Monthly P&I
- —
- Monthly cashflow
- —
- DSCR
- —
- Eligible?
- —
Short-term bridge; refi at stabilization.
Rent comps 5 comps
| Address | Beds | Baths | Sqft | Rent | $/sqft | DOM | Units | Dist |
|---|---|---|---|---|---|---|---|---|
| 211 Rose Pl Kalamazoo, MI | 2.0 | 2.0 | 1695 | $1,200 | $0.71 | 21d | 1 | 0.65mi |
| 807 Central Park Cir Kalamazoo, MI | 1.0–3.0 | 1.0–2.0 | 1089 | $2,345 | $2.15 | 13d | 12 | 0.85mi |
| 525 S Burdick St Kalamazoo, MI | 2.0 | 2.0 | 1555 | $2,928 | $1.88 | 13d | 2 | 0.87mi |
| 125 S Kalamazoo Mall Kalamazoo, MI | 2.0 | 2.0 | 1833 | $3,088 | $1.68 | 13d | 1 | 1.18mi |
| 838 W Main St Kalamazoo, MI | 4.0 | 1.0 | 1470 | $1,300 | $0.88 | 21d | 1 | 1.45mi |
Listing history 50 events
-
2026-06-18days on market $104,900 Active 29 DOM
-
2026-06-17days on market $104,900 Active 28 DOM
-
2026-06-16days on market $104,900 Active 27 DOM
-
2026-06-15days on market $104,900 Active 26 DOM
-
2026-06-14days on market $104,900 Active 24 DOM
-
2026-06-13days on market $104,900 Active 23 DOM
-
2026-06-10days on market $104,900 Active 21 DOM
-
2026-06-09days on market $104,900 Active 20 DOM
-
2026-06-08days on market $104,900 Active 19 DOM
-
2026-06-07days on market $104,900 Active 18 DOM
-
2026-06-05days on market $104,900 Active 15 DOM
-
2026-06-03days on market $104,900 Active 14 DOM
-
2026-06-02pricedays on market $104,900 Active 13 DOM
-
2026-06-01days on market $114,900 Active 12 DOM
-
2026-05-31days on market $114,900 Active 11 DOM
-
2026-05-30days on market $114,900 Active 10 DOM
-
2026-05-20$114,900 Active 418-char remark
Show marketing remark (418 chars)
New Roof on this Kalamazoo duplex, each unit is a 3 bed 1 full bath. This duplex has had some updates done to it as of recent. Property includes a basement that presents potential for conversion into a third unit. The upside is there for more rental income, subject to municipal approval. Professionally managed and rents at or near market rents, call for financials. 24 hour notice for showings is a must. call today!
-
2026-05-20$114,900 Active
Show marketing remark (418 chars)
New Roof on this Kalamazoo duplex, each unit is a 3 bed 1 full bath. This duplex has had some updates done to it as of recent. Property includes a basement that presents potential for conversion into a third unit. The upside is there for more rental income, subject to municipal approval. Professionally managed and rents at or near market rents, call for financials. 24 hour notice for showings is a must. call today!
-
2026-05-16historical
-
2026-03-31price $115,000
-
2026-03-30price $115,000
-
2026-03-19status Active
-
2026-03-19status Active
-
2026-03-14status Pending
-
2026-03-14status Pending
-
2026-03-14historical
-
2026-02-28price $125,000
-
2026-02-27price $125,000
-
2026-01-30price $135,000
-
2026-01-29price $135,000
-
2026-01-13$142,900 Active
-
2026-01-13$142,900 Active
-
2026-01-10historical
-
2026-01-09historical
-
2026-01-03price $142,900
-
2026-01-02price $142,900
-
2025-11-15price $149,900
-
2025-11-14price $149,900
-
2025-10-10$162,500 Active
-
2025-10-10$162,500 Active
-
2024-05-01historical
-
2024-04-30historical
-
2024-03-01price $145,000
-
2024-03-01price $145,000
-
2024-02-29price $145,000
-
2024-01-30$155,000 Active
-
2024-01-30$155,000 Active
-
2022-08-25soldstatus $118,000 Sold
-
2022-08-25soldstatus $118,000 Sold
-
2022-07-19status Pending
ⓘ Source: listings_history table (triggers on properties + properties_extension) + one-shot
backfill from property_details.listing_events for pre-trigger history.
Tax reassessment forecast MI · Partial reset (capped growth)
- Current annual tax
- $3,495 · $291/mo
- Projected year-2 tax
- $3,495 · $291/mo
- Expected delta
- $0/yr ($0/mo · 0.0%)
ⓘ Screening estimate from a state-policy table — verify with the county assessor before closing.
Climate risk First Street
- Flood 1/10 Low FEMA zone X (unshaded) · 0% chance over 30 yrs
- Wildfire 1/10 Low
- Heat 2/10 Low 7 d/yr ≥98°F today · 16 d/yr by 30 yrs out
- Wind 2/10 Low
- Air quality 2/10 Low 1 unhealthy d/yr today · 2 by 30 yrs out
Nearby sold comps map
Loading sold comps map…
Walkable amenities ~0.75 mi
Loading nearby amenities…
Taxation est. · year 1
- Rental income
- $26,332
- − Mortgage interest
- −$5,876
- − Property taxes
- −$3,495
- − Insurance
- −$524
- − Repairs & maintenance
- −$2,107
- − Management
- −$2,107
- − Depreciation
- −$3,052
- Taxable income
- $9,172
- Est. tax owed @ 24.0%
- −$2,201
- After-tax cash flow
- $7,980/yr
For passive investors: Depreciation is non-cash, so a rental often shows a tax loss while cash-flowing — sheltering income. Rental losses are passive: they offset passive income freely, and up to $25,000/yr can offset ordinary (W-2) income if you actively participate and your MAGI is under $100k (phasing out to $0 by $150k); unused losses carry forward. On sale, claimed depreciation is recaptured at up to 25%, and gains may owe capital-gains tax (a 1031 exchange can defer both). Figures are a year-1 estimate at your 24.0% rate — not tax advice; consult a CPA.
Schools (NCES district)
- District
- Kalamazoo Public Schools
- NCES district ID
- 2619950
- Math proficiency
- 43% ▲ 13.00%
- Reading proficiency
- 72% ▲ 33.00%
- Median HH income
- $35,291
- Composite
- 47.48/100
- National rank
- #2275
- State rank
- #71 of 540 in MI
Livability — Kalamazoo
- Score
- 76/100
- State rank
- #141
- US rank
- #3492
Category grades
Schools grade is shown separately in the Schools card above.
Census & demographics
- Census place
- Kalamazoo, MI
- County
- Kalamazoo County · 224,317 people
- City population
- 121,397
- Metro
- Kalamazoo-Portage, MI
- Population (ZIP)
- 20,946
- Household income
- $56,432
- Rent vs Own
- Severe rent burden
- 1184.0
Population outlook (Kalamazoo County) Hauer SSP2
- Today (2025)
- 280,982 people
- By 2030
- 292,068 · +3.9%
- By 2040
- 312,191 · +11.1%
- By 2050
- 331,196 · +17.9%
- By 2075
- 379,021 · +34.9%
- By 2100
- 396,579 · +41.1%
Race, ethnicity, and origin ACS 2023
- Neighborhood character
- Diverse neighborhood (Simpson 0.59)
- Race & ethnicity
- White 58% Black 22% Hispanic / Latino 15% Two or more races 5% Asian 2% Native American 1%
- Hispanic origin (detail)
- Mexican 13%
- Common ancestry
- Romanian 6% Iranian 4% Slovak 3%
- Foreign-born
- 9% · Canada
- Languages at home
- 84% English-only · Spanish 11% Arabic 2% Other Indo-European 1%
Political lean MEDSL · Kalamazoo
- 2024 margin
- D (+17.7) · D 58.0% · R 40.3% · Other 1.7%
- 2008→2024 swing
- -1.8pp toward R · 2008: 19.5pp · 2024: 17.7pp
- All cycles
- 2024: D+17.7 2020: D+18.7 2016: D+12.8 2012: D+13.3 2008: D+19.5
Not yet ingested
- Civics
- —
Market trends
- HPI YoY
- ▼ -264.90%
- Current HPI
- 206.9355
- Rent YoY
- ▲ 6.41%
- Metro
- Kalamazoo-Portage, MI
- State GDP YoY
- ▲ 1.37%
- F500 in state
- 28
Industry mix (Fortune 500 HQ in MI)
| Industry | F500 HQs | Revenue |
|---|---|---|
| Automotive Parts | 3 | $48B |
|
||
| Automotive | 2 | $372B |
|
||
| Chemicals | 1 | $45B |
|
||
| Automotive Retail | 1 | $29B |
|
||
| Healthcare / Medical Devices | 1 | $23B |
|
||
| Automotive Technology | 1 | $20B |
|
||
Price history
+248.2% since first listed61 events — show timeline
- 2026-05-20 Listed $114,900 REALCOMP
- 2026-05-20 Listed $114,900 MiRealSource-MiMLS
- 2026-05-16 Listing Removed — MiRealSource-MiMLS
- 2026-03-31 Price Changed $115,000 MiRealSource-MiMLS
- 2026-03-30 Price Changed $115,000 REALCOMP
- 2026-03-19 Relisted — REALCOMP
- 2026-03-19 Relisted — MiRealSource-MiMLS
- 2026-03-14 Pending — REALCOMP
- 2026-03-14 Pending — MiRealSource-MiMLS
- 2026-03-14 Listing Removed — REALCOMP
- 2026-02-28 Price Changed $125,000 MiRealSource-MiMLS
- 2026-02-27 Price Changed $125,000 REALCOMP
- 2026-01-30 Price Changed $135,000 MiRealSource-MiMLS
- 2026-01-29 Price Changed $135,000 REALCOMP
- 2026-01-13 Listed $142,900 REALCOMP
- 2026-01-13 Listed $142,900 MiRealSource-MiMLS
- 2026-01-10 Listing Removed — MiRealSource-MiMLS
- 2026-01-09 Listing Removed — REALCOMP
- 2026-01-03 Price Changed $142,900 MiRealSource-MiMLS
- 2026-01-02 Price Changed $142,900 REALCOMP
- 2025-11-15 Price Changed $149,900 MiRealSource-MiMLS
- 2025-11-14 Price Changed $149,900 REALCOMP
- 2025-10-10 Listed $162,500 REALCOMP
- 2025-10-10 Listed $162,500 MiRealSource-MiMLS
- 2024-05-01 Listing Removed — MiRealSource-MiMLS
- 2024-04-30 Listing Removed — REALCOMP
- 2024-03-01 Price Changed $145,000 MiRealSource-MiMLS
- 2024-03-01 Price Changed $145,000 REALCOMP
- 2024-02-29 Price Changed $145,000 SW Michigan MLS
- 2024-01-30 Listed $155,000 MiRealSource-MiMLS
- 2024-01-30 Listed $155,000 REALCOMP
- 2022-08-25 Sold (MLS) $118,000 SW Michigan MLS
- 2022-08-25 Sold (MLS) $118,000 REALCOMP
- 2022-07-19 Pending — SW Michigan MLS
- 2022-07-06 Listing Removed — REALCOMP
- 2022-06-30 Listed $125,000 SW Michigan MLS
- 2022-06-30 Listed $125,000 REALCOMP
- 2017-04-06 Sold (MLS) $39,000 SW Michigan MLS
- 2017-04-06 Sold (MLS) $39,000 REALCOMP
- 2017-03-21 Pending — SW Michigan MLS
- 2017-03-16 Listed $45,000 SW Michigan MLS
- 2017-03-16 Listed $45,000 REALCOMP
- 2015-10-28 Listing Removed — SW Michigan MLS
- 2015-10-27 Listing Removed — REALCOMP
- 2015-09-05 Listed $32,900 SW Michigan MLS
- 2014-10-27 Listed $32,900 REALCOMP
- 2014-10-17 Listing Removed — SW Michigan MLS
- 2009-07-10 Sold (MLS) $16,000 SW Michigan MLS
- 2009-06-08 Listed $19,900 SW Michigan MLS
- 2008-11-03 Listing Removed — SW Michigan MLS
- 2008-07-15 Listed $79,000 SW Michigan MLS
- 2007-02-23 Sold (Public Records) $78,000 Public Records
- 2007-02-02 Sold (MLS) $78,000 SW Michigan MLS
- 2006-12-18 Listed $78,000 SW Michigan MLS
- 2006-08-03 Listing Removed — SW Michigan MLS
- 2005-11-07 Listed $85,900 SW Michigan MLS
- 2003-08-19 Sold (MLS) $19,000 REALCOMP
- 2003-08-19 Sold (MLS) $19,000 SW Michigan MLS
- 2003-06-26 Listed $19,900 REALCOMP
- 2003-06-26 Listed $19,900 SW Michigan MLS
- 1994-06-10 Listed $33,000 SW Michigan MLS
Property tax history
+8.7%/yrLatest (2025): $3,495 · +3.0% YoY. Source: county tax records.
Cash-flow waterfall
monthlySold comps — $/sqft
last 12 mo · ≤1 miLoading sold comps…