 Fourplex
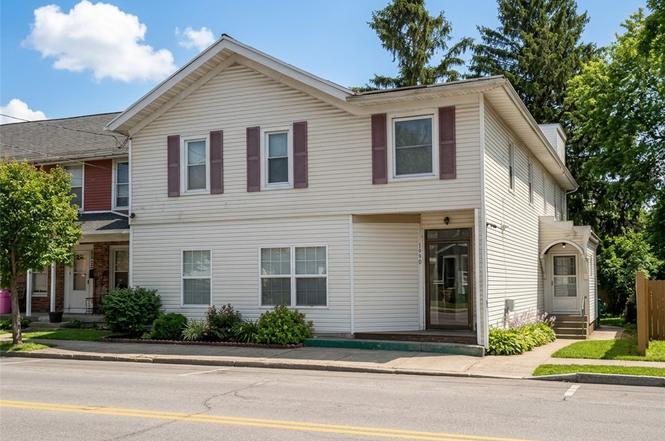
1990 Ridge Rd · Ontario, NY
Flood risk No data
- FEMA flood zone
- —
- Chance of flooding over 30 yrs
- —
- Est. flood insurance / yr
- —
Fire risk No data
- Est. fire insurance / yr
- —
Heat risk No data
- Hot days now (above threshold)
- —
- Hot days in 30 yrs
- —
Wind risk No data
- Chance of severe wind over 30 yrs
- —
Air-quality risk No data
- Unhealthy air days now
- —
- Unhealthy air days in 30 yrs
- —
Risk factors via First Street. Map © Google.
Why this score? — see what drove the C grade
The composite is a weighted blend of 9 inputs, each scored 0–100. Each bar is that input's sub-score; the figure is the points it added to the 100-point composite (weight × sub-score).
- Cash flow +23.2/30.0
- DSCR +7.5/10.0
- ARV discount +7.5/15.0
- 1% rule +6.0/10.0
- Schools +5.4/10.0
- Livability +3.6/5.0
- Rent growth +2.5/5.0
- Condition / age +2.5/5.0
- Appreciation +0.0/10.0
$675,000
🖨 Deal sheet (PDF) 📄 Offer letter ✓ Due diligence
Multi-family units
County records classify this as Multi-Family (2-4 Unit). Listing-text estimate: 4 units. confirmed
Listing remarks MLS
2 story building 4560 sf. 4 Rental's all tenant occupied. Also see 1988 Ridge right next door. MLS 418135 single family listed for $99,600
Key facts
- Spacious yard
- Rear deck
- 6,098 sq ft lot
Tags
Property features AI
Finance
- Other: Property configured as a 4-unit building; 4 total units and 4 units in community; Single gas meter for property; Single electric meter for property
- Financial info: Operating expenses include insurance, trash, utilities, and water/sewer; Owner pays: other/see remarks (some owner-paid items noted); Rent includes: see remarks
Exterior
- Parking: See remarks for parking details
- Utilities: Public water connected; Sewer connected
- Home design: Two-story building; Resale property
- Construction: Vinyl siding; Copper plumbing; Asphalt and rolled/hot mop roofing; Existing (previously built)
- Exterior features: Deck; Irregular lot shape; Lot dimensions approximately 43 x 165
Interior
- Kitchen: Appliances: water heater (other kitchen appliance details listed as 'See Remarks')
- Bedrooms: 4 full bathrooms noted (property has multiple units; see Bathrooms for details)
- Flooring: Carpet; Vinyl; Varies
- Bathrooms: 4 full bathrooms
- Heating & cooling: Gas heating; Baseboard heating; Has heating
- Interior features: Ceiling fans; Egress windows in basement; Other/see remarks (additional interior details noted)
- Laundry & utility: Utilities and some equipment referenced under remarks
Neighborhood map
What this means for you Summary
Snapshot
- This is a 4 × 2-bed/1.0-bath units multifamily listed at $675k.
Deal economics
- At list price, monthly cash flow is $1k ($15k/yr) — positive. Per door: $307/mo.
- The deal already cash-flows at list — no discount required.
- Meets the 1% rule at list price ($7k rent vs $675k).
- Cap rate 8.5% vs local median 3.3% in Ontario — top-decile yield for the area; either an underpriced asset or a hidden risk that comps aren't pricing in. Stress-test before assuming the spread holds.
Location & tenants
- Location reads 71/100 on livability (#385 in NY) — a middle-class / working-renter tenant base. Strengths: housing A+, crime A-, cost of living B+; Watch: commute D, amenities F, health & safety D-.
- Wayne Central School District (suburban): math 57% / reading 68% proficiency, ranked #194 of 590 in NY (top 33%) — acceptable for families but not a draw, mixed tenant base, ~2y average lease.
- Market conditions: 87 active listings in the ZIP; 259 units permitted in Wayne County in 2024 (90 in 5+ unit buildings).
Forward outlook
- Local home prices are declining (-3.0%/yr); year-one equity from $5k of loan paydown is wiped out by about $20k of value loss. Plan a longer hold.
- Wayne County population projected at -24% by 2050 — secular population decline; favor cash flow + early exit over multi-decade hold.
Negotiation context
- Only 2 days on market — expect competitive offers; lowballing is unlikely to land.
- 3 sale attempts since 22y ago with the ask held roughly flat each time — persistent listings suggest the price (not the market) is what's stuck; bring a comps-based counter.
- Current owner paid $65k; list at $675k implies a 938% gain — meaningful room to come down on a strong offer.
Risks & watch-outs
- Watch-outs: built in 1875 — expect roof / HVAC / electrical / plumbing capex.
Questions for the listing agent
- Can we see the unit-by-unit rent roll, current vacancy, and any below-market leases? What's the average tenancy length?
- What capital expenditures (roof, boiler, parking lot, exteriors) have been made in the last 5 years, and what's planned in the next 2?
- Built in 1875 — when were the roof, HVAC, electrical panel, plumbing, and water heater last replaced?
- Is there a deadline driving the sale (1031 exchange, divorce, estate, relocation)? That informs how much negotiation room exists.
- What's the average days-on-market for RENTAL listings here right now (not sales)? A rising rental-DOM trend means longer vacancies and softer asking-rent achievability than the comps imply.
- What's the recent tenant-quality profile in this submarket — average credit score on applications, eviction rate, late-payment / NSF rate, and stable-employment percentage? A property-management company in the area should have these aggregated.
- How much new apartment / multifamily construction is in the pipeline within 1–3 miles? Heavy new supply (>2% of stock underway) typically softens rents 12–24 months out; light construction supports rent growth.
Investment metrics
- 1% rule
- 1.10% ✓
- Cap rate
- 8.47%
- Cash-on-cash
- 7.79%
- DSCR
- 1.35
- GRM
- 7.5
CMA / ARV
No comps found within radius.
Projected returns pro-forma
-3.0% appreciation · 3.0% rent growth · sell at horizon
- IRR
- -4.4%
- Equity multiple
- 0.84×
- Total profit
- $-31,115
- Equity at exit
- $100,645
- IRR
- 5.3%
- Equity multiple
- 1.39×
- Total profit
- $73,995
- Equity at exit
- $58,362
Cash invested: $189,000 (down + closing). Projections, not guarantees.
Landlord ↔ Tenant lean methodology
- Overall (STATE)
- 15 Strongly Tenant-Friendly
- State New York
- 15 Strongly Tenant-Friendly · D+10
- County
- — inherits STATE
- City
- — inherits STATE
ZIP-level market 14519
- Home prices YoY
- -26.1%
- Active inventory
- 87
- Price-to-rent
- 30.2×
Monthly cashflow live
- Estimated rent
- $7,458 medium interval (Pro) →
- Mortgage (P&I)
- −$3,540
- Tax est. 1.5%
- −$844 /mo · $10,125/yr
- Insurance
- −$281
- HOA
- −$0
- Vacancy / Maint / Mgmt
- −$1,566
- Net cashflow
- $1,227
Break-even live
Sensitivity live
| Price | -10% $1,694 | -5% $1,460 | +0% $1,227 | +5% $994 | +10% $761 |
|---|---|---|---|---|---|
| Rent | -10% $638 | -5% $932 | +0% $1,227 | +5% $1,522 | +10% $1,816 |
| Rate | -1.0pp $1,567 | -0.5pp $1,399 | base $1,227 | +0.5pp $1,052 | +1.0pp $874 |
4-unit breakdown (identical units grouped — click to expand)
| Units | Beds | Baths | Est. rent |
|---|---|---|---|
| 4× units | 2 | 1 | $7,460 |
| #1 | 2 | 1 | $1,865 |
| #2 | 2 | 1 | $1,865 |
| #3 | 2 | 1 | $1,865 |
| #4 | 2 | 1 | $1,865 |
| Total (4 units) | $7,458 | ||
UW: 25.0% down · 7.5% · 30yr · 1.5% tax · 5.0% vac · 8.0% maint · 8.0% mgmt
Financing live
Cash to close
- Down payment
- $168,750
- Closing costs
- $20,250
- Reserves months
- —
- Total cash needed
- —
Loan-product check · same deal, 3 products live
Conventional
25% down · 7.5% · 30yr
- Down + closing
- —
- Monthly P&I
- —
- Monthly cashflow
- —
- DSCR
- —
- Eligible?
- —
Personal DTI + credit; lowest rate.
DSCR
20% down · 8.5% · 30yr
- Down + closing
- —
- Monthly P&I
- —
- Monthly cashflow
- —
- DSCR
- —
- Eligible?
- —
No personal income docs; deal must DSCR.
Hard money
10% down · 12.0% · 12mo
- Down + closing
- —
- Monthly P&I
- —
- Monthly cashflow
- —
- DSCR
- —
- Eligible?
- —
Short-term bridge; refi at stabilization.
Listing history 18 events
-
2026-06-21days on market $675,000 Active 2 DOM
-
2026-06-18days on market $675,000 Active 57 DOM
-
2026-06-17days on market $675,000 Active 56 DOM
-
2026-06-16days on market $675,000 Active 55 DOM
-
2026-06-15days on market $675,000 Active 54 DOM
-
2026-06-13days on market $675,000 Active 52 DOM
-
2026-06-13days on market $675,000 Active 51 DOM
-
2026-06-10days on market $675,000 Active 49 DOM
-
2026-06-09days on market $675,000 Active 48 DOM
-
2026-06-09days on market $675,000 Active 47 DOM
-
2026-06-07days on market $675,000 Active 46 DOM
-
2026-06-03days on market $675,000 Active 42 DOM
-
2026-06-03days on market $675,000 Active 41 DOM
-
2026-06-01days on market $675,000 Active 40 DOM
-
2026-05-31days on market $675,000 Active 39 DOM
-
2026-04-21$675,000 Active 1005-char remark
-
2004-11-24soldstatus $65,000 138-char remark
Show marketing remark (138 chars)
2 story building 4560 sf. 4 Rental's all tenant occupied. Also see 1988 Ridge right next door. MLS 418135 single family listed for $99,600
-
2004-07-25$89,500 138-char remark
Show marketing remark (138 chars)
2 story building 4560 sf. 4 Rental's all tenant occupied. Also see 1988 Ridge right next door. MLS 418135 single family listed for $99,600
ⓘ Source: listings_history table (triggers on properties + properties_extension) + one-shot
backfill from property_details.listing_events for pre-trigger history.
Nearby sold comps map
Loading sold comps map…
Walkable amenities ~0.75 mi
Loading nearby amenities…
Taxation est. · year 1
- Rental income
- $89,496
- − Mortgage interest
- −$37,810
- − Property taxes
- −$10,125
- − Insurance
- −$3,375
- − Repairs & maintenance
- −$7,160
- − Management
- −$7,160
- − Depreciation
- −$19,636
- Taxable income
- $4,230
- Est. tax owed @ 24.0%
- −$1,015
- After-tax cash flow
- $13,709/yr
For passive investors: Depreciation is non-cash, so a rental often shows a tax loss while cash-flowing — sheltering income. Rental losses are passive: they offset passive income freely, and up to $25,000/yr can offset ordinary (W-2) income if you actively participate and your MAGI is under $100k (phasing out to $0 by $150k); unused losses carry forward. On sale, claimed depreciation is recaptured at up to 25%, and gains may owe capital-gains tax (a 1031 exchange can defer both). Figures are a year-1 estimate at your 24.0% rate — not tax advice; consult a CPA.
Schools (NCES district)
- District
- Wayne Central School District
- NCES district ID
- 3630330
- Math proficiency
- 57% ▼ -8.00%
- Reading proficiency
- 68% ▲ 10.00%
- Median HH income
- $61,193
- Composite
- 54.18/100
- National rank
- #1378
- State rank
- #194 of 590 in NY
Livability — Ontario
- Score
- 71/100
- State rank
- #385
- US rank
- #6629
Category grades
Schools grade is shown separately in the Schools card above.
Census & demographics
- Census place
- Ontario, NY
- Population (ZIP)
- 12,487
Population outlook (Wayne County) Hauer SSP2
- Today (2025)
- 85,662 people
- By 2030
- 81,945 · -4.3%
- By 2040
- 73,735 · -13.9%
- By 2050
- 65,029 · -24.1%
- By 2075
- 47,451 · -44.6%
- By 2100
- 31,574 · -63.1%
Race, ethnicity, and origin ACS 2023
- Neighborhood character
- Predominantly White (91%)
- Race & ethnicity
- White 91% Two or more races 6% Hispanic / Latino 2% Black 1%
- Common ancestry
- Iranian 5% Romanian 4% Lithuanian 3%
- Foreign-born
- 2% · Canada
- Languages at home
- 96% English-only · Spanish 1% Other Indo-European 1% French/Haitian/Cajun 1%
Political lean MEDSL · Wayne
- 2024 margin
- Strong R (+23.1) · D 38.5% · R 61.5%
- 2008→2024 swing
- -13.2pp toward R · 2008: -9.9pp · 2024: -23.1pp
- All cycles
- 2024: R+23.1 2020: R+19.6 2016: R+26.1 2012: R+9.3 2008: R+9.9
Not yet ingested
- Civics
- —
Market trends
- HPI YoY
- ▼ -85.53%
- Current HPI
- 242.3518
- Rent YoY
- —
- Metro
- —
- State GDP YoY
- ▲ 2.60%
- F500 in state
- 92
Industry mix (Fortune 500 HQ in NY)
| Industry | F500 HQs | Revenue |
|---|---|---|
| Financial Services | 10 | $950B |
|
||
| Consumer Goods | 9 | $162B |
|
||
| Insurance | 4 | $225B |
|
||
| Telecommunications | 2 | $144B |
|
||
| Pharmaceuticals | 2 | $112B |
|
||
| Media / Entertainment | 2 | $69B |
|
||
Price history
+654.2% since first listed4 events — show timeline
- 2026-06-19 Listed $675,000 UNYREIS
- 2026-04-21 Listed $675,000 UNYREIS
- 2004-11-24 Sold (MLS) $65,000 UNYREIS
- 2004-07-25 Listed $89,500 UNYREIS
Cash-flow waterfall
monthlySold comps — $/sqft
last 12 mo · ≤1 miLoading sold comps…