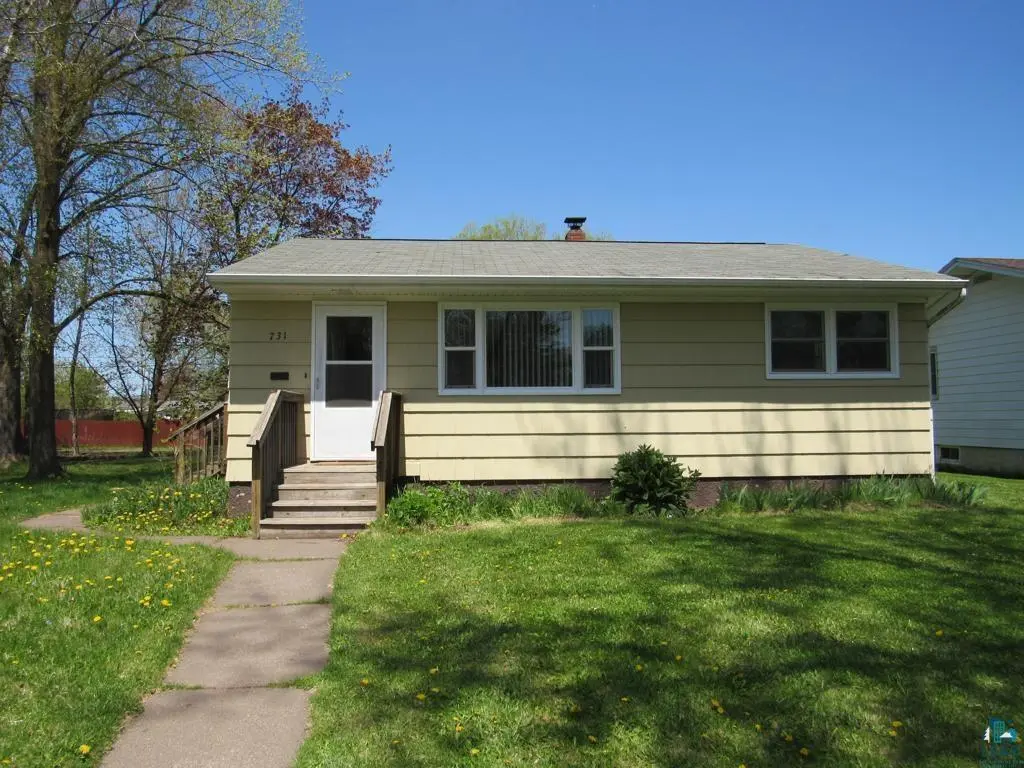
731 Broadway St · Superior, WI
Flood risk 1/10 · Minimal
- FEMA flood zone
- X (unshaded)
- Chance of flooding over 30 yrs
- 0.0%
- Est. flood insurance / yr
- $473 – $860
Fire risk 1/10 · Minimal
- Est. fire insurance / yr
- $636 – $1,182
Heat risk 2/10 · Minimal
- Hot days now (above 92°F)
- 7 days/yr
- Hot days in 30 yrs
- 12 days/yr
Wind risk 1/10 · Minimal
- Chance of severe wind over 30 yrs
- —
Air-quality risk 2/10 · Minimal
- Unhealthy air days now
- 1 days/yr
- Unhealthy air days in 30 yrs
- 1 days/yr
Risk factors via First Street. Map © Google.
Why this score? — see what drove the D grade
The composite is a weighted blend of 9 inputs, each scored 0–100. Each bar is that input's sub-score; the figure is the points it added to the 100-point composite (weight × sub-score).
- Cash flow +13.3/30.0
- ARV discount +7.5/15.0
- Livability +4.3/5.0
- DSCR +4.0/10.0
- 1% rule +3.4/10.0
- Rent growth +3.2/5.0
- Condition / age +2.5/5.0
- Schools +2.4/10.0
- Appreciation +0.0/10.0
$192,000
🖨 Deal sheet 📄 Offer letter ✓ Due diligence
Listing remarks MLS
Well built and freshly painted 2 bedroom ranch style home with full basement and detached garage with a nice large lot. Inside there is a good sized living room, kitchen, 2 bedrooms and bath. Basement is wide open and unfinished. Vinyl windows. Cedar siding. Ready for a new owner!
Key facts
- 0.24 acre lot
- Garage
- Built 1957
Property features AI
Exterior
- Parking: Off-street and street parking; 1-car garage
- Home design: Single-family, 1-story home; Estimated finished above-grade living area about 896
- Exterior features: Landscaped lot
Interior
- Kitchen: Kitchen (11 x 11)
- Bedrooms: Bedroom 2 (Main) — 11 x 11; Bedroom 3 (Main) — 11 x 11
- Bathrooms: 1 full bathroom; 1 quarter bathroom
- Interior features: Living room (18 x 11)
Neighborhood map
What this means for you Summary
Snapshot
- This is a 2-bed/1.5-bath other listed at $192k.
Deal economics
- At list price, monthly cash flow is $-1 ($-17/yr) — negative.
- To cash-flow at today's rent, offer at most $192k (0.1% below list).
- To meet the 1% rule (rent ≥ 1% of price), the offer needs to be $161k (15.9% below list).
- Recommended offer: $161k (15.9% below list) — sets the bar for 1% rule.
- Cap rate 6.3% vs local median 4.6% in Superior — top-decile yield for the area; either an underpriced asset or a hidden risk that comps aren't pricing in. Stress-test before assuming the spread holds.
Location & tenants
- Location reads 86/100 on livability (#21 in WI, #337 nationally) — a professional / high-income tenant draw. Strengths: amenities A+, commute A+, cost of living A+; Watch: schools C-.
- Superior School District (suburban): math 23% / reading 34% proficiency, ranked #290 of 342 in WI (top 85%) — low school quality limits family demand, transient renter base, plan for 1-2y turnover.
- Market conditions: Rents rising (+2.8%/yr); 168 active listings in the ZIP; 5 comparable units currently listed for rent nearby; rentals at typical pace (median 21d on market — plan ~3-4 weeks tenant-placement turnaround); 40% of comp listings sitting > 30 days — soft ceiling on asking rent; 110 units permitted in Douglas County in 2024 (0 in 5+ unit buildings).
Forward outlook
- Local home prices are declining (-3.0%/yr); year-one equity from $1k of loan paydown is wiped out by about $6k of value loss. Plan a longer hold.
- Douglas County population projected at -20% by 2050 — secular population decline; favor cash flow + early exit over multi-decade hold.
Negotiation context
- Only 11 days on market — expect competitive offers; lowballing is unlikely to land.
- 2 sale attempts with the ask held roughly flat each time — persistent listings suggest the price (not the market) is what's stuck; bring a comps-based counter.
- Current owner paid $66k; list at $192k implies a 191% gain — meaningful room to come down on a strong offer.
Risks & watch-outs
- Watch-outs: built in 1957 — expect roof / HVAC / electrical / plumbing capex.
Questions for the listing agent
- What do current leases actually rent for vs. the listed asking? Can we see a recent rent roll and the last 12 months of T-12 income?
- Built in 1957 — when were the roof, HVAC, electrical panel, plumbing, and water heater last replaced?
- Is there a deadline driving the sale (1031 exchange, divorce, estate, relocation)? That informs how much negotiation room exists.
- The area grade is low — what's the realistic commute time and amenity access for the typical tenant pool here? Any planned neighborhood developments (good or bad) we should know about?
- What's the average days-on-market for RENTAL listings here right now (not sales)? A rising rental-DOM trend means longer vacancies and softer asking-rent achievability than the comps imply.
- What's the recent tenant-quality profile in this submarket — average credit score on applications, eviction rate, late-payment / NSF rate, and stable-employment percentage? A property-management company in the area should have these aggregated.
- How much new for-sale + rental construction is in the pipeline within 1–3 miles? Heavy new supply typically softens prices + rents 12–24 months out; constrained supply supports both.
Investment metrics
- 1% rule
- 0.84% ✗
- Cap rate
- 6.28%
- Cash-on-cash
- -0.03%
- DSCR
- 1.00
- GRM
- 9.9
CMA / ARV
No comps found within radius.
Projected returns pro-forma
-3.0% appreciation · 2.76% rent growth · sell at horizon
- IRR
- -16.6%
- Equity multiple
- 0.41×
- Total profit
- $-31,597
- Equity at exit
- $28,628
- IRR
- -8.8%
- Equity multiple
- 0.46×
- Total profit
- $-29,244
- Equity at exit
- $16,601
Cash invested: $53,760 (down + closing). Projections, not guarantees.
Landlord ↔ Tenant lean methodology
- Overall (STATE)
- 73 Landlord-Friendly
- State Wisconsin
- 73 Landlord-Friendly · R+2
- County
- — inherits STATE
- City
- — inherits STATE
ZIP-level market 54880
- Rents YoY
- 2.8%
- Active inventory
- 168
- Price-to-rent
- 9.9×
Monthly cashflow live
- Estimated rent
- $1,615 high interval (Pro) →
- Mortgage (P&I)
- −$1,007
- Tax from tax record
- −$190 /mo · $2,281/yr
- Insurance
- −$80
- HOA
- −$0
- Vacancy / Maint / Mgmt
- −$339
- Net cashflow
- $-1
Break-even live
UW: 25.0% down · 7.5% · 30yr · 1.5% tax · 5.0% vac · 8.0% maint · 8.0% mgmt
Financing live
Cash to close
- Down payment
- $48,000
- Closing costs
- $5,760
- Reserves months
- —
- Total cash needed
- —
Loan-product check · same deal, 3 products live
Conventional
25% down · 7.5% · 30yr
- Down + closing
- —
- Monthly P&I
- —
- Monthly cashflow
- —
- DSCR
- —
- Eligible?
- —
Personal DTI + credit; lowest rate.
DSCR
20% down · 8.5% · 30yr
- Down + closing
- —
- Monthly P&I
- —
- Monthly cashflow
- —
- DSCR
- —
- Eligible?
- —
No personal income docs; deal must DSCR.
Hard money
10% down · 12.0% · 12mo
- Down + closing
- —
- Monthly P&I
- —
- Monthly cashflow
- —
- DSCR
- —
- Eligible?
- —
Short-term bridge; refi at stabilization.
Rent comps 5 comps
| Address | Beds | Baths | Sqft | Rent | $/sqft | DOM | Units | Dist |
|---|---|---|---|---|---|---|---|---|
| 110 E 2nd St Apt 218 Superior, WI | 2.0 | 2.0 | 971 | $2,200 | $2.27 | 20d | 1 | 0.86mi |
| 110 E 2nd St Superior, WI | 1.0–2.0 | 1.0–2.0 | 778 | $2,300 | $2.95 | 13d | 8 | 0.86mi |
| 2009 1/2 Hughitt Ave Superior, WI | 2.0 | 1.0 | 713 | $1,125 | $1.58 | 43d | 1 | 1.02mi |
| 2318 John Ave Unit A Superior, WI | 1.0 | 1.0 | 800 | $1,100 | $1.38 | 13d | 1 | 1.28mi |
| 2113 Oakes Ave Unit 2 Superior, WI | 2.0 | 1.0 | 800 | $1,275 | $1.59 | 43d | 1 | 1.31mi |
Listing history 8 events
-
2026-06-13statusdays on market $192,000 Pending 11 DOM
-
2026-06-10days on market $192,000 Contingent 9 DOM
-
2026-06-09days on market $192,000 Contingent 8 DOM
-
2026-06-08days on market $192,000 Contingent 7 DOM
-
2026-06-07statusdays on market $192,000 Contingent 6 DOM
-
2026-06-03$192,000 Active 1 DOM
-
2026-06-02remarks 281-char remark
-
2026-06-02$192,000 Active 1 DOM
ⓘ Source: listings_history table (triggers on properties + properties_extension) + one-shot
backfill from property_details.listing_events for pre-trigger history.
Tax reassessment forecast WI · Partial reset (capped growth)
- Current annual tax
- $2,281 · $190/mo
- Projected year-2 tax
- $2,916 · $243/mo
- Expected delta
- +$636/yr (+$53/mo · 27.9%)
ⓘ Screening estimate from a state-policy table — verify with the county assessor before closing.
Climate risk First Street
- Flood 1/10 Low FEMA zone X (unshaded) · 0% chance over 30 yrs
- Wildfire 1/10 Low
- Heat 2/10 Low 7 d/yr ≥92°F today · 12 d/yr by 30 yrs out
- Wind 1/10 Low
- Air quality 2/10 Low 1 unhealthy d/yr today · 1 by 30 yrs out
Nearby sold comps map
Loading sold comps map…
Walkable amenities ~0.75 mi
Loading nearby amenities…
Taxation est. · year 1
- Rental income
- $19,375
- − Mortgage interest
- −$10,755
- − Property taxes
- −$2,281
- − Insurance
- −$960
- − Repairs & maintenance
- −$1,550
- − Management
- −$1,550
- − Depreciation
- −$5,585
- Taxable loss
- −$3,306
- Est. tax savings @ 24.0%
- +$793
- After-tax cash flow
- $777/yr
For passive investors: Depreciation is non-cash, so a rental often shows a tax loss while cash-flowing — sheltering income. Rental losses are passive: they offset passive income freely, and up to $25,000/yr can offset ordinary (W-2) income if you actively participate and your MAGI is under $100k (phasing out to $0 by $150k); unused losses carry forward. On sale, claimed depreciation is recaptured at up to 25%, and gains may owe capital-gains tax (a 1031 exchange can defer both). Figures are a year-1 estimate at your 24.0% rate — not tax advice; consult a CPA.
Schools (NCES district)
- District
- Superior School District
- NCES district ID
- 5514670
- Math proficiency
- 23% ▼ -12.00%
- Reading proficiency
- 34% ▼ -4.00%
- Median HH income
- $43,659
- Composite
- 24.31/100
- National rank
- #7711
- State rank
- #290 of 342 in WI
Livability — Superior
- Score
- 86/100
- State rank
- #21
- US rank
- #337
Category grades
Schools grade is shown separately in the Schools card above.
Census & demographics
- Census place
- Superior, WI
- County
- Douglas County · 30,312 people
- City population
- 30,312
- Metro
- Duluth, MN-WI
- Population (ZIP)
- 30,312
- Household income
- $68,275
- Rent vs Own
- Severe rent burden
- 1018.0
Population outlook (Douglas County) Hauer SSP2
- Today (2025)
- 42,505 people
- By 2030
- 41,269 · -2.9%
- By 2040
- 37,829 · -11.0%
- By 2050
- 34,043 · -19.9%
- By 2075
- 25,892 · -39.1%
- By 2100
- 19,487 · -54.2%
Race, ethnicity, and origin ACS 2023
- Neighborhood character
- Predominantly White (90%)
- Race & ethnicity
- White 90% Two or more races 5% Hispanic / Latino 2% Black 1% Asian 1% Native American 1%
- Common ancestry
- Portuguese 10% Romanian 9% Lithuanian 4%
- Foreign-born
- 2% · China, Vietnam
- Languages at home
- 97% English-only · Spanish 1%
Political lean MEDSL · Douglas
- 2024 margin
- Lean D (+5.3) · D 52.0% · R 46.6% · Other 1.4%
- 2008→2024 swing
- -27.9pp toward R · 2008: 33.2pp · 2024: 5.3pp
- All cycles
- 2024: D+5.3 2020: D+9.3 2016: D+7.6 2012: D+31.3 2008: D+33.2
Not yet ingested
- Civics
- —
Market trends
- HPI YoY
- ▼ -167.80%
- Current HPI
- 226.557
- Rent YoY
- ▲ 2.76%
- Metro
- Duluth, MN-WI
- State GDP YoY
- ▲ 2.10%
- F500 in state
- 20
Industry mix (Fortune 500 HQ in WI)
| Industry | F500 HQs | Revenue |
|---|---|---|
| Industrial Machinery | 4 | $23B |
|
||
| Industrial Technology | 2 | $36B |
|
||
| Insurance | 1 | $36B |
|
||
| Professional Services | 1 | $19B |
|
||
| Utilities | 1 | $9B |
|
||
| Consumer Goods | 1 | $3B |
|
||
Price history
+190.9% since first listed3 events — show timeline
- 2026-06-01 Listed $192,000 LSAR
- 2026-06-01 Listed $192,000 SAAR
- 2002-03-15 Sold (Public Records) $66,000 Public Records
Property tax history
+2.8%/yrLatest (2025): $2,281 · +2.2% YoY. Source: county tax records.
Cash-flow waterfall
monthlySold comps — $/sqft
last 12 mo · ≤1 miLoading sold comps…