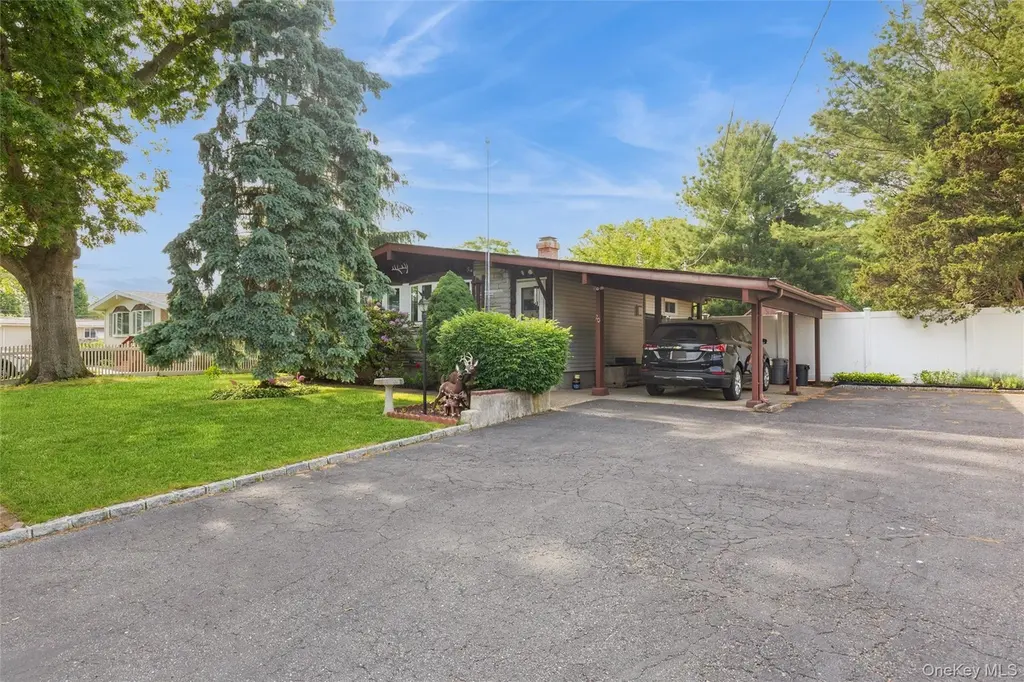
20 Duane Dr · Lake Ronkonkoma, NY
Flood risk 1/10 · Minimal
- FEMA flood zone
- X (unshaded)
- Chance of flooding over 30 yrs
- 0.0%
- Est. flood insurance / yr
- $473 – $860
Fire risk 1/10 · Minimal
- Est. fire insurance / yr
- $691 – $1,283
Heat risk 5/10 · Moderate
- Hot days now (above 93°F)
- 7 days/yr
- Hot days in 30 yrs
- 17 days/yr
Wind risk 6/10 · Moderate
- Chance of severe wind over 30 yrs
- 77.0%
Air-quality risk 4/10 · Minor
- Unhealthy air days now
- 4 days/yr
- Unhealthy air days in 30 yrs
- 6 days/yr
Risk factors via First Street. Map © Google.
Why this score? — see what drove the D- grade
The composite is a weighted blend of 9 inputs, each scored 0–100. Each bar is that input's sub-score; the figure is the points it added to the 100-point composite (weight × sub-score).
- Cash flow +9.4/30.0
- ARV discount +6.7/15.0
- Schools +6.6/10.0
- Livability +3.9/5.0
- DSCR +2.7/10.0
- Rent growth +2.7/5.0
- Condition / age +2.5/5.0
- 1% rule +2.4/10.0
- Appreciation +0.0/10.0
$549,999
🖨 Deal sheet (PDF) 📄 Offer letter ✓ Due diligence
Listing remarks
Welcome Home! 3 Bedroom Ranch in Lake Ronkonkoma - Eat In Kitchen, Living Room, Full Basement & Carport! Gas Heating, Central Air - Hardwood Floors, Updated Windows! Great Size Property - Close to the Long Island Expressway - Close to the Long Island Railroad, Shopping Centers & More! Sachem Schools. Hiawatha / Samoset / Sachem North. True Taxes: 8815.59
Key facts
- Updated windows
- Eat in kitchen
- Full basement
Tags
Property features AI
Exterior
- Parking: Covered carport (1 space); Driveway parking
- Utilities: Cesspool sewer; Utilities: See remarks
- Home design: Single family residence; Living area reported from public records
- Construction: Vinyl siding
- Exterior features: Fenced yard; Not waterfront
Interior
- Kitchen: Convection oven; Dishwasher; Refrigerator
- Bedrooms: Total rooms: 5
- Flooring: Hardwood
- Bathrooms: 1 full bathroom
- Heating & cooling: Natural gas heating; Central air conditioning
- Interior features: First-floor bedroom; First-floor full bathroom; Full attic; Unfinished basement
- Laundry & utility: Washer; Dryer
Neighborhood map
What this means for you Summary
Snapshot
- This is a 3-bed/1.0-bath single-family listed at $550k.
Deal economics
- At list price, monthly cash flow is $-388 ($-5k/yr) — negative.
- To cash-flow at today's rent, offer at most $481k (12.5% below list).
- To meet the 1% rule (rent ≥ 1% of price), the offer needs to be $409k (25.7% below list).
- Recommended offer: $409k (25.7% below list) — sets the bar for 1% rule.
- Cap rate 5.4% vs local median 4.0% in Lake Ronkonkoma — top-decile yield for the area; either an underpriced asset or a hidden risk that comps aren't pricing in. Stress-test before assuming the spread holds.
Location & tenants
- Location reads 78/100 on livability (#169 in NY, #2,606 nationally) — a middle-class / working-renter tenant base. Strengths: employment A+, housing A+, health & safety B; Watch: amenities D-, cost of living F.
- Sachem Central School District (suburban): math 69% / reading 76% proficiency, ranked #86 of 590 in NY (top 15%) — strong family-tenant draw, lease renewals of 3-5y typical; only 15% free/reduced lunch — higher-income household profile.
- Zoned schools: Hiawatha School (math 57% / reading 57%, grade C+, #842 of 2,108 statewide, top 43%, 603 students, 36% FRL); Samoset Middle School (math 51% / reading 63%, grade B, #192 of 729 statewide, top 28%, 892 students, 31% FRL); Sachem High School North (math 96% / reading 95%, grade A+, #76 of 1,100 statewide, top 7%, 1,923 students, 25% FRL) — zoned schools average 31% FRL vs 15% district-wide (16 pts higher); higher-poverty schools than district average — tighter screening recommended.
- Market conditions: Rents flat; 175 active listings in the ZIP; 3 comparable units currently listed for rent nearby; rentals leasing fast (median 0d on market — plan ~1-2 weeks tenant-placement turnaround); high-income renter base; 1,366 units permitted in Suffolk County in 2024 (216 in 5+ unit buildings).
- This rent runs 44% of the median local income ($112k/yr) — at the standard rent-burdened threshold; future hikes will face affordability resistance.
Forward outlook
- Local home prices are declining (-3.0%/yr); year-one equity from $4k of loan paydown is wiped out by about $16k of value loss. Plan a longer hold.
- Suffolk County population projected to shrink 5% by 2050 — rents likely to lag national; underwrite the cash flow, not the appreciation.
Negotiation context
- It's been on market 15 days — a 2% lower offer ($542k) is reasonable based on typical stale-listing flexibility.
Risks & watch-outs
- Climate carrying-cost: major wind risk, 77% chance of damaging wind over 30y; extreme-heat days projected 7→17/yr by 2055 (HVAC capex compounding) — expect insurance premiums to compound above CPI over the hold.
Questions for the listing agent
- What do current leases actually rent for vs. the listed asking? Can we see a recent rent roll and the last 12 months of T-12 income?
- Built in 1960 — when were the roof, HVAC, electrical panel, plumbing, and water heater last replaced?
- Is there a deadline driving the sale (1031 exchange, divorce, estate, relocation)? That informs how much negotiation room exists.
- Schools are B-rated — typically a magnet for longer-tenancy family renters. What's the average tenant stay here, and is there a school-zone premium baked into asking?
- The area grade is low — what's the realistic commute time and amenity access for the typical tenant pool here? Any planned neighborhood developments (good or bad) we should know about?
- What's the average days-on-market for RENTAL listings here right now (not sales)? A rising rental-DOM trend means longer vacancies and softer asking-rent achievability than the comps imply.
- What's the recent tenant-quality profile in this submarket — average credit score on applications, eviction rate, late-payment / NSF rate, and stable-employment percentage? A property-management company in the area should have these aggregated.
- How much new for-sale + rental construction is in the pipeline within 1–3 miles? Heavy new supply typically softens prices + rents 12–24 months out; constrained supply supports both.
Investment metrics
- 1% rule
- 0.74% ✗
- Cap rate
- 5.45%
- Cash-on-cash
- -3.02%
- DSCR
- 0.87
- GRM
- 11.2
CMA / ARV
- ARV (on-the-fly)
- $540,000
- Comps found
- 12
Show comp detail 12 sales within ~0.75 mi
| Address | Dist | Beds/Ba | Sqft | Sold | Price | $/sf | Match |
|---|---|---|---|---|---|---|---|
| 32 Dennis Dr | 0.32mi | 3/1.0 | 981 (-2%) | 1mo | $535,000 | $545 | 81 |
| 132 Pleasure Ave | 0.17mi | 3/1.0 | 1,016 (+2%) | 13mo | $580,000 | $571 | 78 |
| 51 Lynda Dr | 0.08mi | 3/1.0 | 1,036 (+4%) | 14mo | $580,000 | $560 | 78 |
| 22 Peter Rd | 0.18mi | 3/2.0 | 996 (-0%) | 13mo | $530,000 | $532 | 76 |
| 49 Lakewood Ave | 0.44mi | 3/1.0 | 888 (-11%) | 1mo | $515,000 | $580 | 60 |
| 14 Weichers St | 0.74mi | 3/1.0 | 1,015 (+2%) | 5mo | $495,000 | $488 | 59 |
| 97 Lakewood Ave | 0.58mi | 3/2.0 | 999 (-0%) | 16mo | $645,000 | $646 | 56 |
| 10 Jan Ct | 0.62mi | 3/1.0 | 1,053 (+5%) | 8mo | $550,000 | $522 | 55 |
| 86 Samuel St | 0.48mi | 3/1.0 | 1,098 (+10%) | 11mo | $570,000 | $519 | 52 |
| 31 Duncan Ave | 0.67mi | 3/1.5 | 1,060 (+6%) | 14mo | $565,000 | $533 | 45 |
| 16 Wyant Ave | 0.56mi | 3/1.0 | 1,144 (+14%) | 6mo | $550,000 | $481 | 45 |
| 17 Acorn St | 0.73mi | 3/2.0 | 1,056 (+6%) | 12mo | $570,000 | $540 | 43 |
Match score weights: distance 35% · size 25% · config 20% · recency 20%. Top-matched comps best support the ARV.
Projected returns pro-forma
-3.0% appreciation · 0.79% rent growth · sell at horizon
- IRR
- -23.7%
- Equity multiple
- 0.20×
- Total profit
- $-122,776
- Equity at exit
- $82,007
- IRR
- -25.7%
- Equity multiple
- -0.13×
- Total profit
- $-173,848
- Equity at exit
- $47,554
Cash invested: $154,000 (down + closing). Projections, not guarantees.
Landlord ↔ Tenant lean methodology
- Overall (STATE)
- 15 Strongly Tenant-Friendly
- State New York
- 15 Strongly Tenant-Friendly · D+10
- County
- — inherits STATE
- City
- — inherits STATE
ZIP-level market 11779
- Rents YoY
- 0.8%
- Active inventory
- 175
- Price-to-rent
- 11.2×
Monthly cashflow live
- Estimated rent
- $4,088 medium interval (Pro) →
- Mortgage (P&I)
- −$2,884
- Tax from tax record
- −$504 /mo · $6,050/yr
- Insurance
- −$229
- HOA
- −$0
- Vacancy / Maint / Mgmt
- −$859
- Net cashflow
- $-388
Break-even live
Sensitivity live
| Price | -10% $-77 | -5% $-232 | +0% $-388 | +5% $-544 | +10% $-699 |
|---|---|---|---|---|---|
| Rent | -10% $-711 | -5% $-549 | +0% $-388 | +5% $-226 | +10% $-65 |
| Rate | -1.0pp $-111 | -0.5pp $-248 | base $-388 | +0.5pp $-530 | +1.0pp $-675 |
UW: 25.0% down · 7.5% · 30yr · 1.5% tax · 5.0% vac · 8.0% maint · 8.0% mgmt
Financing live
Cash to close
- Down payment
- $137,500
- Closing costs
- $16,500
- Reserves months
- —
- Total cash needed
- —
Loan-product check · same deal, 3 products live
Conventional
25% down · 7.5% · 30yr
- Down + closing
- —
- Monthly P&I
- —
- Monthly cashflow
- —
- DSCR
- —
- Eligible?
- —
Personal DTI + credit; lowest rate.
DSCR
20% down · 8.5% · 30yr
- Down + closing
- —
- Monthly P&I
- —
- Monthly cashflow
- —
- DSCR
- —
- Eligible?
- —
No personal income docs; deal must DSCR.
Hard money
10% down · 12.0% · 12mo
- Down + closing
- —
- Monthly P&I
- —
- Monthly cashflow
- —
- DSCR
- —
- Eligible?
- —
Short-term bridge; refi at stabilization.
Rent comps 3 comps
| Address | Beds | Baths | Sqft | Rent | $/sqft | DOM | Units | Dist |
|---|---|---|---|---|---|---|---|---|
| 1000 Mill Rd Lake Ronkonkoma, NY | 2.0 | 1.0–2.0 | 843 | $4,220 | $5.01 | 0d | 14 | 0.45mi |
| 2 Hawkins Ave Lake Ronkonkoma, NY | 3.0 | 1.0–2.0 | 959 | $5,009 | $5.22 | 0d | 130 | 0.62mi |
| 147 Lake Shore Rd Ronkonkoma, NY | 1.0–2.0 | 1.0 | 940 | $3,379 | $3.59 | 0d | 10 | 0.90mi |
Listing history 11 events
-
2026-06-21days on market $549,999 Active 15 DOM
-
2026-06-18days on market $549,999 Active 12 DOM
-
2026-06-17days on market $549,999 Active 11 DOM
-
2026-06-16days on market $549,999 Active 10 DOM
-
2026-06-15days on market $549,999 Active 9 DOM
-
2026-06-13days on market $549,999 Active 7 DOM
-
2026-06-13days on market $549,999 Active 6 DOM
-
2026-06-09days on market $549,999 Active 3 DOM
-
2026-06-08days on market $549,999 Active 2 DOM
-
2026-06-07remarks 364-char remark
-
2026-06-07$549,999 Active 1 DOM
ⓘ Source: listings_history table (triggers on properties + properties_extension) + one-shot
backfill from property_details.listing_events for pre-trigger history.
Tax reassessment forecast NY · Partial reset (capped growth)
- Current annual tax
- $6,050 · $504/mo
- Projected year-2 tax
- $7,673 · $639/mo
- Expected delta
- +$1,622/yr (+$135/mo · 26.8%)
ⓘ Screening estimate from a state-policy table — verify with the county assessor before closing.
Climate risk First Street
- Flood 1/10 Low FEMA zone X (unshaded) · 0% chance over 30 yrs
- Wildfire 1/10 Low
- Heat 5/10 Major 7 d/yr ≥93°F today · 17 d/yr by 30 yrs out
- Wind 6/10 Major 77% chance of damaging wind over 30 yrs
- Air quality 4/10 Moderate 4 unhealthy d/yr today · 6 by 30 yrs out
Nearby sold comps map
Loading sold comps map…
Walkable amenities ~0.75 mi
Loading nearby amenities…
Taxation est. · year 1
- Rental income
- $49,058
- − Mortgage interest
- −$30,808
- − Property taxes
- −$6,050
- − Insurance
- −$2,750
- − Repairs & maintenance
- −$3,925
- − Management
- −$3,925
- − Depreciation
- −$16,000
- Taxable loss
- −$14,399
- Est. tax savings @ 24.0%
- +$3,456
- After-tax cash flow
- $-1,199/yr
For passive investors: Depreciation is non-cash, so a rental often shows a tax loss while cash-flowing — sheltering income. Rental losses are passive: they offset passive income freely, and up to $25,000/yr can offset ordinary (W-2) income if you actively participate and your MAGI is under $100k (phasing out to $0 by $150k); unused losses carry forward. On sale, claimed depreciation is recaptured at up to 25%, and gains may owe capital-gains tax (a 1031 exchange can defer both). Figures are a year-1 estimate at your 24.0% rate — not tax advice; consult a CPA.
Schools (NCES district)
- District
- Sachem Central School District
- NCES district ID
- 3625350
- Math proficiency
- 69% ▬ 0.00%
- Reading proficiency
- 76% ▲ 12.00%
- Median HH income
- $92,968
- Composite
- 65.53/100
- National rank
- #472
- State rank
- #86 of 590 in NY
Livability — Lake Ronkonkoma
- Score
- 78/100
- State rank
- #169
- US rank
- #2606
Category grades
Schools grade is shown separately in the Schools card above.
Census & demographics
- Census place
- Lake Ronkonkoma, NY
- County
- Suffolk County · 679,920 people
- City population
- 38,273
- Metro
- New York-Newark-Jersey City, NY-NJ-PA
- Population (ZIP)
- 38,206
- Household income
- $112,180
- Rent vs Own
- Severe rent burden
- 874.0
Population outlook (Suffolk County) Hauer SSP2
- Today (2025)
- 1,505,262 people
- By 2030
- 1,498,318 · -0.5%
- By 2040
- 1,471,101 · -2.3%
- By 2050
- 1,424,848 · -5.3%
- By 2075
- 1,337,157 · -11.2%
- By 2100
- 1,217,720 · -19.1%
Race, ethnicity, and origin ACS 2023
- Neighborhood character
- Predominantly White (67%)
- Race & ethnicity
- White 67% Hispanic / Latino 19% Two or more races 9% Asian 7% Black 5%
- Hispanic origin (detail)
- Puerto Rican 7% Dominican 1%
- Common ancestry
- Romanian 4% Scotch-Irish 1% Lithuanian 1%
- Foreign-born
- 14% · Canada, Jamaica, China
- Languages at home
- 79% English-only · Spanish 10% Other Indo-European 7% Other Asian/Pacific 1%
Political lean MEDSL · Suffolk
- 2024 margin
- Lean R (+10.0) · D 45.0% · R 55.0%
- 2008→2024 swing
- -16.0pp toward R · 2008: 6.0pp · 2024: -10.0pp
- All cycles
- 2024: R+10.0 2020: R+0.0 2016: R+8.2 2012: D+2.9 2008: D+6.0
Not yet ingested
- Civics
- —
Market trends
- HPI YoY
- ▼ -569.98%
- Current HPI
- 350.0973
- Rent YoY
- ▲ 0.79%
- Metro
- New York-Newark-Jersey City, NY-NJ-PA
- State GDP YoY
- ▲ 2.60%
- F500 in state
- 92
Industry mix (Fortune 500 HQ in NY)
| Industry | F500 HQs | Revenue |
|---|---|---|
| Financial Services | 10 | $950B |
|
||
| Consumer Goods | 9 | $162B |
|
||
| Insurance | 4 | $225B |
|
||
| Telecommunications | 2 | $144B |
|
||
| Pharmaceuticals | 2 | $112B |
|
||
| Media / Entertainment | 2 | $69B |
|
||
Price history
1 event — show timeline
- 2026-06-06 Listed $549,999 OneKey® MLS as Distributed by MLS Grid
Property tax history
+2.2%/yrLatest (2025): $6,050 · +0.0% YoY. Source: county tax records.
Cash-flow waterfall
monthlySold comps — $/sqft
last 12 mo · ≤1 miLoading sold comps…