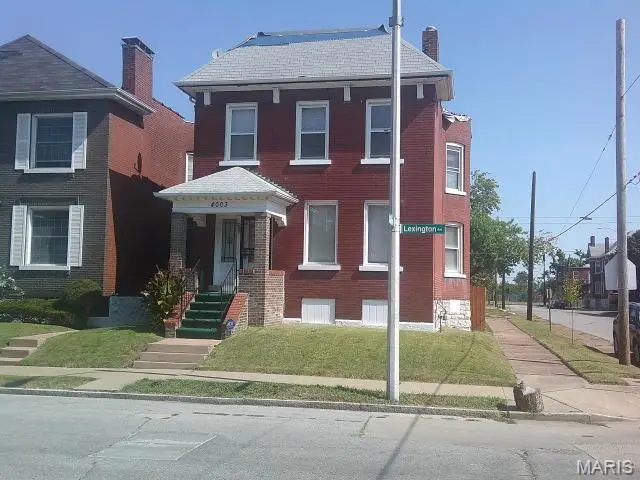
4003 Lexington Ave · St. Louis, MO
Flood risk 1/10 · Minimal
- FEMA flood zone
- X (unshaded)
- Chance of flooding over 30 yrs
- 0.0%
- Est. flood insurance / yr
- $473 – $860
Fire risk 1/10 · Minimal
- Est. fire insurance / yr
- $1,054 – $1,958
Heat risk 5/10 · Moderate
- Hot days now (above 107°F)
- 7 days/yr
- Hot days in 30 yrs
- 21 days/yr
Wind risk 2/10 · Minimal
- Chance of severe wind over 30 yrs
- 1.0%
Air-quality risk 4/10 · Minor
- Unhealthy air days now
- 5 days/yr
- Unhealthy air days in 30 yrs
- 6 days/yr
Risk factors via First Street. Map © Google.
Why this score? — see what drove the B grade
The composite is a weighted blend of 9 inputs, each scored 0–100. Each bar is that input's sub-score; the figure is the points it added to the 100-point composite (weight × sub-score).
- Cash flow +30.0/30.0
- 1% rule +10.0/10.0
- DSCR +10.0/10.0
- ARV discount +7.5/15.0
- Appreciation +4.1/10.0
- Rent growth +2.5/5.0
- Livability +2.5/5.0
- Condition / age +2.5/5.0
- Schools +1.2/10.0
$44,000
🖨 Deal sheet (PDF) 📄 Offer letter ✓ Due diligence
Listing remarks
DRASTIC PRICE DROP!!!! MAKE THIS YOUR NEW HOME. HOME HAS A NEW ROOF. Ceilings that were water damaged have been removed. Walls and flooring that were damaged have been removed. The building is stable and is ready for you to put your personal touch to bring it back to a possibly better dream home than before. The house sits in the most sought-after area in the Northside of the city close to the New Geo-Spacial Government facility (NGA), a park, bus routes, schools, shopping, restaurants, automotive repair shops. Shoot your best shot. PLEASE BE AWARE THAT ANY AND ALL INSPECTIONS ARE FOR YOUR PERSONAL INFORMATION SINCE THE HOUSE IS BEING SOLD AS-IS.
Key facts
- 3,358 sq ft lot
- Built 1908
- Listed 16 days
Property features AI
Finance
- Financial info: Lease not considered (no)
Exterior
- Utilities: Public water; Public sewer; Electric service by Ameren; Cable, phone, and natural gas available; electricity, sewer and water connected
- Home design: Single-family residence; Two levels; Residential property
- Construction: Brick and natural building materials; Flat roof; Foundation: block and stone; Has full, unfinished basement with exterior entry, walk-out access and 9+ ft pour
- Exterior features: Wood fencing; Back yard and front yard; Corner lot; Near public transit
Interior
- Kitchen: Kitchen (approx. 13 x 10)
- Bedrooms: 3 bedrooms (all on the upper level); Bedroom sizes: 22 x 11, 15 x 12, 13 x 10
- Bathrooms: 1 full bathroom (upper level/main & upper level)
- Heating & cooling: Natural gas heating; Central air conditioning
- Interior features: Living room fireplace
Neighborhood map
What this means for you Summary
Snapshot
- This is a 3-bed/1.0-bath single-family listed at $44k.
Deal economics
- At list price, monthly cash flow is $616 ($7k/yr) — positive.
- The deal already cash-flows at list — no discount required.
- Meets the 1% rule at list price ($1k rent vs $44k).
- Recommended offer: $43k (1.5% below list) — sets the bar for market timing.
- Cap rate 23.1% vs local median 5.0% in St. Louis — top-decile yield for the area; either an underpriced asset or a hidden risk that comps aren't pricing in. Stress-test before assuming the spread holds.
Location & tenants
- Location reads: area grade B — affects rentability + tenant quality, not the cash-flow math above.
- St. Louis City (urban): math 10% / reading 18% proficiency, ranked #312 of 324 in MO (top 96%) — low school quality limits family demand, transient renter base, plan for 1-2y turnover; 80% free/reduced lunch — lower-income household profile, screen leases tightly.
- Zoned schools: Columbia Elem. Comm. Ed. Ctr. (math 2% / reading 12%, grade F, #1,058 of 1,115 statewide, top 96%, 221 students, 99% FRL); Gateway Middle (math 0% / reading 8%, grade F, #389 of 391 statewide, top 100%, 506 students, 99% FRL); Vashon High (math 2% / reading 2%, grade F, #520 of 521 statewide, top 100%, 568 students, 100% FRL) — zoned schools average 99% FRL vs 80% district-wide (19 pts higher); higher-poverty schools than district average — tighter screening recommended.
- Market conditions: 59 active listings in the ZIP; 9 comparable units currently listed for rent nearby; rentals lingering (median 46d on market — plan ~5-8 weeks vacancy on turnover, expect pricing pressure); 56% of comp listings sitting > 30 days — soft ceiling on asking rent; 294 units permitted in St. Louis city in 2024 (227 in 5+ unit buildings).
Forward outlook
- Local home prices are declining (-1.8%/yr); year-one equity from $304 of loan paydown is wiped out by about $771 of value loss. Plan a longer hold.
- St. Louis County population projected to shrink 6% by 2050 — rents likely to lag national; underwrite the cash flow, not the appreciation.
- At projected returns (-1.8% appreciation + 3.0% rent growth), your $12k cash investment doubles in ~2 years — after that, you're playing with house money.
Negotiation context
- It's been on market 17 days — a 2% lower offer ($43k) is reasonable based on typical stale-listing flexibility.
- 4 sale attempts; this cycle's ask has dropped $14k (24%) from the opening price — seller is motivated, your offer sets the floor, not the list.
Risks & watch-outs
- Watch-outs: built in 1908 — expect roof / HVAC / electrical / plumbing capex.
- Climate carrying-cost: extreme-heat days projected 7→21/yr by 2055 (HVAC capex compounding) — expect insurance premiums to compound above CPI over the hold.
Questions for the listing agent
- Built in 1908 — when were the roof, HVAC, electrical panel, plumbing, and water heater last replaced?
- Is there a deadline driving the sale (1031 exchange, divorce, estate, relocation)? That informs how much negotiation room exists.
- What's the average days-on-market for RENTAL listings here right now (not sales)? A rising rental-DOM trend means longer vacancies and softer asking-rent achievability than the comps imply.
- What's the recent tenant-quality profile in this submarket — average credit score on applications, eviction rate, late-payment / NSF rate, and stable-employment percentage? A property-management company in the area should have these aggregated.
- How much new for-sale + rental construction is in the pipeline within 1–3 miles? Heavy new supply typically softens prices + rents 12–24 months out; constrained supply supports both.
Investment metrics
- 1% rule
- 2.53% ✓
- Cap rate
- 23.08%
- Cash-on-cash
- 59.96%
- DSCR
- 3.67
- GRM
- 3.3
CMA / ARV
- ARV (on-the-fly)
- $148,896
- Comps found
- 12
Show comp detail 12 sales within ~0.75 mi
| Address | Dist | Beds/Ba | Sqft | Sold | Price | $/sf | Match |
|---|---|---|---|---|---|---|---|
| 3712 Hebert St | 0.39mi | 3/2.5 | 1,486 (-1%) | 12mo | $170,000 | $114 | 64 |
| 4051 Maffitt Ave | 0.41mi | 3/1.0 | 1,584 (+5%) | 10mo | $23,000 | $15 | 64 |
| 4025 Lexington Ave | 0.05mi | 3/2.0 | 1,666 (+11%) | 16mo | $165,000 | $99 | 63 |
| 3716 Hebert St | 0.37mi | 3/2.5 | 1,460 (-3%) | 11mo | $170,000 | $116 | 63 |
| 3714 Hebert St | 0.38mi | 3/2.5 | 1,460 (-3%) | 13mo | $170,000 | $116 | 61 |
| 4111 E Lee Ave | 0.51mi | 3/1.0 | 1,550 (+3%) | 16mo | $70,000 | $45 | 58 |
| 4526 Alice Ave | 0.71mi | 3/1.0 | 1,472 (-2%) | 11mo | $85,000 | $58 | 54 |
| 4166 Farlin Ave | 0.48mi | 3/1.5 | 1,684 (+12%) | 6mo | $15,000 | $9 | 50 |
| 3905 Cottage Ave | 0.58mi | 3/2.0 | 1,339 (-11%) | 4mo | $159,000 | $119 | 48 |
| 3526 Paris Ave | 0.74mi | 3/2.0 | 1,624 (+8%) | 6mo | $25,000 | $15 | 43 |
| 4202 E Carter Ave | 0.75mi | 3/1.0 | 1,296 (-14%) | 15mo | $75,000 | $58 | 30 |
| 3721 Lincoln Ave | 0.62mi | 3/2.0 | 1,280 (-15%) | 15mo | $160,000 | $125 | 30 |
Match score weights: distance 35% · size 25% · config 20% · recency 20%. Top-matched comps best support the ARV.
Projected returns pro-forma
-1.75% appreciation · 3.0% rent growth · sell at horizon
- IRR
- 59.9%
- Equity multiple
- 3.79×
- Total profit
- $34,417
- Equity at exit
- $9,055
- IRR
- 63.6%
- Equity multiple
- 7.70×
- Total profit
- $82,547
- Equity at exit
- $8,229
Cash invested: $12,320 (down + closing). Projections, not guarantees.
Landlord ↔ Tenant lean methodology
- Overall (STATE)
- 81 Strongly Landlord-Friendly
- State Missouri
- 81 Strongly Landlord-Friendly · R+10
- County
- — inherits STATE
- City
- — inherits STATE
ZIP-level market 63107
- Home prices YoY
- -1.9%
- Active inventory
- 59
- Price-to-rent
- 3.3×
Monthly cashflow live
- Estimated rent
- $1,115 high interval (Pro) →
- Mortgage (P&I)
- −$231
- Tax from tax record
- −$16 /mo · $191/yr
- Insurance
- −$18
- HOA
- −$0
- Vacancy / Maint / Mgmt
- −$234
- Net cashflow
- $616
Break-even live
Sensitivity live
| Price | -10% $641 | -5% $628 | +0% $616 | +5% $603 | +10% $591 |
|---|---|---|---|---|---|
| Rent | -10% $528 | -5% $572 | +0% $616 | +5% $660 | +10% $704 |
| Rate | -1.0pp $638 | -0.5pp $627 | base $616 | +0.5pp $604 | +1.0pp $593 |
UW: 25.0% down · 7.5% · 30yr · 1.5% tax · 5.0% vac · 8.0% maint · 8.0% mgmt
Financing live
Cash to close
- Down payment
- $11,000
- Closing costs
- $1,320
- Reserves months
- —
- Total cash needed
- —
Loan-product check · same deal, 3 products live
Conventional
25% down · 7.5% · 30yr
- Down + closing
- —
- Monthly P&I
- —
- Monthly cashflow
- —
- DSCR
- —
- Eligible?
- —
Personal DTI + credit; lowest rate.
DSCR
20% down · 8.5% · 30yr
- Down + closing
- —
- Monthly P&I
- —
- Monthly cashflow
- —
- DSCR
- —
- Eligible?
- —
No personal income docs; deal must DSCR.
Hard money
10% down · 12.0% · 12mo
- Down + closing
- —
- Monthly P&I
- —
- Monthly cashflow
- —
- DSCR
- —
- Eligible?
- —
Short-term bridge; refi at stabilization.
Rent comps 9 comps
| Address | Beds | Baths | Sqft | Rent | $/sqft | DOM | Units | Dist |
|---|---|---|---|---|---|---|---|---|
| 4247 Maffitt Ave St. Louis, MO | 3.0 | 1.5 | 1700 | $1,000 | $0.59 | 6d | 1 | 0.55mi |
| 4202 Gano Ave Saint Louis, MO | 3.0 | 1.0 | 1650 | $1,168 | $0.71 | 25d | 1 | 0.63mi |
| 4223 Red Bud Ave Unit 1F St. Louis, MO | 2.0 | 1.0 | 1167 | $895 | $0.77 | 46d | 1 | 0.69mi |
| 2207 Angelica St Unit 1 St. Louis, MO | 2.0 | 1.0 | 1734 | $1,350 | $0.78 | 46d | 1 | 0.92mi |
| 4029 N 22nd St Saint Louis, MO | 3.0 | 1.5 | 1454 | $1,300 | $0.89 | 0d | 1 | 0.94mi |
| 2046 Obear Ave Unit A St. Louis, MO | 3.0 | 1.5 | 1456 | $1,070 | $0.73 | 46d | 1 | 0.94mi |
| 4642 Farlin Ave Unit 1F St. Louis, MO | 2.0 | 1.0 | 1056 | $800 | $0.76 | 46d | 1 | 1.12mi |
| 4040 Shreve Ave Saint Louis, MO | 3.0 | 1.0 | 1201 | $1,250 | $1.04 | 46d | 1 | 1.29mi |
| 2239 University St Saint Louis, MO | 3.0 | 1.5 | 1116 | $1,295 | $1.16 | 14d | 1 | 1.30mi |
Listing history 12 events
-
2026-06-21remarks 656-char remark
-
2026-06-21pricedays on market $44,000 Active 17 DOM
-
2026-06-18days on market $55,000 Active 14 DOM
-
2026-06-17days on market $55,000 Active 13 DOM
-
2026-06-16days on market $55,000 Active 12 DOM
-
2026-06-15days on market $55,000 Active 11 DOM
-
2026-06-13days on market $55,000 Active 9 DOM
-
2026-06-09days on market $55,000 Active 5 DOM
-
2026-06-08days on market $55,000 Active 4 DOM
-
2026-06-07statusdays on market $55,000 Active 3 DOM
-
2026-06-05remarks 606-char remark
-
2026-06-05$55,000 Coming Soon 1 DOM
ⓘ Source: listings_history table (triggers on properties + properties_extension) + one-shot
backfill from property_details.listing_events for pre-trigger history.
Tax reassessment forecast MO · Resets to sale price
- Current annual tax
- $191 · $16/mo
- Projected year-2 tax
- $427 · $36/mo
- Expected delta
- +$236/yr (+$20/mo · 123.2%)
ⓘ Screening estimate from a state-policy table — verify with the county assessor before closing.
Climate risk First Street
- Flood 1/10 Low FEMA zone X (unshaded) · 0% chance over 30 yrs
- Wildfire 1/10 Low
- Heat 5/10 Major 7 d/yr ≥107°F today · 21 d/yr by 30 yrs out
- Wind 2/10 Low 100% chance of damaging wind over 30 yrs
- Air quality 4/10 Moderate 5 unhealthy d/yr today · 6 by 30 yrs out
Nearby sold comps map
Loading sold comps map…
Walkable amenities ~0.75 mi
Loading nearby amenities…
Taxation est. · year 1
- Rental income
- $13,377
- − Mortgage interest
- −$2,465
- − Property taxes
- −$191
- − Insurance
- −$220
- − Repairs & maintenance
- −$1,070
- − Management
- −$1,070
- − Depreciation
- −$1,280
- Taxable income
- $7,081
- Est. tax owed @ 24.0%
- −$1,699
- After-tax cash flow
- $5,688/yr
For passive investors: Depreciation is non-cash, so a rental often shows a tax loss while cash-flowing — sheltering income. Rental losses are passive: they offset passive income freely, and up to $25,000/yr can offset ordinary (W-2) income if you actively participate and your MAGI is under $100k (phasing out to $0 by $150k); unused losses carry forward. On sale, claimed depreciation is recaptured at up to 25%, and gains may owe capital-gains tax (a 1031 exchange can defer both). Figures are a year-1 estimate at your 24.0% rate — not tax advice; consult a CPA.
Schools (NCES district)
- District
- St. Louis City
- NCES district ID
- 2929280
- Math proficiency
- 10% ▼ -6.00%
- Reading proficiency
- 18% ▼ -3.00%
- Median HH income
- $35,685
- Composite
- 11.54/100
- National rank
- #9699
- State rank
- #312 of 324 in MO
Livability — St. Louis
No livability data for this city. (Only ~50 U.S. cities are tracked.)
Census & demographics
- Census place
- St. Louis, MO
- City population
- 283,259
- Population (ZIP)
- 9,082
Population outlook (St. Louis County) Hauer SSP2
- Today (2025)
- 315,737 people
- By 2030
- 313,865 · -0.6%
- By 2040
- 305,439 · -3.3%
- By 2050
- 296,529 · -6.1%
- By 2075
- 271,028 · -14.2%
- By 2100
- 255,359 · -19.1%
Race, ethnicity, and origin ACS 2023
- Neighborhood character
- Predominantly Black (89%)
- Race & ethnicity
- Black 89% White 8% Hispanic / Latino 2% Two or more races 2%
- Common ancestry
- Lithuanian 1%
- Foreign-born
- 1% · Canada
- Languages at home
- 98% English-only · Spanish 1%
Political lean MEDSL · St. Louis
- 2024 margin
- Solid D (+64.7) · D 81.4% · R 16.7% · Other 2.0%
- 2008→2024 swing
- -3.5pp toward R · 2008: 68.2pp · 2024: 64.7pp
- All cycles
- 2024: D+64.7 2020: D+66.2 2016: D+63.7 2012: D+66.6 2008: D+68.2
Not yet ingested
- Civics
- —
Market trends
- HPI YoY
- ▼ -1.75%
- Current HPI
- 92.7423
- Rent YoY
- —
- Metro
- —
- State GDP YoY
- ▲ 1.84%
- F500 in state
- 20
Industry mix (Fortune 500 HQ in MO)
| Industry | F500 HQs | Revenue |
|---|---|---|
| Healthcare | 1 | $163B |
|
||
| Insurance | 1 | $21B |
|
||
| Industrial Technology | 1 | $17B |
|
||
| Retail | 1 | $16B |
|
||
| Industrial Distribution | 1 | $10B |
|
||
| Utilities | 1 | $9B |
|
||
Price history
-31.2% since first listed9 events — show timeline
- 2026-06-04 Coming Soon $55,000 MARIS as Distributed by MLS Grid
- 2026-02-13 Listed $57,800 MARIS as Distributed by MLS Grid
- 2026-01-30 Listed $57,800 MARIS as Distributed by MLS Grid
- 2025-12-29 Price Changed $75,000 MARIS as Distributed by MLS Grid
- 2025-12-03 Relisted — MARIS as Distributed by MLS Grid
- 2025-11-06 Contingent — MARIS as Distributed by MLS Grid
- 2025-10-09 Price Changed $70,000 MARIS as Distributed by MLS Grid
- 2025-09-17 Listed $80,000 MARIS as Distributed by MLS Grid
- 1992-03-10 Sold (Public Records) — Public Records
Property tax history
-0.7%/yrLatest (2024): $191 · +4.4% YoY. Source: county tax records.
Cash-flow waterfall
monthlySold comps — $/sqft
last 12 mo · ≤1 miLoading sold comps…