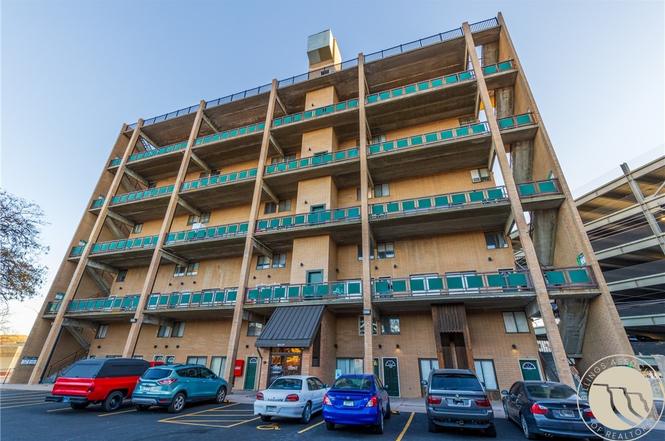
300 N 25th St #401 · Billings, MT
Flood risk 5/10 · Moderate
- FEMA flood zone
- X (unshaded)
- Chance of flooding over 30 yrs
- 0.67%
- Est. flood insurance / yr
- $507 – $1,088
Fire risk 4/10 · Minor
- Est. fire insurance / yr
- $918 – $1,706
Heat risk 3/10 · Minor
- Hot days now (above 95°F)
- 7 days/yr
- Hot days in 30 yrs
- 15 days/yr
Wind risk 1/10 · Minimal
- Chance of severe wind over 30 yrs
- —
Air-quality risk 4/10 · Minor
- Unhealthy air days now
- 3 days/yr
- Unhealthy air days in 30 yrs
- 5 days/yr
Risk factors via First Street. Map © Google.
Why this score? — see what drove the D grade
The composite is a weighted blend of 9 inputs, each scored 0–100. Each bar is that input's sub-score; the figure is the points it added to the 100-point composite (weight × sub-score).
- Cash flow +10.9/30.0
- ARV discount +7.5/15.0
- 1% rule +6.1/10.0
- Livability +4.0/5.0
- Rent growth +3.5/5.0
- DSCR +3.2/10.0
- Schools +3.2/10.0
- Condition / age +2.5/5.0
- Appreciation +0.0/10.0
$120,000
🖨 Deal sheet 📄 Offer letter ✓ Due diligence
Listing remarks MLS
HOA is $305, electricity managed and billed by usage through HOA. Newer paint and floors. High rise condo in downtown. Deck area for BBQing out front. Private Deck out the back slider for relaxing! Incredible views of the downtown cityscape and rims. Main floor laundry facility in building. HOA includes water and exterior insurance (buyer would need contents insurance). Price has been reduced to adjust for higher than typical HOA-call agent for details. Located on 4th floor w/ elevator access! Won't qualify for FHA or VA. Cash or large down payment conventional possibly. Info deemed reliable but not guaranteed, buyer to verify. NOTE: property taxes are not included in HOA fees. PRESENTING ALL OFFERS FRIDAY 4/23/2021.
Key facts
- Private deck
- City views
- $275 HOA
Tags
Property features AI
Finance
- HOA & community: Homeowners association with a $275 monthly fee; HOA covers insurance, maintenance of grounds and structure, snow removal, trash, and water
Exterior
- Parking: No designated parking
- Utilities: Public water; Public sewer
- Home design: Residential condominium; Two levels; Brick construction; Located in Central Business District
- Construction: Brick exterior; Two-story building
- Exterior features: Deck; Patio
Interior
- Kitchen: Dishwasher; Electric range and oven; Microwave; Refrigerator; Range hood
- Bathrooms: One full bathroom
- Heating & cooling: Baseboard heating (electric); Window air conditioning units
- Interior features: Dishwasher; Electric Range / Oven / Range; Microwave; Refrigerator; Range Hood
Neighborhood map
What this means for you Summary
Snapshot
- This is a 2-bed/1.0-bath condo listed at $120k.
Deal economics
- At list price, monthly cash flow is $-53 ($-634/yr) — negative.
- To cash-flow at today's rent, offer at most $112k (6.4% below list).
- Meets the 1% rule at list price ($1k rent vs $120k).
- Recommended offer: $106k (12.0% below list) — sets the bar for market timing.
- Cap rate 5.8% vs local median 3.0% in Billings — top-decile yield for the area; either an underpriced asset or a hidden risk that comps aren't pricing in. Stress-test before assuming the spread holds.
Location & tenants
- Location reads 80/100 on livability (#10 in MT, #1,830 nationally) — a professional / high-income tenant draw. Strengths: amenities A+, commute A+, housing A+; Watch: schools D+, crime F.
- Billings H S (urban): math 29% / reading 45% proficiency, ranked #69 of 116 in MT (top 60%) — families likely to look elsewhere, expect single-tenant / working-renter base with shorter leases.
- Market conditions: Rents rising (+4.0%/yr); 279 active listings in the ZIP; 20 comparable units currently listed for rent nearby; rentals leasing fast (median 14d on market — plan ~1-2 weeks tenant-placement turnaround); 1,401 units permitted in Yellowstone County in 2024 (281 in 5+ unit buildings).
Forward outlook
- Local home prices are declining (-3.0%/yr); year-one equity from $830 of loan paydown is wiped out by about $4k of value loss. Plan a longer hold.
- Yellowstone County population projected at +26% by 2050 — long-run rental-demand tailwind backs the buy-and-hold thesis.
Negotiation context
- It's been on market 217 days — a 12% lower offer ($106k) is reasonable based on typical stale-listing flexibility.
- 2 sale attempts since 5y ago; this cycle's ask has dropped $16k (12%) from the opening price — seller is motivated, your offer sets the floor, not the list.
Risks & watch-outs
- Watch-outs: HOA is 21% of rent.
- Climate carrying-cost: moderate flood risk — expect insurance premiums to compound above CPI over the hold.
Questions for the listing agent
- What do current leases actually rent for vs. the listed asking? Can we see a recent rent roll and the last 12 months of T-12 income?
- It's been on market 217 days. Have you received any prior offers? Is the seller open to a 12% concession, seller financing, or rate buy-down credit?
- Built in 1971 — when were the roof, HVAC, electrical panel, plumbing, and water heater last replaced?
- What does the HOA fee cover, when was the last increase, and are there any pending special assessments or reserve-fund shortfalls?
- Any open or pending special assessments — roof, HVAC, plumbing, elevator, façade? What's the per-unit balance and payoff schedule, and is the seller paying it off at close or rolling it to the buyer?
- Why hasn't it sold? Are there any deal-killer items the seller is aware of (foundation, flood, title, zoning, code violations)?
- Is there a deadline driving the sale (1031 exchange, divorce, estate, relocation)? That informs how much negotiation room exists.
- Schools are D-rated, which usually means shorter tenancies and higher turnover. Who's the typical renter profile here, and what's been the actual vacancy rate?
- Crime grade is F in this area — have there been break-ins, vandalism, or insurance claims at this property in the last 3 years? What carrier currently insures it and at what premium?
- The area grade is low — what's the realistic commute time and amenity access for the typical tenant pool here? Any planned neighborhood developments (good or bad) we should know about?
- What's the average days-on-market for RENTAL listings here right now (not sales)? A rising rental-DOM trend means longer vacancies and softer asking-rent achievability than the comps imply.
- What's the recent tenant-quality profile in this submarket — average credit score on applications, eviction rate, late-payment / NSF rate, and stable-employment percentage? A property-management company in the area should have these aggregated.
- How much new apartment / multifamily construction is in the pipeline within 1–3 miles? Heavy new supply (>2% of stock underway) typically softens rents 12–24 months out; light construction supports rent growth.
Investment metrics
- 1% rule
- 1.11% ✓
- Cap rate
- 5.76%
- Cash-on-cash
- -1.89%
- DSCR
- 0.92
- GRM
- 7.5
CMA / ARV
No comps found within radius.
Projected returns pro-forma
-3.0% appreciation · 3.96% rent growth · sell at horizon
- IRR
- -17.8%
- Equity multiple
- 0.37×
- Total profit
- $-21,322
- Equity at exit
- $17,892
- IRR
- -7.4%
- Equity multiple
- 0.50×
- Total profit
- $-16,700
- Equity at exit
- $10,375
Cash invested: $33,600 (down + closing). Projections, not guarantees.
Landlord ↔ Tenant lean methodology
- Overall (STATE)
- 82 Strongly Landlord-Friendly
- State Montana
- 82 Strongly Landlord-Friendly · R+11
- County
- — inherits STATE
- City
- — inherits STATE
ZIP-level market 59101
- Rents YoY
- 4.0%
- Active inventory
- 279
- Price-to-rent
- 7.5×
Monthly cashflow live
- Estimated rent
- $1,331 high interval (Pro) →
- Mortgage (P&I)
- −$629
- Tax est. 1.5%
- −$150 /mo · $1,800/yr
- Insurance
- −$50
- HOA
- −$275
- Vacancy / Maint / Mgmt
- −$280
- Net cashflow
- $-53
Break-even live
UW: 25.0% down · 7.5% · 30yr · 1.5% tax · 5.0% vac · 8.0% maint · 8.0% mgmt
Financing live
Cash to close
- Down payment
- $30,000
- Closing costs
- $3,600
- Reserves months
- —
- Total cash needed
- —
Loan-product check · same deal, 3 products live
Conventional
25% down · 7.5% · 30yr
- Down + closing
- —
- Monthly P&I
- —
- Monthly cashflow
- —
- DSCR
- —
- Eligible?
- —
Personal DTI + credit; lowest rate.
DSCR
20% down · 8.5% · 30yr
- Down + closing
- —
- Monthly P&I
- —
- Monthly cashflow
- —
- DSCR
- —
- Eligible?
- —
No personal income docs; deal must DSCR.
Hard money
10% down · 12.0% · 12mo
- Down + closing
- —
- Monthly P&I
- —
- Monthly cashflow
- —
- DSCR
- —
- Eligible?
- —
Short-term bridge; refi at stabilization.
Rent comps 20 comps
| Address | Beds | Baths | Sqft | Rent | $/sqft | DOM | Units | Dist |
|---|---|---|---|---|---|---|---|---|
| 300 N 25th St Apt 505 Billings, MT | 2.0 | 1.0 | 1000 | $1,250 | $1.25 | 13d | 1 | 0.03mi |
| 115 N 24th St Billings, MT | 1.0 | 1.0 | 587 | $1,112 | $1.89 | 13d | 2 | 0.15mi |
| 2310 1st Ave N Billings, MT | 2.0 | 1.0–2.0 | 915 | $2,025 | $2.21 | 13d | 1 | 0.22mi |
| 2119 8th Ave N Apt 1 Billings, MT | 2.0 | 1.0 | 1000 | $1,300 | $1.30 | 13d | 1 | 0.43mi |
| 708 N 31st St Billings, MT | 1.0 | 1.0 | 700 | $995 | $1.42 | 13d | 1 | 0.54mi |
| 24 Grand Ave Billings, MT | 2.0 | 1.5 | 1176 | $2,200 | $1.87 | 13d | 1 | 0.63mi |
| 103 Alderson Ave Unit 1 Billings, MT | 2.0 | 1.0 | 1152 | $1,100 | $0.95 | 21d | 1 | 0.71mi |
| 103 Alderson Ave Billings, MT | 2.0 | 1.0 | 1152 | $1,100 | $0.95 | 13d | 1 | 0.71mi |
| 113 N 35th St Billings, MT | 2.0 | 1.0 | 1200 | $1,800 | $1.50 | 13d | 1 | 0.72mi |
| 115 N 35th St Billings, MT | 1.0 | 1.0 | 1000 | $1,500 | $1.50 | 13d | 1 | 0.72mi |
| 715 S 28th St Billings, MT | 1.0–2.0 | 1.0 | 617 | $1,343 | $2.17 | 13d | 6 | 0.89mi |
| 129 Broadwater Ave Unit B Billings, MT | 1.0 | 1.0 | 850 | $885 | $1.04 | 13d | 1 | 0.95mi |
| 613 S 34th St Billings, MT | 1.0 | 1.0 | 714 | $1,100 | $1.54 | 21d | 1 | 1.00mi |
| 318 Yellowstone Ave Billings, MT | 2.0 | 1.0 | 1000 | $950 | $0.95 | 13d | 1 | 1.08mi |
| 238 Terry Ave Unit 2 Billings, MT | 2.0 | 1.0 | 768 | $1,275 | $1.66 | 13d | 1 | 1.17mi |
| 238 Terry Ave Unit 1 Billings, MT | 2.0 | 1.0 | 768 | $1,475 | $1.92 | 13d | 1 | 1.17mi |
| 520 Avenue B Unit B Billings, MT | 2.0 | 1.0 | 936 | $1,195 | $1.28 | 13d | 1 | 1.22mi |
| 517 Avenue F Unit 2 Billings, MT | 2.0 | 1.0 | 900 | $1,050 | $1.17 | 13d | 1 | 1.23mi |
| 607 Avenue F #4 Billings, MT | 2.0 | 1.0 | 1020 | $1,645 | $1.61 | 13d | 1 | 1.33mi |
| 421 5th St W Billings, MT | 1.0 | 1.0 | 778 | $975 | $1.25 | 13d | 1 | 1.38mi |
HOA detail condo
- Monthly dues
- $275 · $3,300/yr
- Likely covers
- waterelectric
- Assessments
- None detected in remarks — confirm with the listing agent.
Listing history 22 events
-
2026-06-19days on market $120,000 Active 217 DOM
-
2026-06-18days on market $120,000 Active 216 DOM
-
2026-06-17days on market $120,000 Active 215 DOM
-
2026-06-16days on market $120,000 Active 214 DOM
-
2026-06-15days on market $120,000 Active 213 DOM
-
2026-06-14days on market $120,000 Active 211 DOM
-
2026-06-13days on market $120,000 Active 210 DOM
-
2026-06-10days on market $120,000 Active 208 DOM
-
2026-06-09days on market $120,000 Active 207 DOM
-
2026-06-08days on market $120,000 Active 206 DOM
-
2026-06-07days on market $120,000 Active 205 DOM
-
2026-06-05days on market $120,000 Active 202 DOM
-
2026-06-02days on market $120,000 Active 200 DOM
-
2026-06-01days on market $120,000 Active 199 DOM
-
2026-05-31days on market $120,000 Active 198 DOM
-
2026-05-30days on market $120,000 Active 197 DOM
-
2026-05-09price $120,000
-
2026-05-02price $125,000
-
2026-04-18price $130,000
-
2025-11-14$136,000 Active
-
2021-07-09soldstatus 726-char remark
Show marketing remark (726 chars)
HOA is $305, electricity managed and billed by usage through HOA. Newer paint and floors. High rise condo in downtown. Deck area for BBQing out front. Private Deck out the back slider for relaxing! Incredible views of the downtown cityscape and rims. Main floor laundry facility in building. HOA includes water and exterior insurance (buyer would need contents insurance). Price has been reduced to adjust for higher than typical HOA-call agent for details. Located on 4th floor w/ elevator access! Won't qualify for FHA or VA. Cash or large down payment conventional possibly. Info deemed reliable but not guaranteed, buyer to verify. NOTE: property taxes are not included in HOA fees. PRESENTING ALL OFFERS FRIDAY 4/23/2021.
-
2021-04-20$75,000 726-char remark
Show marketing remark (726 chars)
HOA is $305, electricity managed and billed by usage through HOA. Newer paint and floors. High rise condo in downtown. Deck area for BBQing out front. Private Deck out the back slider for relaxing! Incredible views of the downtown cityscape and rims. Main floor laundry facility in building. HOA includes water and exterior insurance (buyer would need contents insurance). Price has been reduced to adjust for higher than typical HOA-call agent for details. Located on 4th floor w/ elevator access! Won't qualify for FHA or VA. Cash or large down payment conventional possibly. Info deemed reliable but not guaranteed, buyer to verify. NOTE: property taxes are not included in HOA fees. PRESENTING ALL OFFERS FRIDAY 4/23/2021.
ⓘ Source: listings_history table (triggers on properties + properties_extension) + one-shot
backfill from property_details.listing_events for pre-trigger history.
Climate risk First Street
- Flood 5/10 Major FEMA zone X (unshaded) · 67% chance over 30 yrs
- Wildfire 4/10 Moderate
- Heat 3/10 Moderate 7 d/yr ≥95°F today · 15 d/yr by 30 yrs out
- Wind 1/10 Low
- Air quality 4/10 Moderate 3 unhealthy d/yr today · 5 by 30 yrs out
Nearby sold comps map
Loading sold comps map…
Walkable amenities ~0.75 mi
Loading nearby amenities…
Taxation est. · year 1
- Rental income
- $15,972
- − Mortgage interest
- −$6,722
- − Property taxes
- −$1,800
- − Insurance
- −$600
- − Repairs & maintenance
- −$1,278
- − Management
- −$1,278
- − HOA
- −$3,300
- − Depreciation
- −$3,491
- Taxable loss
- −$2,496
- Est. tax savings @ 24.0%
- +$599
- After-tax cash flow
- $-35/yr
For passive investors: Depreciation is non-cash, so a rental often shows a tax loss while cash-flowing — sheltering income. Rental losses are passive: they offset passive income freely, and up to $25,000/yr can offset ordinary (W-2) income if you actively participate and your MAGI is under $100k (phasing out to $0 by $150k); unused losses carry forward. On sale, claimed depreciation is recaptured at up to 25%, and gains may owe capital-gains tax (a 1031 exchange can defer both). Figures are a year-1 estimate at your 24.0% rate — not tax advice; consult a CPA.
Schools (NCES district)
- District
- Billings H S
- NCES district ID
- 3003900
- Math proficiency
- 29% ▼ -4.00%
- Reading proficiency
- 45% ▲ 2.00%
- Median HH income
- $49,863
- Composite
- 31.93/100
- National rank
- #5848
- State rank
- #69 of 116 in MT
Livability — Billings
- Score
- 80/100
- State rank
- #10
- US rank
- #1830
Category grades
Schools grade is shown separately in the Schools card above.
Census & demographics
- Census place
- Billings, MT
- County
- Yellowstone County · 159,426 people
- City population
- 147,124
- Metro
- Billings, MT
- Population (ZIP)
- 42,250
- Household income
- $58,598
- Rent vs Own
- Severe rent burden
- 1534.0
Population outlook (Yellowstone County) Hauer SSP2
- Today (2025)
- 176,227 people
- By 2030
- 185,619 · +5.3%
- By 2040
- 203,543 · +15.5%
- By 2050
- 221,100 · +25.5%
- By 2075
- 266,931 · +51.5%
- By 2100
- 301,141 · +70.9%
Race, ethnicity, and origin ACS 2023
- Neighborhood character
- Predominantly White (75%)
- Race & ethnicity
- White 75% Hispanic / Latino 9% Native American 9% Two or more races 8% Black 1%
- Hispanic origin (detail)
- Mexican 6%
- Common ancestry
- Portuguese 6% Italian 2% Lithuanian 2%
- Foreign-born
- 2% · Canada
- Languages at home
- 96% English-only · Spanish 1%
Political lean MEDSL · Yellowstone
- 2024 margin
- Strong R (+27.1) · D 34.9% · R 62.0% · Other 3.1%
- 2008→2024 swing
- -20.8pp toward R · 2008: -6.3pp · 2024: -27.1pp
- All cycles
- 2024: R+27.1 2020: R+24.0 2016: R+27.1 2012: R+20.6 2008: R+6.3
Not yet ingested
- Civics
- —
Market trends
- HPI YoY
- ▼ -191.74%
- Current HPI
- 201.7039
- Rent YoY
- ▲ 3.96%
- Metro
- Billings, MT
- State GDP YoY
- ▲ 3.41%
- F500 in state
- 2
Industry mix (Fortune 500 HQ in MT)
| Industry | F500 HQs | Revenue |
|---|---|---|
| Technology / Analytics | 1 | $2B |
|
||
Price history
+60.0% since first listed6 events — show timeline
- 2026-05-09 Price Changed $120,000 BMTMLS
- 2026-05-02 Price Changed $125,000 BMTMLS
- 2026-04-18 Price Changed $130,000 BMTMLS
- 2025-11-14 Listed $136,000 BMTMLS
- 2021-07-09 Sold (MLS) — BMTMLS
- 2021-04-20 Listed $75,000 BMTMLS
Cash-flow waterfall
monthlySold comps — $/sqft
last 12 mo · ≤1 miLoading sold comps…