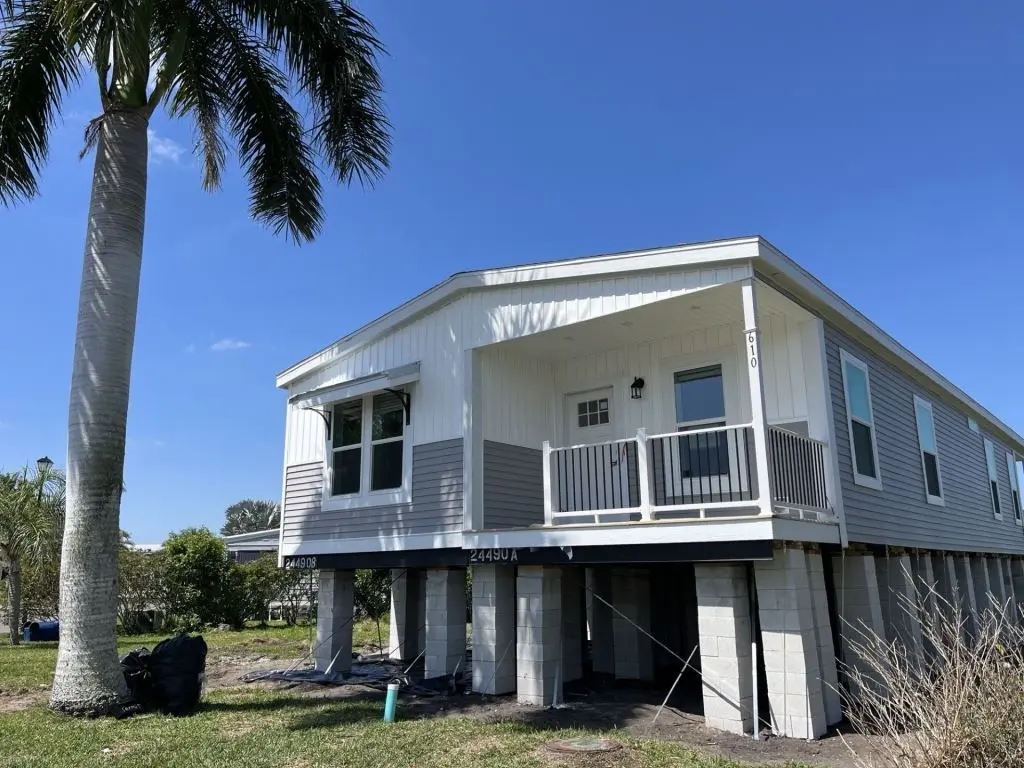
610 Riverview Dr · Bradenton, FL
Flood risk 6/10 · Moderate
- FEMA flood zone
- X (unshaded)
- Chance of flooding over 30 yrs
- 0.58%
- Est. flood insurance / yr
- $507 – $1,088
Fire risk 1/10 · Minimal
- Est. fire insurance / yr
- $947 – $1,759
Heat risk 10/10 · Severe
- Hot days now (above 107°F)
- 7 days/yr
- Hot days in 30 yrs
- 29 days/yr
Wind risk 10/10 · Severe
- Chance of severe wind over 30 yrs
- 99.0%
Air-quality risk 3/10 · Minor
- Unhealthy air days now
- 3 days/yr
- Unhealthy air days in 30 yrs
- 3 days/yr
Risk factors via First Street. Map © Google.
Why this score? — see what drove the C- grade
The composite is a weighted blend of 9 inputs, each scored 0–100. Each bar is that input's sub-score; the figure is the points it added to the 100-point composite (weight × sub-score).
- Cash flow +18.1/30.0
- ARV discount +7.5/15.0
- DSCR +5.7/10.0
- 1% rule +4.8/10.0
- Schools +4.4/10.0
- Livability +4.0/5.0
- Condition / age +3.8/5.0
- Rent growth +2.5/5.0
- Appreciation +0.0/10.0
$246,000
🖨 Deal sheet 📄 Offer letter ✓ Due diligence
Listing remarks
55+ age qualified community. Welcome to Colony Cove, a 55+ age-qualified, active and vibrant community where you can find yourself in your dream home. We have a stunning, brand-new Cavco Home in the Raleigh w/ Full Rear Porch Floor Plan, a 3-bedroom, 2 bath home for sale featuring 1,565 sq. ft. of beautifully designed living space. Located in Ellenton FL, this property offers the perfect blend of modern amenities and timeless charm. Step inside to find an open-concept floor plan, high ceilings, and luxury amenities. The kitchen boasts an impressive amount of countertop space and storage, perfect for both everyday living and entertaining. The spacious owner's suite offers a peaceful retreat,
Key facts
- Built 2026
- Listed 56 days
Property features AI
Finance
- Financial info: List price $246,000
Exterior
- Home design: Single-family property (Raleigh plan) located at 610 Riverview Dr, Ellenton, FL 34222
- Exterior features: Living area approximately 1,564
Interior
- Bedrooms: 3 bedrooms
- Bathrooms: 2 full bathrooms
- Interior features: Spec home — Raleigh plan with rear porch (Limited Series)
Neighborhood map
What this means for you Summary
Snapshot
- This is a 3-bed/2.0-bath manufactured listed at $246k. Condition is rated good.
Deal economics
- At list price, monthly cash flow is $214 ($3k/yr) — positive.
- The deal already cash-flows at list — no discount required.
- To meet the 1% rule (rent ≥ 1% of price), the offer needs to be $242k (1.5% below list).
- Recommended offer: $239k (3.0% below list) — sets the bar for market timing.
- Cap rate 7.3% vs local median 3.6% in Bradenton — top-decile yield for the area; either an underpriced asset or a hidden risk that comps aren't pricing in. Stress-test before assuming the spread holds.
Location & tenants
- Location reads 81/100 on livability (#101 in FL, #1,528 nationally) — a professional / high-income tenant draw. Strengths: commute A+, cost of living A+, housing A+; Watch: employment D+, crime D, amenities F.
- Manatee (suburban): math 54% / reading 50% proficiency, ranked #26 of 73 in FL (top 36%) — acceptable for families but not a draw, mixed tenant base, ~2y average lease.
- Market conditions: 182 active listings in the ZIP; 21 comparable units currently listed for rent nearby; rentals at typical pace (median 24d on market — plan ~3-4 weeks tenant-placement turnaround); 7,472 units permitted in Manatee County in 2024 (1,782 in 5+ unit buildings).
- At $2,423/mo this rent would consume 45% of the median local household income ($64k/yr) (locally 313% of renters already pay >50% of income on rent) — very limited rent-growth headroom before tenants either downsize or default.
Forward outlook
- Local home prices are declining (-3.0%/yr); year-one equity from $2k of loan paydown is wiped out by about $7k of value loss. Plan a longer hold.
- Manatee County population projected at +43% by 2050 — long-run rental-demand tailwind backs the buy-and-hold thesis.
Negotiation context
- It's been on market 56 days — a 3% lower offer ($239k) is reasonable based on typical stale-listing flexibility.
Risks & watch-outs
- Climate carrying-cost: major flood risk; severe wind risk, 99% chance of damaging wind over 30y; extreme-heat days projected 7→29/yr by 2055 (HVAC capex compounding) — expect insurance premiums to compound above CPI over the hold.
Questions for the listing agent
- It's been on market 56 days. Have you received any prior offers? Is the seller open to a 3% concession, seller financing, or rate buy-down credit?
- Is there a deadline driving the sale (1031 exchange, divorce, estate, relocation)? That informs how much negotiation room exists.
- Crime grade is D in this area — have there been break-ins, vandalism, or insurance claims at this property in the last 3 years? What carrier currently insures it and at what premium?
- What's the average days-on-market for RENTAL listings here right now (not sales)? A rising rental-DOM trend means longer vacancies and softer asking-rent achievability than the comps imply.
- What's the recent tenant-quality profile in this submarket — average credit score on applications, eviction rate, late-payment / NSF rate, and stable-employment percentage? A property-management company in the area should have these aggregated.
- How much new for-sale + rental construction is in the pipeline within 1–3 miles? Heavy new supply typically softens prices + rents 12–24 months out; constrained supply supports both.
Investment metrics
- 1% rule
- 0.98% ✗
- Cap rate
- 7.34%
- Cash-on-cash
- 3.73%
- DSCR
- 1.17
- GRM
- 8.5
CMA / ARV
- ARV (on-the-fly)
- $162,656
- Comps found
- 7
Show comp detail 7 sales within ~0.75 mi
| Address | Dist | Beds/Ba | Sqft | Sold | Price | $/sf | Match |
|---|---|---|---|---|---|---|---|
| 100 Whipporwill Ct | 0.74mi | 2/2.0 (-1) | 1,606 (+3%) | 2mo | $150,000 | $93 | 54 |
| 85 Meadow Cir | 0.66mi | 2/2.0 (-1) | 1,620 (+4%) | 11mo | $241,000 | $149 | 49 |
| 99 Meadow Cir | 0.58mi | 2/2.0 (-1) | 1,404 (-10%) | 4mo | $120,000 | $85 | 48 |
| 77 Spoonbill Ln | 0.59mi | 2/2.0 (-1) | 1,352 (-14%) | 2mo | $140,000 | $104 | 43 |
| 137 Osprey Cir | 0.65mi | 2/2.0 (-1) | 1,352 (-14%) | 3mo | $190,000 | $141 | 40 |
| 100 Meadow Cir | 0.57mi | 2/2.0 (-1) | 1,390 (-11%) | 13mo | $85,000 | $61 | 39 |
| 82 Spoonbill Ln | 0.62mi | 2/2.0 (-1) | 1,400 (-10%) | 12mo | $215,000 | $154 | 38 |
Match score weights: distance 35% · size 25% · config 20% · recency 20%. Top-matched comps best support the ARV.
Projected returns pro-forma
-3.0% appreciation · 3.0% rent growth · sell at horizon
- IRR
- -10.4%
- Equity multiple
- 0.62×
- Total profit
- $-26,188
- Equity at exit
- $36,679
- IRR
- -1.1%
- Equity multiple
- 0.93×
- Total profit
- $-5,094
- Equity at exit
- $21,270
Cash invested: $68,880 (down + closing). Projections, not guarantees.
Landlord ↔ Tenant lean methodology
- Overall (STATE)
- 87 Strongly Landlord-Friendly
- State Florida
- 87 Strongly Landlord-Friendly · R+3
- County
- — inherits STATE
- City
- — inherits STATE
ZIP-level market 34222
- Home prices YoY
- -26.9%
- Active inventory
- 182
- Price-to-rent
- 8.5×
Monthly cashflow live
- Estimated rent
- $2,423 high interval (Pro) →
- Mortgage (P&I)
- −$1,290
- Tax est. 1.5%
- −$308 /mo · $3,690/yr
- Insurance
- −$102
- HOA
- −$0
- Vacancy / Maint / Mgmt
- −$509
- Net cashflow
- $214
Break-even live
UW: 25.0% down · 7.5% · 30yr · 1.5% tax · 5.0% vac · 8.0% maint · 8.0% mgmt
Financing live
Cash to close
- Down payment
- $61,500
- Closing costs
- $7,380
- Reserves months
- —
- Total cash needed
- —
Loan-product check · same deal, 3 products live
Conventional
25% down · 7.5% · 30yr
- Down + closing
- —
- Monthly P&I
- —
- Monthly cashflow
- —
- DSCR
- —
- Eligible?
- —
Personal DTI + credit; lowest rate.
DSCR
20% down · 8.5% · 30yr
- Down + closing
- —
- Monthly P&I
- —
- Monthly cashflow
- —
- DSCR
- —
- Eligible?
- —
No personal income docs; deal must DSCR.
Hard money
10% down · 12.0% · 12mo
- Down + closing
- —
- Monthly P&I
- —
- Monthly cashflow
- —
- DSCR
- —
- Eligible?
- —
Short-term bridge; refi at stabilization.
Rent comps 21 comps
| Address | Beds | Baths | Sqft | Rent | $/sqft | DOM | Units | Dist |
|---|---|---|---|---|---|---|---|---|
| 482 Outer Dr Unit NA Ellenton, FL | 3.0 | 2.0 | 1400 | $1,600 | $1.14 | 3d | 1 | 0.30mi |
| 8314 Nancy Ln Ellenton, FL | 2.0 | 2.0 | 1404 | $1,895 | $1.35 | 23d | 1 | 1.05mi |
| 5942 Factory Shops Blvd Ellenton, FL | 1.0–3.0 | 1.0–2.0 | 953 | $3,300 | $3.46 | 1d | 67 | 1.09mi |
| 3808 Sunset Dr Ellenton, FL | 3.0 | 2.0 | 1441 | $1,699 | $1.18 | 21d | 1 | 1.10mi |
| 2710 59th Dr E Ellenton, FL | 1.0–3.0 | 1.0–2.0 | 1149 | $2,829 | $2.46 | 2d | 37 | 1.12mi |
| 3119 61st Dr E Ellenton, FL | 3.0 | 2.0 | 1662 | $2,550 | $1.53 | 3d | 1 | 1.16mi |
| 7711 Desoto Dr Ellenton, FL | 2.0 | 2.5 | 1356 | $1,599 | $1.18 | 14d | 1 | 1.22mi |
| 3908 Lemonwood Dr N Ellenton, FL | 2.0 | 2.0 | 1400 | $1,750 | $1.25 | 23d | 1 | 1.25mi |
| 3931 Day Bridge Pl Ellenton, FL | 3.0 | 2.0 | 1250 | $2,295 | $1.84 | 3d | 1 | 1.30mi |
| 1143 Riverscape St Unit A Bradenton, FL | 3.0 | 2.0 | 1748 | $6,500 | $3.72 | 14d | 1 | 1.31mi |
| 6411 Grand Estuary Trl #401 Bradenton, FL | 2.0 | 2.0 | 1156 | $2,325 | $2.01 | 15d | 1 | 1.36mi |
| 6515 Grand Estuary Trl #107 Bradenton, FL | 2.0 | 2.0 | 1156 | $3,950 | $3.42 | 23d | 1 | 1.37mi |
| 6519 Grand Estuary Trl Bradenton, FL | 2.0 | 2.0 | 1156 | $3,000 | $2.60 | 23d | 2 | 1.38mi |
| 6611 Grand Estuary Trl Bradenton, FL | 2.0 | 2.0 | 1561 | $2,350 | $1.51 | 23d | 2 | 1.41mi |
| 6611 Grand Estuary Trl #204 Bradenton, FL | 2.0 | 2.0 | 1561 | $2,500 | $1.60 | 15d | 1 | 1.41mi |
| 6512 Grand Estuary Trl #102 Bradenton, FL | 3.0 | 2.0 | 2108 | $3,400 | $1.61 | 23d | 1 | 1.42mi |
| 6705 Grand Estuary Trl #104 Bradenton, FL | 2.0 | 2.0 | 1561 | $2,500 | $1.60 | 23d | 1 | 1.43mi |
| 6715 Grand Estuary Trl #106 Bradenton, FL | 2.0 | 2.0 | 1600 | $5,000 | $3.12 | 23d | 1 | 1.45mi |
| 6614 Grand Estuary Trl #101 Bradenton, FL | 3.0 | 2.0 | 1786 | $3,200 | $1.79 | 23d | 1 | 1.47mi |
| 6819 Grand Estuary Trl #205 Bradenton, FL | 2.0 | 2.0 | 1561 | $2,499 | $1.60 | 23d | 1 | 1.49mi |
| 7005 River Hammock Dr #305 Bradenton, FL | 2.0 | 2.0 | 1121 | $2,500 | $2.23 | 23d | 1 | 1.50mi |
Listing history 14 events
-
2026-06-18days on market $246,000 Active 56 DOM
-
2026-06-17days on market $246,000 Active 55 DOM
-
2026-06-16days on market $246,000 Active 54 DOM
-
2026-06-15days on market $246,000 Active 53 DOM
-
2026-06-13days on market $246,000 Active 51 DOM
-
2026-06-13days on market $246,000 Active 50 DOM
-
2026-06-10days on market $246,000 Active 48 DOM
-
2026-06-09days on market $246,000 Active 47 DOM
-
2026-06-08days on market $246,000 Active 46 DOM
-
2026-06-08days on market $246,000 Active 45 DOM
-
2026-06-03days on market $246,000 Active 41 DOM
-
2026-06-02days on market $246,000 Active 40 DOM
-
2026-06-01days on market $246,000 Active 39 DOM
-
2026-05-31days on market $246,000 Active 38 DOM
ⓘ Source: listings_history table (triggers on properties + properties_extension) + one-shot
backfill from property_details.listing_events for pre-trigger history.
Climate risk First Street
- Flood 6/10 Major FEMA zone X (unshaded) · 58% chance over 30 yrs
- Wildfire 1/10 Low
- Heat 10/10 Extreme 7 d/yr ≥107°F today · 29 d/yr by 30 yrs out
- Wind 10/10 Extreme 99% chance of damaging wind over 30 yrs
- Air quality 3/10 Moderate 3 unhealthy d/yr today · 3 by 30 yrs out
Nearby sold comps map
Loading sold comps map…
Walkable amenities ~0.75 mi
Loading nearby amenities…
Taxation est. · year 1
- Rental income
- $29,076
- − Mortgage interest
- −$13,780
- − Property taxes
- −$3,690
- − Insurance
- −$1,230
- − Repairs & maintenance
- −$2,326
- − Management
- −$2,326
- − Depreciation
- −$7,156
- Taxable loss
- −$1,432
- Est. tax savings @ 24.0%
- +$344
- After-tax cash flow
- $2,913/yr
For passive investors: Depreciation is non-cash, so a rental often shows a tax loss while cash-flowing — sheltering income. Rental losses are passive: they offset passive income freely, and up to $25,000/yr can offset ordinary (W-2) income if you actively participate and your MAGI is under $100k (phasing out to $0 by $150k); unused losses carry forward. On sale, claimed depreciation is recaptured at up to 25%, and gains may owe capital-gains tax (a 1031 exchange can defer both). Figures are a year-1 estimate at your 24.0% rate — not tax advice; consult a CPA.
Condition & rehab AI · 6 photos
This 55+ age-qualified community home is in good condition with a good condition score of 75. It has a good kitchen, bathrooms, exterior, and landscaping. The home is move-in ready and has a good resale and rental value.
Value-add opportunities
- Both Landscaping and curb appeal improvements — Enhances curb appeal and adds value
- Both Painting exterior and interior walls — Fresh paint can improve the home's appearance and value
- Both Landscaping and pool maintenance — Maintaining the pool and landscaping can attract more potential buyers
Renovation cost estimate screening
Value-add ROI direction
- Both Landscaping and curb appeal improvements — Enhances curb appeal and adds value ↑
- Both Painting exterior and interior walls — Fresh paint can improve the home's appearance and value ↑
- Both Landscaping and pool maintenance — Maintaining the pool and landscaping can attract more potential buyers ↑
ⓘ Cost ranges are severity-bucket heuristics (US national rule-of-thumb). Get contractor quotes + a written scope before underwriting a rehab budget.
Schools (NCES district)
- District
- Manatee
- NCES district ID
- 1201230
- Math proficiency
- 54% ▼ -6.00%
- Reading proficiency
- 50% ▼ -2.00%
- Median HH income
- $49,607
- Composite
- 44.43/100
- National rank
- #2806
- State rank
- #26 of 73 in FL
Livability — Bradenton
- Score
- 81/100
- State rank
- #101
- US rank
- #1528
Category grades
Schools grade is shown separately in the Schools card above.
Census & demographics
- County
- Manatee County · 416,364 people
- City population
- 227,091
- Metro
- North Port-Sarasota-Bradenton, FL
- Population (ZIP)
- 14,819
- Household income
- $64,355
- Rent vs Own
- Severe rent burden
- 313.0
Population outlook (Manatee County) Hauer SSP2
- Today (2025)
- 447,342 people
- By 2030
- 488,911 · +9.3%
- By 2040
- 567,934 · +27.0%
- By 2050
- 637,995 · +42.6%
- By 2075
- 781,970 · +74.8%
- By 2100
- 848,272 · +89.6%
Race, ethnicity, and origin ACS 2023
- Neighborhood character
- Predominantly White (70%)
- Race & ethnicity
- White 70% Hispanic / Latino 17% Two or more races 13% Black 7% Native American 2% Asian 1%
- Hispanic origin (detail)
- Mexican 8% Puerto Rican 2%
- Common ancestry
- Romanian 3% Slovak 2% Lithuanian 2%
- Foreign-born
- 8% · Canada, Jamaica, Vietnam
- Languages at home
- 88% English-only · Spanish 10% Other Indo-European 1% Vietnamese 1%
Political lean MEDSL · Manatee
- 2024 margin
- Strong R (+23.5) · D 37.9% · R 61.4%
- 2008→2024 swing
- -16.5pp toward R · 2008: -7.0pp · 2024: -23.5pp
- All cycles
- 2024: R+23.5 2020: R+16.1 2016: R+17.1 2012: R+12.5 2008: R+7.0
Not yet ingested
- Civics
- —
Market trends
- HPI YoY
- ▼ -107.75%
- Current HPI
- 293.2597
- Rent YoY
- —
- Metro
- North Port-Sarasota-Bradenton, FL
- State GDP YoY
- ▲ 3.28%
- F500 in state
- 36
Industry mix (Fortune 500 HQ in FL)
| Industry | F500 HQs | Revenue |
|---|---|---|
| Industrial Technology | 2 | $29B |
|
||
| Insurance | 2 | $17B |
|
||
| Retail | 1 | $60B |
|
||
| Technology Distribution | 1 | $58B |
|
||
| Homebuilding | 1 | $35B |
|
||
| Technology Manufacturing | 1 | $35B |
|
||
Cash-flow waterfall
monthlySold comps — $/sqft
last 12 mo · ≤1 miLoading sold comps…