 Triplex
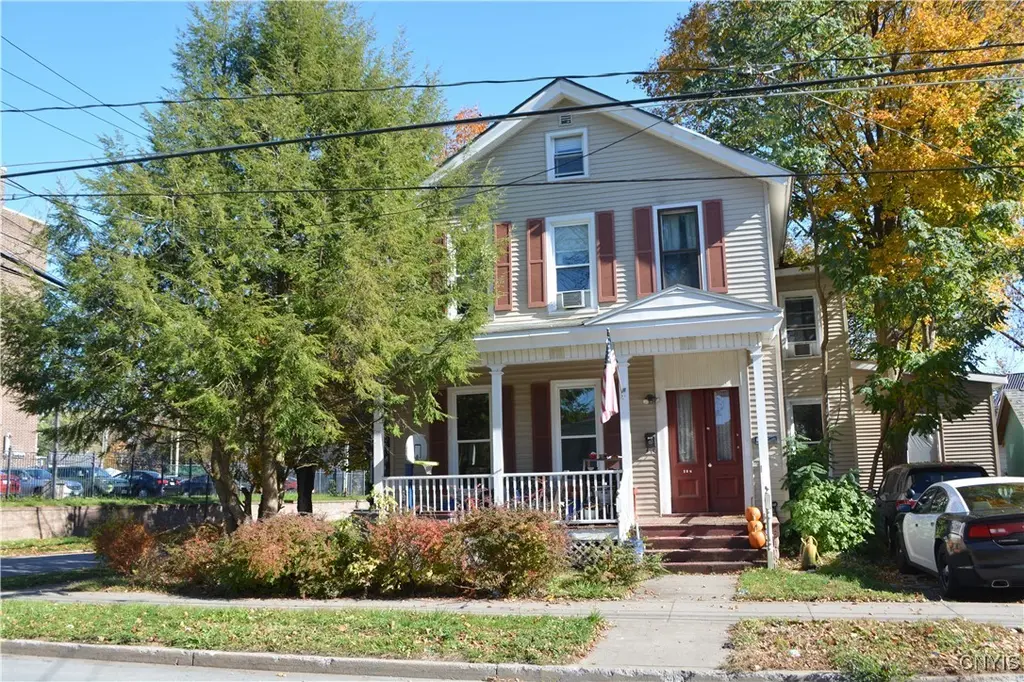
126 Turin St · Rome, NY
Flood risk 6/10 · Moderate
- FEMA flood zone
- X (unshaded)
- Chance of flooding over 30 yrs
- 0.74%
- Est. flood insurance / yr
- $473 – $860
Fire risk 1/10 · Minimal
- Est. fire insurance / yr
- $691 – $1,283
Heat risk 3/10 · Minor
- Hot days now (above 94°F)
- 7 days/yr
- Hot days in 30 yrs
- 17 days/yr
Wind risk 1/10 · Minimal
- Chance of severe wind over 30 yrs
- —
Air-quality risk 2/10 · Minimal
- Unhealthy air days now
- 0 days/yr
- Unhealthy air days in 30 yrs
- 1 days/yr
Risk factors via First Street. Map © Google.
Why this score? — see what drove the B grade
The composite is a weighted blend of 9 inputs, each scored 0–100. Each bar is that input's sub-score; the figure is the points it added to the 100-point composite (weight × sub-score).
- Cash flow +30.0/30.0
- ARV discount +12.6/15.0
- 1% rule +10.0/10.0
- DSCR +10.0/10.0
- Schools +3.5/10.0
- Livability +3.2/5.0
- Rent growth +2.5/5.0
- Condition / age +2.5/5.0
- Appreciation +0.0/10.0
$190,000
🖨 Deal sheet (PDF) 📄 Offer letter ✓ Due diligence
Multi-family units
County records classify this as Multi-Family (2-4 Unit). Listing-text estimate: 3 units. confirmed
Listing remarks MLS
Attention Investors or those who want to be! Build or start your portfolio with this three unit multi-family building! First floor unit has two bedrooms, living room, dining room, kitchen and laundry in basement. Second floor unit has two bedrooms, living room and kitchen. Third unit has a living room, kitchen and bedroom. Garage is currently used by first floor tenant. All utilities are paid by the owner for the two bed apartments (heat and electric) and the one bed apartment pays for their own heat and electric as it is separate. There are separate meters but there are only two furnaces (one heats the main apartments). All units are occupied and are in leases. Come check it out and see how to make your money work for you!
Key facts
- 6,098 sq ft lot
- Garage
- Built 1900
Neighborhood map
What this means for you Summary
Snapshot
- This is a 3 × 2-bed/?-bath units multifamily listed at $190k.
Deal economics
- At list price, monthly cash flow is $2k ($24k/yr) — positive. Per door: $679/mo.
- The deal already cash-flows at list — no discount required.
- Meets the 1% rule at list price ($4k rent vs $190k).
- Recommended offer: $167k (12.0% below list) — sets the bar for market timing.
- Cap rate 19.2% vs local median 5.6% in Rome — top-decile yield for the area; either an underpriced asset or a hidden risk that comps aren't pricing in. Stress-test before assuming the spread holds.
Location & tenants
- Location reads 64/100 on livability (#722 in NY) — a middle-class / working-renter tenant base. Strengths: cost of living A+, housing A+; Watch: health & safety C-, amenities F, commute F.
- Rome City School District (town): math 35% / reading 46% proficiency, ranked #516 of 590 in NY (top 88%) — families likely to look elsewhere, expect single-tenant / working-renter base with shorter leases.
- Zoned schools: Louis V Denti Elementary School (math 22% / reading 47%, grade F, #1,577 of 2,108 statewide, top 77%, 655 students, 59% FRL); Lyndon H Strough Middle School (math 20% / reading 40%, grade F, #539 of 729 statewide, top 74%, 829 students, 59% FRL); Rome Free Academy (math 85% / reading 98%, grade A+, #201 of 1,100 statewide, top 18%, 1,511 students, 51% FRL).
- Market conditions: 278 active listings in the ZIP; 204 units permitted in Oneida County in 2024 (68 in 5+ unit buildings).
Forward outlook
- Local home prices are declining (-3.0%/yr); year-one equity from $1k of loan paydown is wiped out by about $6k of value loss. Plan a longer hold.
- Oneida County population projected at -12% by 2050 — secular population decline; favor cash flow + early exit over multi-decade hold.
- At projected returns (-3.0% appreciation + 3.0% rent growth), your $53k cash investment doubles in ~3 years — after that, you're playing with house money.
Negotiation context
- It's been on market 226 days — a 12% lower offer ($167k) is reasonable based on typical stale-listing flexibility.
- 2 sale attempts since 17y ago with the ask held roughly flat each time — persistent listings suggest the price (not the market) is what's stuck; bring a comps-based counter.
- Current owner paid $49k; list at $190k implies a 288% gain — meaningful room to come down on a strong offer.
Risks & watch-outs
- Watch-outs: built in 1900 — expect roof / HVAC / electrical / plumbing capex.
- Climate carrying-cost: major flood risk — expect insurance premiums to compound above CPI over the hold.
Questions for the listing agent
- It's been on market 226 days. Have you received any prior offers? Is the seller open to a 12% concession, seller financing, or rate buy-down credit?
- Can we see the unit-by-unit rent roll, current vacancy, and any below-market leases? What's the average tenancy length?
- What capital expenditures (roof, boiler, parking lot, exteriors) have been made in the last 5 years, and what's planned in the next 2?
- Built in 1900 — when were the roof, HVAC, electrical panel, plumbing, and water heater last replaced?
- Why hasn't it sold? Are there any deal-killer items the seller is aware of (foundation, flood, title, zoning, code violations)?
- Is there a deadline driving the sale (1031 exchange, divorce, estate, relocation)? That informs how much negotiation room exists.
- Schools are F-rated, which usually means shorter tenancies and higher turnover. Who's the typical renter profile here, and what's been the actual vacancy rate?
- What's the average days-on-market for RENTAL listings here right now (not sales)? A rising rental-DOM trend means longer vacancies and softer asking-rent achievability than the comps imply.
- What's the recent tenant-quality profile in this submarket — average credit score on applications, eviction rate, late-payment / NSF rate, and stable-employment percentage? A property-management company in the area should have these aggregated.
- How much new apartment / multifamily construction is in the pipeline within 1–3 miles? Heavy new supply (>2% of stock underway) typically softens rents 12–24 months out; light construction supports rent growth.
Investment metrics
- 1% rule
- 2.19% ✓
- Cap rate
- 19.17%
- Cash-on-cash
- 45.97%
- DSCR
- 3.05
- GRM
- 3.8
CMA / ARV
- ARV (median comp)
- $214,322
- List price
- $190,000
- Delta
- -11.35%
- Verdict
- UNDERPRICED
- Comps
- 20 within 1.0 mi
Show comp detail 6 sales within ~0.75 mi
| Address | Dist | Beds/Ba | Sqft | Sold | Price | $/sf | Match |
|---|---|---|---|---|---|---|---|
| 112 Dean St | 0.12mi | 6/2.0 (+1) | 3,420 (+10%) | 2mo | $210,000 | $61 | 63 |
| 412 N Madison | 0.36mi | 6/5.0 (+1) | 3,100 (+0%) | 20mo | $120,000 | $39 | 57 |
| 312 N Washington St | 0.32mi | 5/3.0 | 3,528 (+14%) | 6mo | $20,000 | $6 | 52 |
| 326 W Court St | 0.47mi | 4/3.0 (-1) | 2,912 (-6%) | 10mo | $175,000 | $60 | 51 |
| 206 Maple St | 0.31mi | 6/2.0 (+1) | 2,680 (-13%) | 8mo | $213,550 | $80 | 43 |
| 111 East Gdn | 0.21mi | 6/2.0 (+1) | 2,718 (-12%) | 19mo | $195,500 | $72 | 41 |
Match score weights: distance 35% · size 25% · config 20% · recency 20%. Top-matched comps best support the ARV.
Projected returns pro-forma
-3.0% appreciation · 3.0% rent growth · sell at horizon
- IRR
- 43.2%
- Equity multiple
- 2.86×
- Total profit
- $99,045
- Equity at exit
- $28,330
- IRR
- 49.2%
- Equity multiple
- 5.76×
- Total profit
- $253,484
- Equity at exit
- $16,428
Cash invested: $53,200 (down + closing). Projections, not guarantees.
Landlord ↔ Tenant lean methodology
- Overall (STATE)
- 15 Strongly Tenant-Friendly
- State New York
- 15 Strongly Tenant-Friendly · D+10
- County
- — inherits STATE
- City
- — inherits STATE
ZIP-level market 13440
- Home prices YoY
- -8.0%
- Active inventory
- 278
- Price-to-rent
- 11.4×
Monthly cashflow live
- Estimated rent
- $4,155 medium interval (Pro) →
- Mortgage (P&I)
- −$996
- Tax from tax record
- −$169 /mo · $2,025/yr
- Insurance
- −$79
- HOA
- −$0
- Vacancy / Maint / Mgmt
- −$873
- Net cashflow
- $2,038
Break-even live
Sensitivity live
| Price | -10% $2,146 | -5% $2,092 | +0% $2,038 | +5% $1,984 | +10% $1,931 |
|---|---|---|---|---|---|
| Rent | -10% $1,710 | -5% $1,874 | +0% $2,038 | +5% $2,202 | +10% $2,366 |
| Rate | -1.0pp $2,134 | -0.5pp $2,087 | base $2,038 | +0.5pp $1,989 | +1.0pp $1,939 |
3-unit breakdown (identical units grouped — click to expand)
| Units | Beds | Baths | Est. rent |
|---|---|---|---|
| 3× units | 2 | — | $4,155 |
| #1 | 2 | — | $1,385 |
| #2 | 2 | — | $1,385 |
| #3 | 2 | — | $1,385 |
| Total (3 units) | $4,155 | ||
UW: 25.0% down · 7.5% · 30yr · 1.5% tax · 5.0% vac · 8.0% maint · 8.0% mgmt
Financing live
Cash to close
- Down payment
- $47,500
- Closing costs
- $5,700
- Reserves months
- —
- Total cash needed
- —
Loan-product check · same deal, 3 products live
Conventional
25% down · 7.5% · 30yr
- Down + closing
- —
- Monthly P&I
- —
- Monthly cashflow
- —
- DSCR
- —
- Eligible?
- —
Personal DTI + credit; lowest rate.
DSCR
20% down · 8.5% · 30yr
- Down + closing
- —
- Monthly P&I
- —
- Monthly cashflow
- —
- DSCR
- —
- Eligible?
- —
No personal income docs; deal must DSCR.
Hard money
10% down · 12.0% · 12mo
- Down + closing
- —
- Monthly P&I
- —
- Monthly cashflow
- —
- DSCR
- —
- Eligible?
- —
Short-term bridge; refi at stabilization.
Listing history 20 events
-
2026-06-21days on market $190,000 Active 226 DOM
-
2026-06-21days on market $190,000 Active 225 DOM
-
2026-06-18days on market $190,000 Active 223 DOM
-
2026-06-17days on market $190,000 Active 222 DOM
-
2026-06-16days on market $190,000 Active 221 DOM
-
2026-06-15days on market $190,000 Active 220 DOM
-
2026-06-13days on market $190,000 Active 218 DOM
-
2026-06-12days on market $190,000 Active 217 DOM
-
2026-06-09days on market $190,000 Active 214 DOM
-
2026-06-08days on market $190,000 Active 213 DOM
-
2026-06-07days on market $190,000 Active 212 DOM
-
2026-06-07days on market $190,000 Active 211 DOM
-
2026-06-04days on market $190,000 Active 208 DOM
-
2026-06-02days on market $190,000 Active 207 DOM
-
2026-06-01days on market $190,000 Active 206 DOM
-
2026-05-31days on market $190,000 Active 205 DOM
-
2025-11-07$190,000 Active 735-char remark
Show marketing remark (735 chars)
Attention Investors or those who want to be! Build or start your portfolio with this three unit multi-family building! First floor unit has two bedrooms, living room, dining room, kitchen and laundry in basement. Second floor unit has two bedrooms, living room and kitchen. Third unit has a living room, kitchen and bedroom. Garage is currently used by first floor tenant. All utilities are paid by the owner for the two bed apartments (heat and electric) and the one bed apartment pays for their own heat and electric as it is separate. There are separate meters but there are only two furnaces (one heats the main apartments). All units are occupied and are in leases. Come check it out and see how to make your money work for you!
-
2010-04-19soldstatus $49,000 1-char remark
Show marketing remark (1 chars)
-
-
2010-03-22soldstatus $49,000
-
2009-03-05$54,000 1-char remark
Show marketing remark (1 chars)
-
ⓘ Source: listings_history table (triggers on properties + properties_extension) + one-shot
backfill from property_details.listing_events for pre-trigger history.
Tax reassessment forecast NY · Partial reset (capped growth)
- Current annual tax
- $2,025 · $169/mo
- Projected year-2 tax
- $2,618 · $218/mo
- Expected delta
- +$593/yr (+$49/mo · 29.3%)
ⓘ Screening estimate from a state-policy table — verify with the county assessor before closing.
Climate risk First Street
- Flood 6/10 Major FEMA zone X (unshaded) · 74% chance over 30 yrs
- Wildfire 1/10 Low
- Heat 3/10 Moderate 7 d/yr ≥94°F today · 17 d/yr by 30 yrs out
- Wind 1/10 Low
- Air quality 2/10 Low 0 unhealthy d/yr today · 1 by 30 yrs out
Nearby sold comps map
Loading sold comps map…
Walkable amenities ~0.75 mi
Loading nearby amenities…
Taxation est. · year 1
- Rental income
- $49,860
- − Mortgage interest
- −$10,643
- − Property taxes
- −$2,025
- − Insurance
- −$950
- − Repairs & maintenance
- −$3,989
- − Management
- −$3,989
- − Depreciation
- −$5,527
- Taxable income
- $22,737
- Est. tax owed @ 24.0%
- −$5,457
- After-tax cash flow
- $19,001/yr
For passive investors: Depreciation is non-cash, so a rental often shows a tax loss while cash-flowing — sheltering income. Rental losses are passive: they offset passive income freely, and up to $25,000/yr can offset ordinary (W-2) income if you actively participate and your MAGI is under $100k (phasing out to $0 by $150k); unused losses carry forward. On sale, claimed depreciation is recaptured at up to 25%, and gains may owe capital-gains tax (a 1031 exchange can defer both). Figures are a year-1 estimate at your 24.0% rate — not tax advice; consult a CPA.
Schools (NCES district)
- District
- Rome City School District
- NCES district ID
- 3624900
- Math proficiency
- 35% ▼ -4.00%
- Reading proficiency
- 46% ▲ 10.00%
- Median HH income
- $46,406
- Composite
- 34.52/100
- National rank
- #5178
- State rank
- #516 of 590 in NY
Livability — Rome
- Score
- 64/100
- State rank
- #722
- US rank
- #13676
Category grades
Schools grade is shown separately in the Schools card above.
Census & demographics
- Census place
- Rome, NY
- City population
- 41,418
- Population (ZIP)
- 41,273
Population outlook (Oneida County) Hauer SSP2
- Today (2025)
- 225,223 people
- By 2030
- 220,384 · -2.1%
- By 2040
- 209,071 · -7.2%
- By 2050
- 197,920 · -12.1%
- By 2075
- 175,541 · -22.1%
- By 2100
- 148,491 · -34.1%
Race, ethnicity, and origin ACS 2023
- Neighborhood character
- Predominantly White (82%)
- Race & ethnicity
- White 82% Hispanic / Latino 7% Two or more races 6% Black 4% Asian 1%
- Hispanic origin (detail)
- Mexican 1% Puerto Rican 4%
- Common ancestry
- Romanian 9% Lithuanian 4% Slovak 1%
- Foreign-born
- 3% · Canada, China
- Languages at home
- 94% English-only · Spanish 3% Other Indo-European 1%
Political lean MEDSL · Oneida
- 2024 margin
- Strong R (+21.3) · D 39.4% · R 60.6%
- 2008→2024 swing
- -15.2pp toward R · 2008: -6.1pp · 2024: -21.3pp
- All cycles
- 2024: R+21.3 2020: R+15.5 2016: R+21.1 2012: R+5.3 2008: R+6.1
Not yet ingested
- Civics
- —
Market trends
- HPI YoY
- ▼ -29.58%
- Current HPI
- 339.3589
- Rent YoY
- —
- Metro
- —
- State GDP YoY
- ▲ 2.60%
- F500 in state
- 92
Industry mix (Fortune 500 HQ in NY)
| Industry | F500 HQs | Revenue |
|---|---|---|
| Financial Services | 10 | $950B |
|
||
| Consumer Goods | 9 | $162B |
|
||
| Insurance | 4 | $225B |
|
||
| Telecommunications | 2 | $144B |
|
||
| Pharmaceuticals | 2 | $112B |
|
||
| Media / Entertainment | 2 | $69B |
|
||
Price history
+251.9% since first listed4 events — show timeline
- 2025-11-07 Listed $190,000 CNYIS
- 2010-04-19 Sold (MLS) $49,000 CNYIS
- 2010-03-22 Sold (Public Records) $49,000 Public Records
- 2009-03-05 Listed $54,000 CNYIS
Property tax history
+1.7%/yrLatest (2025): $2,025 · +0.3% YoY. Source: county tax records.
Cash-flow waterfall
monthlySold comps — $/sqft
last 12 mo · ≤1 miLoading sold comps…