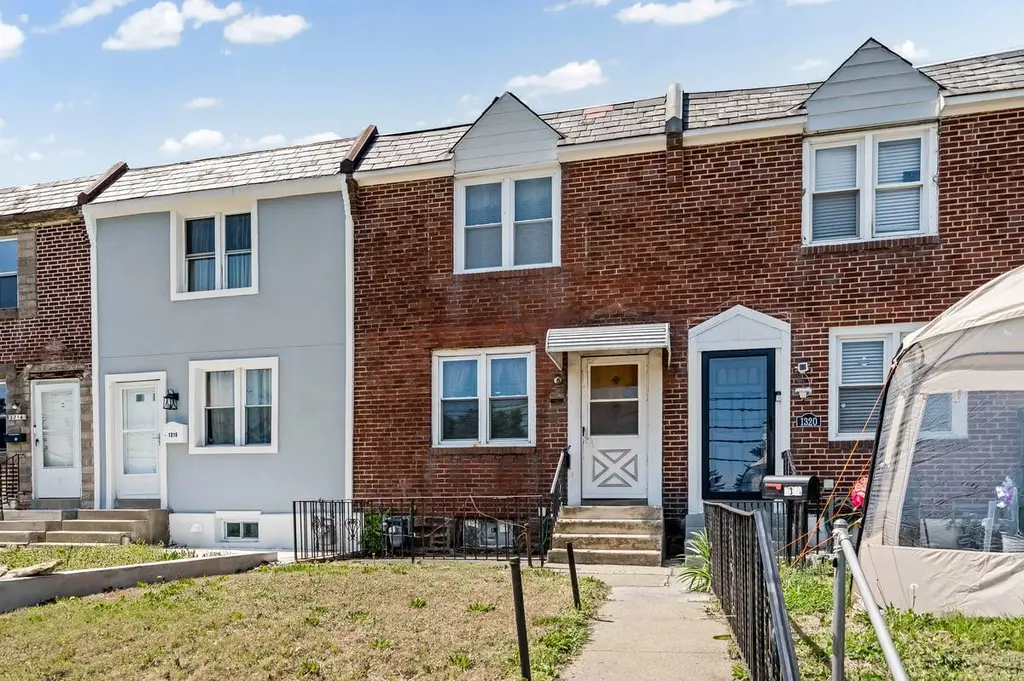
1318 Wycombe Ave · Darby, PA
Flood risk 1/10 · Minimal
- FEMA flood zone
- X (unshaded)
- Chance of flooding over 30 yrs
- 0.0%
- Est. flood insurance / yr
- $473 – $860
Fire risk 1/10 · Minimal
- Est. fire insurance / yr
- $511 – $949
Heat risk 6/10 · Moderate
- Hot days now (above 103°F)
- 7 days/yr
- Hot days in 30 yrs
- 15 days/yr
Wind risk 6/10 · Moderate
- Chance of severe wind over 30 yrs
- 27.0%
Air-quality risk 4/10 · Minor
- Unhealthy air days now
- 3 days/yr
- Unhealthy air days in 30 yrs
- 6 days/yr
Risk factors via First Street. Map © Google.
Why this score? — see what drove the C+ grade
The composite is a weighted blend of 9 inputs, each scored 0–100. Each bar is that input's sub-score; the figure is the points it added to the 100-point composite (weight × sub-score).
- Cash flow +22.1/30.0
- ARV discount +15.0/15.0
- DSCR +7.1/10.0
- 1% rule +6.6/10.0
- Rent growth +5.0/5.0
- Livability +3.7/5.0
- Condition / age +2.5/5.0
- Schools +1.7/10.0
- Appreciation +0.0/10.0
$144,900
🖨 Deal sheet (PDF) 📄 Offer letter ✓ Due diligence
Listing remarks
Brick Row Home that needs work, but worth the sweat equity and investment. The After Renovation Value (ARV) is strong in this neighborhood of Lansdowne Park, and can also make a great rental property for the investor's portfolio. If you plan on renovating and living here, it's a great opportunity as your first starter home in a nice stable neighborhood and convenient location. The home is being sold in as-is condition, and the Buyer is responsible for the Conditional U & O with Darby Borough.
Key facts
- Parking
- Built 1950
- Listed 57 days
Property features AI
Finance
- Other: Not in a federal flood zone; Year built information estimated
Exterior
- Parking: Driveway parking (1 space)
- Utilities: Public water; Public sewer; Natural gas hot water; 100 amp electric service; Municipal trash service
- Home design: Interior townhouse/rowhouse; Fee simple ownership; Major rehab needed
- Construction: Brick construction; Stone foundation; Flat roof; Vinyl-clad windows; Building winterized
- Exterior features: Patio(s); Lot approximately 16 x 78 (estimated)
Interior
- Kitchen: Gas range/oven; Refrigerator
- Bedrooms: Three bedrooms on the main upper level
- Flooring: Hardwood; Carpet
- Bathrooms: One full bathroom
- Heating & cooling: Forced air heating (oil-fired); Window air conditioning units
- Interior features: Plaster walls; Unfinished basement (basement present); 6 total rooms (including living room, dining room, kitchen)
- Laundry & utility: Washer and dryer; Laundry located in basement
Neighborhood map
What this means for you Summary
Snapshot
- This is a 3-bed/1.0-bath townhouse listed at $145k.
Deal economics
- At list price, monthly cash flow is $232 ($3k/yr) — positive.
- The deal already cash-flows at list — no discount required.
- Meets the 1% rule at list price ($2k rent vs $145k).
- Recommended offer: $141k (3.0% below list) — sets the bar for market timing.
- Cap rate 8.2% vs local median 6.3% in Darby — top-decile yield for the area; either an underpriced asset or a hidden risk that comps aren't pricing in. Stress-test before assuming the spread holds.
Location & tenants
- Location reads 74/100 on livability (#485 in PA, #4,468 nationally) — a middle-class / working-renter tenant base. Strengths: commute A+, cost of living A+, housing A+; Watch: amenities D+, employment D, crime F.
- William Penn SD (suburban): math 11% / reading 28% proficiency, ranked #491 of 539 in PA (top 91%) — low school quality limits family demand, transient renter base, plan for 1-2y turnover; 69% free/reduced lunch — lower-income household profile, screen leases tightly.
- Zoned schools: Penn Wood Hs (math 25% / reading 15%, grade F, #387 of 437 statewide, top 89%, 1,170 students, 95% FRL) — zoned schools average 95% FRL vs 69% district-wide (26 pts higher); higher-poverty schools than district average — tighter screening recommended.
- Market conditions: Rents rising fast (+13.1%/yr); 98 active listings in the ZIP; 38 comparable units currently listed for rent nearby; rentals at typical pace (median 23d on market — plan ~3-4 weeks tenant-placement turnaround); 299 units permitted in Delaware County in 2024 (5 in 5+ unit buildings).
- This rent runs 43% of the median local income ($46k/yr) — at the standard rent-burdened threshold; future hikes will face affordability resistance.
Forward outlook
- Local home prices are declining (-3.0%/yr); year-one equity from $1k of loan paydown is wiped out by about $4k of value loss. Plan a longer hold.
- At projected returns (-3.0% appreciation + 8.0% rent growth), your $41k cash investment doubles in ~9 years — after that, you're playing with house money.
Negotiation context
- It's been on market 58 days — a 3% lower offer ($141k) is reasonable based on typical stale-listing flexibility.
Risks & watch-outs
- Watch-outs: built in 1950 — expect roof / HVAC / electrical / plumbing capex.
- Climate carrying-cost: major wind risk, 27% chance of damaging wind over 30y; extreme-heat days projected 7→15/yr by 2055 (HVAC capex compounding) — expect insurance premiums to compound above CPI over the hold.
Questions for the listing agent
- It's been on market 58 days. Have you received any prior offers? Is the seller open to a 3% concession, seller financing, or rate buy-down credit?
- Built in 1950 — when were the roof, HVAC, electrical panel, plumbing, and water heater last replaced?
- Is there a deadline driving the sale (1031 exchange, divorce, estate, relocation)? That informs how much negotiation room exists.
- Schools are F-rated, which usually means shorter tenancies and higher turnover. Who's the typical renter profile here, and what's been the actual vacancy rate?
- Crime grade is F in this area — have there been break-ins, vandalism, or insurance claims at this property in the last 3 years? What carrier currently insures it and at what premium?
- What's the average days-on-market for RENTAL listings here right now (not sales)? A rising rental-DOM trend means longer vacancies and softer asking-rent achievability than the comps imply.
- What's the recent tenant-quality profile in this submarket — average credit score on applications, eviction rate, late-payment / NSF rate, and stable-employment percentage? A property-management company in the area should have these aggregated.
- How much new for-sale + rental construction is in the pipeline within 1–3 miles? Heavy new supply typically softens prices + rents 12–24 months out; constrained supply supports both.
Investment metrics
- 1% rule
- 1.16% ✓
- Cap rate
- 8.21%
- Cash-on-cash
- 6.86%
- DSCR
- 1.31
- GRM
- 7.2
CMA / ARV
- ARV (median comp)
- $197,343
- List price
- $144,900
- Delta
- -26.57%
- Verdict
- UNDERPRICED
- Comps
- 20 within 1.0 mi
Show comp detail 12 sales within ~0.75 mi
| Address | Dist | Beds/Ba | Sqft | Sold | Price | $/sf | Match |
|---|---|---|---|---|---|---|---|
| 1339 Park Ln | 0.06mi | 3/1.0 | 1,120 (0%) | 2mo | $230,000 | $205 | 96 |
| 1232 Edgehill Rd | 0.09mi | 3/1.0 | 1,120 (0%) | 1mo | $214,000 | $191 | 95 |
| 234 Spring Valley Rd | 0.12mi | 3/1.0 | 1,120 (0%) | 0mo | $130,000 | $116 | 94 |
| 123 Spring Valley Rd | 0.17mi | 3/1.0 | 1,120 (0%) | 1mo | $180,000 | $161 | 91 |
| 33 Mermont Cir | 0.24mi | 3/1.0 | 1,120 (0%) | 0mo | $200,000 | $179 | 88 |
| 1300 Wycombe Ave | 0.03mi | 3/1.0 | 1,190 (+6%) | 1mo | $129,000 | $108 | 88 |
| 902 Maple Ter | 0.39mi | 3/1.0 | 1,234 (+10%) | 0mo | $114,000 | $92 | 65 |
| 217 N 7th St | 0.52mi | 3/2.0 | 1,188 (+6%) | 1mo | $140,000 | $118 | 61 |
| 4 S 6th St | 0.69mi | 3/1.5 | 1,210 (+8%) | 2mo | $209,000 | $173 | 51 |
| 231 Hamilton Ave | 0.74mi | 3/1.0 | 1,260 (+12%) | 2mo | $106,000 | $84 | 43 |
| 524 Orchard Ave | 0.73mi | 3/2.5 | 1,288 (+15%) | 0mo | $275,000 | $214 | 35 |
| 530 Orchard Ave | 0.72mi | 4/1.5 (+1) | 1,288 (+15%) | 1mo | $290,000 | $225 | 34 |
Match score weights: distance 35% · size 25% · config 20% · recency 20%. Top-matched comps best support the ARV.
Projected returns pro-forma
-3.0% appreciation · 8.0% rent growth · sell at horizon
- IRR
- 0.1%
- Equity multiple
- 1.01×
- Total profit
- $242
- Equity at exit
- $21,605
- IRR
- 14.6%
- Equity multiple
- 2.48×
- Total profit
- $59,898
- Equity at exit
- $12,528
Cash invested: $40,572 (down + closing). Projections, not guarantees.
Landlord ↔ Tenant lean methodology
- Overall (STATE)
- 62 Landlord-Friendly
- State Pennsylvania
- 62 Landlord-Friendly · EVEN
- County
- — inherits STATE
- City
- — inherits STATE
ZIP-level market 19023
- Rents YoY
- 13.1%
- Active inventory
- 98
- Price-to-rent
- 7.2×
Monthly cashflow live
- Estimated rent
- $1,676 high interval (Pro) →
- Mortgage (P&I)
- −$760
- Tax from tax record
- −$272 /mo · $3,265/yr
- Insurance
- −$60
- HOA
- −$0
- Vacancy / Maint / Mgmt
- −$352
- Net cashflow
- $232
Break-even live
Sensitivity live
| Price | -10% $314 | -5% $273 | +0% $232 | +5% $191 | +10% $150 |
|---|---|---|---|---|---|
| Rent | -10% $100 | -5% $166 | +0% $232 | +5% $298 | +10% $365 |
| Rate | -1.0pp $305 | -0.5pp $269 | base $232 | +0.5pp $195 | +1.0pp $156 |
UW: 25.0% down · 7.5% · 30yr · 1.5% tax · 5.0% vac · 8.0% maint · 8.0% mgmt
Financing live
Cash to close
- Down payment
- $36,225
- Closing costs
- $4,347
- Reserves months
- —
- Total cash needed
- —
Loan-product check · same deal, 3 products live
Conventional
25% down · 7.5% · 30yr
- Down + closing
- —
- Monthly P&I
- —
- Monthly cashflow
- —
- DSCR
- —
- Eligible?
- —
Personal DTI + credit; lowest rate.
DSCR
20% down · 8.5% · 30yr
- Down + closing
- —
- Monthly P&I
- —
- Monthly cashflow
- —
- DSCR
- —
- Eligible?
- —
No personal income docs; deal must DSCR.
Hard money
10% down · 12.0% · 12mo
- Down + closing
- —
- Monthly P&I
- —
- Monthly cashflow
- —
- DSCR
- —
- Eligible?
- —
Short-term bridge; refi at stabilization.
Rent comps 38 comps
| Address | Beds | Baths | Sqft | Rent | $/sqft | DOM | Units | Dist |
|---|---|---|---|---|---|---|---|---|
| 37 Concord Rd Darby, PA | 3.0 | 1.0 | 1120 | $1,795 | $1.60 | 44d | 1 | 0.25mi |
| 1300 Main St Unit Basement Darby, PA | 2.0 | 1.0 | 1000 | $1,450 | $1.45 | 25d | 1 | 0.34mi |
| 1300 Main St Unit Basement Darby, PA | 2.0 | 1.0 | 800 | $1,450 | $1.81 | 12d | 1 | 0.34mi |
| 935 Maple Ter Darby, PA | 3.0 | 1.0 | 1266 | $1,585 | $1.25 | 6d | 1 | 0.37mi |
| 935 Maple Ter Darby, PA | 3.0 | 1.0 | 1266 | $1,585 | $1.25 | 12d | 1 | 0.37mi |
| 924 Maple Ter Darby, PA | 3.0 | 1.5 | 1190 | $2,000 | $1.68 | 6d | 1 | 0.39mi |
| 504 S Lansdowne Ave Lansdowne, PA | 2.0 | 1.0 | 815 | $1,545 | $1.90 | 0d | 4 | 0.48mi |
| 909 Springfield Rd Unit D Darby, PA | 4.0 | 1.0 | 900 | $1,600 | $1.78 | 44d | 1 | 0.60mi |
| 146 S Lansdowne Ave Apt A9 Lansdowne, PA | 2.0 | 1.0 | 950 | $1,469 | $1.55 | 0d | 1 | 0.63mi |
| 810 Rundale Ave Lansdowne, PA | 2.0 | 1.0 | 868 | $1,500 | $1.73 | 25d | 1 | 0.63mi |
| 2 Winthrop Rd Darby, PA | 3.0 | 1.5 | 1224 | $1,900 | $1.55 | 23d | 1 | 0.64mi |
| 106 N 6th St Darby, PA | 2.0 | 1.0 | 1200 | $1,550 | $1.29 | 44d | 1 | 0.64mi |
| 619 Baily Rd Lansdowne, PA | 3.0 | 1.0 | 1288 | $1,850 | $1.44 | 19d | 1 | 0.69mi |
| 69 S 7th St Darby, PA | 3.0 | 2.0 | 1446 | $1,700 | $1.18 | 44d | 1 | 0.70mi |
| 608 Yeadon Ave Unit 2nd Floor Yeadon, PA | 2.0 | 1.0 | 1000 | $1,400 | $1.40 | 13d | 1 | 0.72mi |
| 608 Yeadon Ave Unit 1st Floor Yeadon, PA | 2.0 | 1.0 | 1000 | $1,400 | $1.40 | 19d | 1 | 0.72mi |
| 209 Hamilton Ave Darby, PA | 4.0 | 1.0 | 1400 | $1,595 | $1.14 | 16d | 1 | 0.73mi |
| 826 Guenther Ave Lansdowne, PA | 2.0 | 1.0–2.0 | 800 | $1,699 | $2.12 | 25d | 1 | 0.82mi |
| 35 Elberon Ave Unit 2 Lansdowne, PA | 2.0 | 1.0 | 900 | $1,695 | $1.88 | 25d | 1 | 0.84mi |
| 300 N Front St Darby, PA | 2.0 | 1.0 | 850 | $1,395 | $1.64 | 44d | 1 | 0.89mi |
| 700 Pine St Unit 2F Darby, PA | 2.0 | 1.0 | 1100 | $1,250 | $1.14 | 19d | 1 | 0.94mi |
| 101 W Baltimore Ave Unit B04 Lansdowne, PA | 2.0 | 1.0 | 925 | $1,469 | $1.59 | 25d | 1 | 1.08mi |
| 101 W Baltimore Ave Unit H4 Lansdowne, PA | 2.0 | 1.0 | 925 | $1,449 | $1.57 | 23d | 1 | 1.08mi |
| 124 Lexington Ave Unit 2 Lansdowne, PA | 2.0 | 1.0 | 1000 | $1,500 | $1.50 | 4d | 1 | 1.16mi |
| 601 Poplar St Sharon Hill, PA | 1.0–2.0 | 1.0 | 787 | $1,599 | $2.03 | 16d | 5 | 1.17mi |
| 412 S 2nd St Darby, PA | 3.0 | 1.0 | 1190 | $1,100 | $0.92 | 6d | 1 | 1.17mi |
| 417 S 2nd St Darby, PA | 3.0 | 1.0 | 1190 | $1,020 | $0.86 | 6d | 1 | 1.20mi |
| 118 Felton Ave Darby, PA | 3.0 | 1.0 | 1152 | $1,750 | $1.52 | 23d | 1 | 1.21mi |
| 112 Juliana Ter Darby, PA | 3.0 | 1.0 | 1020 | $2,450 | $2.40 | 25d | 1 | 1.25mi |
| 112 Juliana Ter Darby, PA | 3.0 | 1.0 | 1020 | $2,350 | $2.30 | 45d | 1 | 1.25mi |
| 534 S 4th St Darby, PA | 3.0 | 1.0 | 1500 | $1,695 | $1.13 | 0d | 1 | 1.27mi |
| 7147 Radbourne Rd Upper Darby, PA | 3.0 | 1.0 | 1096 | $1,850 | $1.69 | 13d | 1 | 1.29mi |
| 137 W Maryland Ave Unit 2nd Flr Aldan, PA | 2.0 | 1.0 | 800 | $1,400 | $1.75 | 6d | 1 | 1.30mi |
| 7116 Seaford Rd Upper Darby, PA | 2.0 | 1.0 | 996 | $1,600 | $1.61 | 44d | 1 | 1.34mi |
| 7139 Greenwood Ave Upper Darby, PA | 3.0 | 1.0 | 1064 | $1,600 | $1.50 | 25d | 1 | 1.42mi |
| 7111 Greenwood Ave Upper Darby, PA | 3.0 | 1.5 | 1064 | $1,800 | $1.69 | 44d | 1 | 1.43mi |
| 702 Copley Rd Upper Darby, PA | 3.0 | 1.0 | 1044 | $1,750 | $1.68 | 25d | 1 | 1.45mi |
| 7216 Clinton Rd Upper Darby, PA | 3.0 | 1.0 | 1170 | $1,815 | $1.55 | 3d | 1 | 1.49mi |
Listing history 16 events
-
2026-06-21days on market $144,900 Active 58 DOM
-
2026-06-18days on market $144,900 Active 55 DOM
-
2026-06-17days on market $144,900 Active 54 DOM
-
2026-06-16days on market $144,900 Active 53 DOM
-
2026-06-15days on market $144,900 Active 52 DOM
-
2026-06-13days on market $144,900 Active 50 DOM
-
2026-06-13days on market $144,900 Active 49 DOM
-
2026-06-09days on market $144,900 Active 46 DOM
-
2026-06-08days on market $144,900 Active 45 DOM
-
2026-06-07days on market $144,900 Active 44 DOM
-
2026-06-04days on market $144,900 Active 41 DOM
-
2026-06-03days on market $144,900 Active 40 DOM
-
2026-06-02days on market $144,900 Active 39 DOM
-
2026-06-01days on market $144,900 Active 38 DOM
-
2026-05-31days on market $144,900 Active 37 DOM
-
2026-04-24$152,000 Active 502-char remark
ⓘ Source: listings_history table (triggers on properties + properties_extension) + one-shot
backfill from property_details.listing_events for pre-trigger history.
Tax reassessment forecast PA · Partial reset (capped growth)
- Current annual tax
- $3,265 · $272/mo
- Projected year-2 tax
- $3,265 · $272/mo
- Expected delta
- $0/yr ($0/mo · 0.0%)
ⓘ Screening estimate from a state-policy table — verify with the county assessor before closing.
Climate risk First Street
- Flood 1/10 Low FEMA zone X (unshaded) · 0% chance over 30 yrs
- Wildfire 1/10 Low
- Heat 6/10 Major 7 d/yr ≥103°F today · 15 d/yr by 30 yrs out
- Wind 6/10 Major 27% chance of damaging wind over 30 yrs
- Air quality 4/10 Moderate 3 unhealthy d/yr today · 6 by 30 yrs out
Nearby sold comps map
Loading sold comps map…
Walkable amenities ~0.75 mi
Loading nearby amenities…
Taxation est. · year 1
- Rental income
- $20,117
- − Mortgage interest
- −$8,117
- − Property taxes
- −$3,265
- − Insurance
- −$724
- − Repairs & maintenance
- −$1,609
- − Management
- −$1,609
- − Depreciation
- −$4,215
- Taxable income
- $577
- Est. tax owed @ 24.0%
- −$139
- After-tax cash flow
- $2,646/yr
For passive investors: Depreciation is non-cash, so a rental often shows a tax loss while cash-flowing — sheltering income. Rental losses are passive: they offset passive income freely, and up to $25,000/yr can offset ordinary (W-2) income if you actively participate and your MAGI is under $100k (phasing out to $0 by $150k); unused losses carry forward. On sale, claimed depreciation is recaptured at up to 25%, and gains may owe capital-gains tax (a 1031 exchange can defer both). Figures are a year-1 estimate at your 24.0% rate — not tax advice; consult a CPA.
Schools (NCES district)
- District
- William Penn SD
- NCES district ID
- 4226390
- Math proficiency
- 11% ▼ -3.00%
- Reading proficiency
- 28% ▼ -7.00%
- Median HH income
- $48,543
- Composite
- 17.29/100
- National rank
- #9086
- State rank
- #491 of 539 in PA
Livability — Darby
- Score
- 74/100
- State rank
- #485
- US rank
- #4468
Category grades
Schools grade is shown separately in the Schools card above.
Census & demographics
- Census place
- Darby, PA
- County
- Delaware County · 399,863 people
- Metro
- Philadelphia-Camden-Wilmington, PA-NJ-DE-MD
- Population (ZIP)
- 22,247
- Household income
- $46,463
- Rent vs Own
- Severe rent burden
- 1468.0
Population outlook (Delaware County) Hauer SSP2
- Today (2025)
- 577,490 people
- By 2030
- 581,243 · +0.6%
- By 2040
- 584,700 · +1.2%
- By 2050
- 586,581 · +1.6%
- By 2075
- 598,706 · +3.7%
- By 2100
- 590,823 · +2.3%
Race, ethnicity, and origin ACS 2023
- Neighborhood character
- Predominantly Black (76%)
- Race & ethnicity
- Black 76% White 15% Two or more races 5% Hispanic / Latino 3% Asian 2%
- Common ancestry
- Swiss 5% Hispanic 1% Romanian 1%
- Foreign-born
- 18% · Canada
- Languages at home
- 84% English-only · French/Haitian/Cajun 4% Spanish 3% Other Asian/Pacific 1%
Political lean MEDSL · Delaware
- 2024 margin
- Strong D (+23.7) · D 61.4% · R 37.6% · Other 1.0%
- 2008→2024 swing
- +2.3pp toward D · 2008: 21.4pp · 2024: 23.7pp
- All cycles
- 2024: D+23.7 2020: D+26.7 2016: D+22.0 2012: D+21.8 2008: D+21.4
Not yet ingested
- Civics
- —
Market trends
- HPI YoY
- ▼ -190.50%
- Current HPI
- 277.7034
- Rent YoY
- ▲ 13.10%
- Metro
- Philadelphia-Camden-Wilmington, PA-NJ-DE-MD
- State GDP YoY
- ▲ 1.68%
- F500 in state
- 34
Industry mix (Fortune 500 HQ in PA)
| Industry | F500 HQs | Revenue |
|---|---|---|
| Healthcare | 2 | $309B |
|
||
| Insurance | 2 | $27B |
|
||
| Telecommunications / Media | 1 | $124B |
|
||
| Industrial Distribution | 1 | $22B |
|
||
| Financial Services | 1 | $20B |
|
||
| Chemicals / Materials | 1 | $18B |
|
||
Price history
-4.7% since first listed2 events — show timeline
- 2026-05-28 Price Changed $144,900 BRIGHT MLS
- 2026-04-24 Listed $152,000 BRIGHT MLS
Property tax history
+0.8%/yrLatest (2026): $3,265 · -0.5% YoY. Source: county tax records.
Cash-flow waterfall
monthlySold comps — $/sqft
last 12 mo · ≤1 miLoading sold comps…