 Duplex
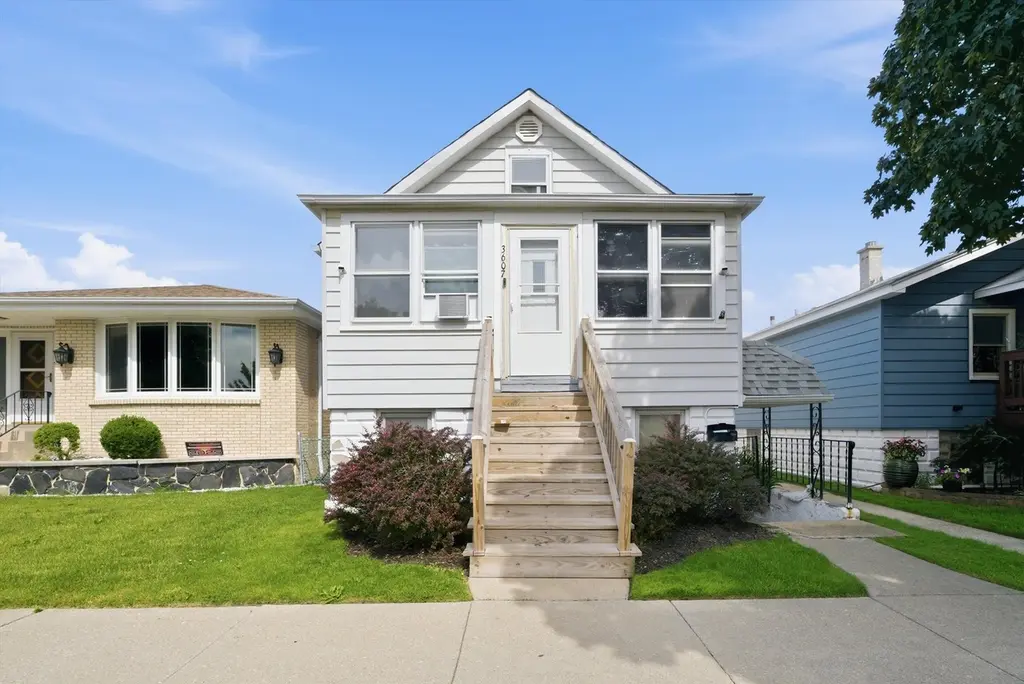
3607 S 55th Ct · Cicero, IL
Flood risk 1/10 · Minimal
- FEMA flood zone
- X (unshaded)
- Chance of flooding over 30 yrs
- 0.0%
- Est. flood insurance / yr
- $507 – $1,088
Fire risk 1/10 · Minimal
- Est. fire insurance / yr
- $804 – $1,492
Heat risk 3/10 · Minor
- Hot days now (above 99°F)
- 7 days/yr
- Hot days in 30 yrs
- 15 days/yr
Wind risk 2/10 · Minimal
- Chance of severe wind over 30 yrs
- 1.0%
Air-quality risk 4/10 · Minor
- Unhealthy air days now
- 3 days/yr
- Unhealthy air days in 30 yrs
- 5 days/yr
Risk factors via First Street. Map © Google.
Why this score? — see what drove the C+ grade
The composite is a weighted blend of 9 inputs, each scored 0–100. Each bar is that input's sub-score; the figure is the points it added to the 100-point composite (weight × sub-score).
- Cash flow +28.8/30.0
- DSCR +10.0/10.0
- 1% rule +8.0/10.0
- ARV discount +7.5/15.0
- Livability +4.1/5.0
- Rent growth +3.1/5.0
- Condition / age +2.2/5.0
- Schools +1.1/10.0
- Appreciation +0.0/10.0
$224,900
🖨 Deal sheet 📄 Offer letter ✓ Due diligence
Multi-family units
County records classify this as Multi-Family (2-4 Unit). Listing-text estimate: 2 units. confirmed
Listing remarks
ESTATE SALE! WELCOME TO CICERO'S PRIME LOCATION! LEGAL 2 UNITS WITH COACH HOUSE (CITY REQUIRED DEMO) ON A 30' LOT. FRONT BUILDING HAS 2 UNITS WITH AN UNFINISHED WALK-UP ATTIC FOR DUPLEX CAPABILITY WITH THE 2ND UNIT. TENANTS PAY THEIR OWN UTILITIES. LOCATED WITHIN WALKING DISTANCE TO MORTON COLLEGE, DREXEL PARK, AND THE STEVENSON EXPRESSWAY. PRICED TO SELL QUICKLY. CONVENTIONAL OR CASH ONLY DUE TO COACH HOUSE DEMO REQUEST. PROPERTY WILL SELL AS-IS CONDITION AND WITH TENANTS. PLEASE CALL LISTING OFFICE FOR MORE INFORMATION.
Key facts
- Legal 2 units
- Coach house
- 3,780 sq ft lot
Tags
Property features AI
Finance
- Other: Possession negotiable
- Financial info: Two units in building; Current rent listed as $800 for each unit (month-to-month leases); No special service area
Exterior
- Utilities: Water from Lake Michigan; Public sewer
- Home design: Two- to four-unit property (two units); Fee simple ownership; Built prior to 1978; age approximately 71–80 years
- Construction: Aluminum siding and brick exterior
- Exterior features: Lot dimensions approximately 30 x 126; Lot smaller than 0.25 acre; Zoned for multi-family
Interior
- Kitchen: No appliances listed for either unit
- Bedrooms: Four bedrooms total; each unit has 2 bedrooms
- Bathrooms: Two full bathrooms total; each unit has 1 full bath
- Heating & cooling: Natural gas heating
- Interior features: 10 total rooms; Two 5-room units (one per floor)
- Laundry & utility: Tenant pays electric and gas for each unit
Neighborhood map
What this means for you Summary
Snapshot
- This is a 2 × 2-bed/1.0-bath units multifamily listed at $225k. Condition is rated fair.
Deal economics
- At list price, monthly cash flow is $756 ($9k/yr) — positive. Per door: $378/mo.
- The deal already cash-flows at list — no discount required.
- Meets the 1% rule at list price ($3k rent vs $225k).
- Recommended offer: $222k (1.5% below list) — sets the bar for market timing.
- Cap rate 10.3% vs local median 4.6% in Cicero — top-decile yield for the area; either an underpriced asset or a hidden risk that comps aren't pricing in. Stress-test before assuming the spread holds.
Location & tenants
- Location reads 82/100 on livability (#77 in IL, #1,276 nationally) — a professional / high-income tenant draw. Strengths: commute A+, cost of living A+, housing A+; Watch: schools F.
- J S Morton Hsd 201 (suburban): math 9% / reading 14% proficiency, ranked #557 of 620 in IL (top 90%) — low school quality limits family demand, transient renter base, plan for 1-2y turnover.
- Market conditions: Rents rising (+2.4%/yr); 103 active listings in the ZIP; 6 comparable units currently listed for rent nearby; rentals at typical pace (median 19d on market — plan ~3-4 weeks tenant-placement turnaround); 6,272 units permitted in Cook County in 2024 (4,658 in 5+ unit buildings).
- At $2,924/mo this rent would consume 50% of the median local household income ($71k/yr) (locally 2178% of renters already pay >50% of income on rent) — very limited rent-growth headroom before tenants either downsize or default.
Forward outlook
- Local home prices are declining (-3.0%/yr); year-one equity from $2k of loan paydown is wiped out by about $7k of value loss. Plan a longer hold.
- At projected returns (-3.0% appreciation + 2.4% rent growth), your $63k cash investment doubles in ~9 years — after that, you're playing with house money.
Negotiation context
- It's been on market 15 days — a 2% lower offer ($222k) is reasonable based on typical stale-listing flexibility.
Risks & watch-outs
- Watch-outs: built in 1951 — expect roof / HVAC / electrical / plumbing capex.
Questions for the listing agent
- Can we see the unit-by-unit rent roll, current vacancy, and any below-market leases? What's the average tenancy length?
- What capital expenditures (roof, boiler, parking lot, exteriors) have been made in the last 5 years, and what's planned in the next 2?
- Have any recent inspections been done? Can we get a copy of the seller's disclosures and any deferred-maintenance estimates?
- Built in 1951 — when were the roof, HVAC, electrical panel, plumbing, and water heater last replaced?
- Is there a deadline driving the sale (1031 exchange, divorce, estate, relocation)? That informs how much negotiation room exists.
- Schools are F-rated, which usually means shorter tenancies and higher turnover. Who's the typical renter profile here, and what's been the actual vacancy rate?
- What's the average days-on-market for RENTAL listings here right now (not sales)? A rising rental-DOM trend means longer vacancies and softer asking-rent achievability than the comps imply.
- What's the recent tenant-quality profile in this submarket — average credit score on applications, eviction rate, late-payment / NSF rate, and stable-employment percentage? A property-management company in the area should have these aggregated.
- How much new apartment / multifamily construction is in the pipeline within 1–3 miles? Heavy new supply (>2% of stock underway) typically softens rents 12–24 months out; light construction supports rent growth.
Investment metrics
- 1% rule
- 1.30% ✓
- Cap rate
- 10.33%
- Cash-on-cash
- 14.40%
- DSCR
- 1.64
- GRM
- 6.4
CMA / ARV
No comps found within radius.
Show comp detail 12 sales within ~0.75 mi
| Address | Dist | Beds/Ba | Sqft | Sold | Price | $/sf | Match |
|---|---|---|---|---|---|---|---|
| 3419 S 54 Ave | 0.29mi | 5/2.0 (+1) | — | 4mo | $445,000 | — | 66 |
| 3820 S 57th Ave | 0.35mi | 5/2.0 (+1) | — | 8mo | $340,000 | — | 59 |
| 3241 S 53rd Ct | 0.50mi | 5/2.0 (+1) | — | 9mo | $340,000 | — | 52 |
| 5113 W 32nd St | 0.70mi | 4/3.0 | — | 0mo | $295,000 | — | 50 |
| 3135-37 S 53rd Ave | 0.65mi | 5/3.0 (+1) | — | 0mo | $560,000 | — | 48 |
| 3415 S 57th Ct | 0.34mi | 5/3.0 (+1) | — | 19mo | $395,000 | — | 46 |
| 5101 W 32nd Pl | 0.68mi | 3/2.0 (-1) | — | 6mo | $329,900 | — | 46 |
| 3144 S 54th Ave | 0.57mi | 5/3.0 (+1) | — | 9mo | $395,000 | — | 45 |
| 3135 S 54th Ave | 0.60mi | 5/2.0 (+1) | — | 13mo | $385,000 | — | 44 |
| 5238 W 31st St | 0.74mi | 4/2.0 | — | 11mo | $330,000 | — | 43 |
| 3738 S 59th Ave | 0.51mi | 5/2.0 (+1) | — | 19mo | $385,000 | — | 43 |
| 3143 S 53rd Ave | 0.63mi | 5/2.0 (+1) | — | 14mo | $499,900 | — | 41 |
Match score weights: distance 35% · size 25% · config 20% · recency 20%. Top-matched comps best support the ARV.
Projected returns pro-forma
-3.0% appreciation · 2.43% rent growth · sell at horizon
- IRR
- 4.2%
- Equity multiple
- 1.16×
- Total profit
- $10,066
- Equity at exit
- $33,533
- IRR
- 13.1%
- Equity multiple
- 2.02×
- Total profit
- $64,158
- Equity at exit
- $19,445
Cash invested: $62,972 (down + closing). Projections, not guarantees.
Landlord ↔ Tenant lean methodology
- Overall (STATE)
- 43 Moderately Tenant-Leaning
- State Illinois
- 43 Moderately Tenant-Leaning · D+7
- County
- — inherits STATE
- City
- — inherits STATE
ZIP-level market 60804
- Rents YoY
- 2.4%
- Active inventory
- 103
- Price-to-rent
- 12.8×
Monthly cashflow live
- Estimated rent
- $2,924 high interval (Pro) →
- Mortgage (P&I)
- −$1,179
- Tax est. 1.5%
- −$281 /mo · $3,374/yr
- Insurance
- −$94
- HOA
- −$0
- Vacancy / Maint / Mgmt
- −$614
- Net cashflow
- $756
Break-even live
2-unit breakdown (identical units grouped — click to expand)
| Units | Beds | Baths | Est. rent |
|---|---|---|---|
| 2× units | 2 | 1 | $2,924 |
| #1 | 2 | 1 | $1,462 |
| #2 | 2 | 1 | $1,462 |
| Total (2 units) | $2,924 | ||
UW: 25.0% down · 7.5% · 30yr · 1.5% tax · 5.0% vac · 8.0% maint · 8.0% mgmt
Financing live
Cash to close
- Down payment
- $56,225
- Closing costs
- $6,747
- Reserves months
- —
- Total cash needed
- —
Loan-product check · same deal, 3 products live
Conventional
25% down · 7.5% · 30yr
- Down + closing
- —
- Monthly P&I
- —
- Monthly cashflow
- —
- DSCR
- —
- Eligible?
- —
Personal DTI + credit; lowest rate.
DSCR
20% down · 8.5% · 30yr
- Down + closing
- —
- Monthly P&I
- —
- Monthly cashflow
- —
- DSCR
- —
- Eligible?
- —
No personal income docs; deal must DSCR.
Hard money
10% down · 12.0% · 12mo
- Down + closing
- —
- Monthly P&I
- —
- Monthly cashflow
- —
- DSCR
- —
- Eligible?
- —
Short-term bridge; refi at stabilization.
Rent comps 6 comps
| Address | Beds | Baths | Sqft | Rent | $/sqft | DOM | Units | Dist |
|---|---|---|---|---|---|---|---|---|
| 3633 S 57th Ct Cicero, IL | 3.0 | 2.5 | 1708 | $2,500 | $1.46 | 21d | 1 | 0.25mi |
| 3222 S 52nd Ct Cicero, IL | 3.0 | 2.0 | 1627 | $5,850 | $3.60 | 1d | 1 | 0.59mi |
| 3020 S Laramie Ave Unit 2F Cicero, IL | 3.0 | 1.0 | 1000 | $1,800 | $1.80 | 3d | 1 | 0.83mi |
| 3236 S 49th Ave Unit 2 Cicero, IL | 3.0 | 1.0 | — | $2,750 | — | 24d | 1 | 0.88mi |
| 3720 Ridgeland Ave #2 Berwyn, IL | 3.0 | 1.0 | 1200 | $2,250 | $1.88 | 19d | 1 | 1.10mi |
| 4916 W 29th St Unit 2 Cicero, IL | 3.0 | 1.0 | 900 | $1,750 | $1.94 | 14d | 1 | 1.17mi |
Listing history 10 events
-
2026-06-18days on market $224,900 Active 15 DOM
-
2026-06-17days on market $224,900 Active 14 DOM
-
2026-06-16days on market $224,900 Active 13 DOM
-
2026-06-15days on market $224,900 Active 12 DOM
-
2026-06-13days on market $224,900 Active 10 DOM
-
2026-06-09days on market $224,900 Active 6 DOM
-
2026-06-08days on market $224,900 Active 5 DOM
-
2026-06-07days on market $224,900 Active 4 DOM
-
2026-06-04remarks 528-char remark
-
2026-06-04$224,900 Active 1 DOM
ⓘ Source: listings_history table (triggers on properties + properties_extension) + one-shot
backfill from property_details.listing_events for pre-trigger history.
Climate risk First Street
- Flood 1/10 Low FEMA zone X (unshaded) · 0% chance over 30 yrs
- Wildfire 1/10 Low
- Heat 3/10 Moderate 7 d/yr ≥99°F today · 15 d/yr by 30 yrs out
- Wind 2/10 Low 100% chance of damaging wind over 30 yrs
- Air quality 4/10 Moderate 3 unhealthy d/yr today · 5 by 30 yrs out
Nearby sold comps map
Loading sold comps map…
Walkable amenities ~0.75 mi
Loading nearby amenities…
Taxation est. · year 1
- Rental income
- $35,088
- − Mortgage interest
- −$12,598
- − Property taxes
- −$3,374
- − Insurance
- −$1,124
- − Repairs & maintenance
- −$2,807
- − Management
- −$2,807
- − Depreciation
- −$6,543
- Taxable income
- $5,835
- Est. tax owed @ 24.0%
- −$1,401
- After-tax cash flow
- $7,668/yr
For passive investors: Depreciation is non-cash, so a rental often shows a tax loss while cash-flowing — sheltering income. Rental losses are passive: they offset passive income freely, and up to $25,000/yr can offset ordinary (W-2) income if you actively participate and your MAGI is under $100k (phasing out to $0 by $150k); unused losses carry forward. On sale, claimed depreciation is recaptured at up to 25%, and gains may owe capital-gains tax (a 1031 exchange can defer both). Figures are a year-1 estimate at your 24.0% rate — not tax advice; consult a CPA.
Condition & rehab AI · 13 photos
The home is in fair condition with moderate repairs needed, particularly in the kitchen and bathroom. Upgrading these areas will significantly increase its resale and rental value.
Repairs flagged
- Minor Kitchen clutter — Cleaning and organizing the kitchen will improve its appearance and functionality.
- Moderate Bathroom fixtures — Updating the bathroom fixtures will improve the overall look and functionality of the space.
Value-add opportunities
- Resale Clean and organize the kitchen — A clean and organized kitchen will make the home more appealing to potential buyers.
- Resale Update bathroom fixtures — Upgrading the bathroom fixtures will enhance the home's appeal and functionality.
- Rental Inspect and maintain HVAC and mechanical systems — Maintaining the HVAC and mechanical systems will ensure the home is energy-efficient and comfortable for tenants.
Renovation cost estimate screening
| Repair item | Severity | Est. cost |
|---|---|---|
| Kitchen clutter · Cleaning and organizing the kitchen will improve its appearance and functionality. | Minor | $500–3,000 |
| Bathroom fixtures · Updating the bathroom fixtures will improve the overall look and functionality of the space. | Moderate | $3,000–15,000 |
| Total estimated repair cost · 2 items | $3,500–18,000 |
Value-add ROI direction
- Resale Clean and organize the kitchen — A clean and organized kitchen will make the home more appealing to potential buyers. ↑
- Resale Update bathroom fixtures — Upgrading the bathroom fixtures will enhance the home's appeal and functionality. ↑
- Rental Inspect and maintain HVAC and mechanical systems — Maintaining the HVAC and mechanical systems will ensure the home is energy-efficient and comfortable for tenants. ↑
ⓘ Cost ranges are severity-bucket heuristics (US national rule-of-thumb). Get contractor quotes + a written scope before underwriting a rehab budget.
Schools (NCES district)
- District
- J S Morton Hsd 201
- NCES district ID
- 1726880
- Math proficiency
- 9% ▲ 1.00%
- Reading proficiency
- 14% ▼ -1.00%
- Median HH income
- $48,698
- Composite
- 10.73/100
- National rank
- #9768
- State rank
- #557 of 620 in IL
Livability — Cicero
- Score
- 82/100
- State rank
- #77
- US rank
- #1276
Category grades
Schools grade is shown separately in the Schools card above.
Census & demographics
- Census place
- Cicero, IL
- County
- Cook County · 4,486,803 people
- City population
- 82,797
- Metro
- Chicago-Naperville-Elgin, IL-IN-WI
- Population (ZIP)
- 82,797
- Household income
- $70,842
- Rent vs Own
- Severe rent burden
- 2178.0
Population outlook (Cook County) Hauer SSP2
- Today (2025)
- 5,347,519 people
- By 2030
- 5,357,703 · +0.2%
- By 2040
- 5,324,924 · -0.4%
- By 2050
- 5,230,762 · -2.2%
- By 2075
- 4,785,735 · -10.5%
- By 2100
- 4,188,836 · -21.7%
Race, ethnicity, and origin ACS 2023
- Neighborhood character
- Predominantly Hispanic (89%)
- Race & ethnicity
- Hispanic / Latino 89% Two or more races 17% White 7% Black 3% Native American 2%
- Hispanic origin (detail)
- Mexican 80% Puerto Rican 3%
- Common ancestry
- Romanian 2%
- Foreign-born
- 40% · Canada, Jamaica
- Languages at home
- 18% English-only · Spanish 80%
Political lean MEDSL · Cook
- 2024 margin
- Solid D (+42.0) · D 70.4% · R 28.4% · Other 1.2%
- 2008→2024 swing
- -11.4pp toward R · 2008: 53.4pp · 2024: 42.0pp
- All cycles
- 2024: D+42.0 2020: D+50.3 2016: D+53.0 2012: D+49.4 2008: D+53.4
Not yet ingested
- Civics
- —
Market trends
- HPI YoY
- ▼ -165.38%
- Current HPI
- 262.83
- Rent YoY
- ▲ 2.43%
- Metro
- Chicago-Naperville-Elgin, IL-IN-WI
- State GDP YoY
- ▲ 1.59%
- F500 in state
- 60
Industry mix (Fortune 500 HQ in IL)
| Industry | F500 HQs | Revenue |
|---|---|---|
| Insurance | 4 | $201B |
|
||
| Consumer Goods | 4 | $87B |
|
||
| Industrial Machinery | 3 | $64B |
|
||
| Healthcare | 2 | $55B |
|
||
| Retail / Pharmacy | 1 | $148B |
|
||
| Agriculture / Food | 1 | $86B |
|
||
Price history
1 event — show timeline
- 2026-06-03 Listed $224,900 MRED as Distributed by MLS Grid
Cash-flow waterfall
monthlySold comps — $/sqft
last 12 mo · ≤1 miLoading sold comps…