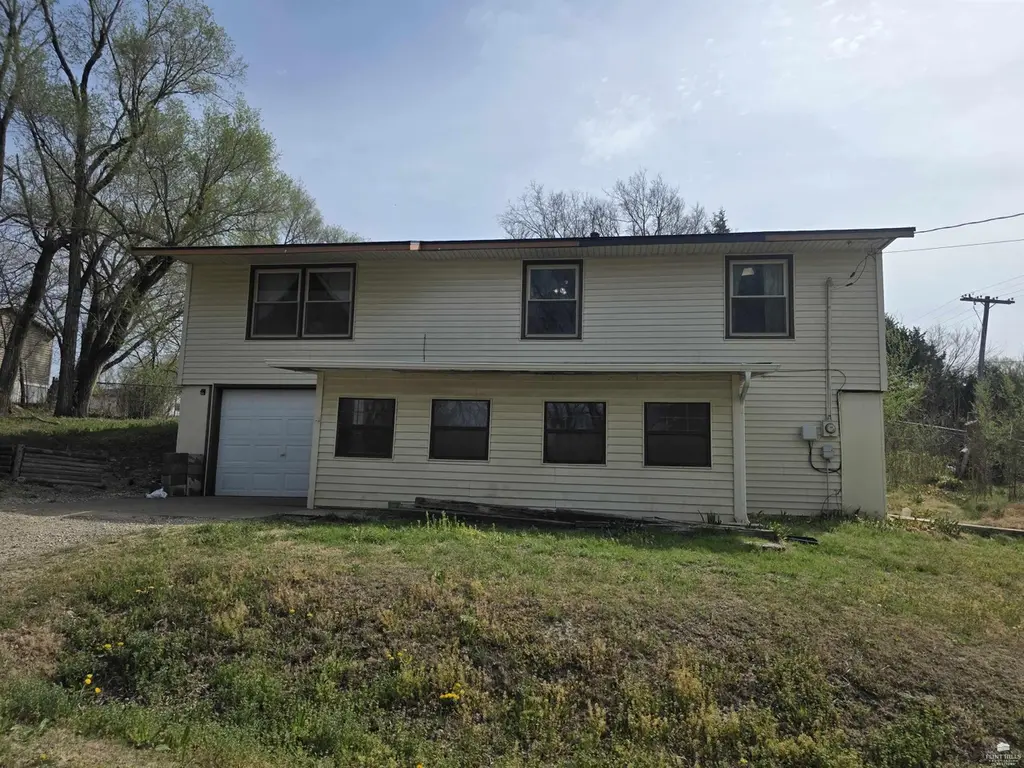
230 S Garfield St · Enterprise, KS
Flood risk 1/10 · Minimal
- FEMA flood zone
- —
- Chance of flooding over 30 yrs
- 0.0%
- Est. flood insurance / yr
- —
Fire risk 5/10 · Moderate
- Est. fire insurance / yr
- $1,154 – $2,142
Heat risk 5/10 · Moderate
- Hot days now (above 108°F)
- 7 days/yr
- Hot days in 30 yrs
- 17 days/yr
Wind risk 2/10 · Minimal
- Chance of severe wind over 30 yrs
- —
Air-quality risk 2/10 · Minimal
- Unhealthy air days now
- 1 days/yr
- Unhealthy air days in 30 yrs
- 1 days/yr
Risk factors via First Street. Map © Google.
Why this score? — see what drove the D+ grade
The composite is a weighted blend of 9 inputs, each scored 0–100. Each bar is that input's sub-score; the figure is the points it added to the 100-point composite (weight × sub-score).
- Cash flow +12.4/30.0
- ARV discount +7.5/15.0
- Appreciation +7.0/10.0
- DSCR +3.7/10.0
- Livability +3.4/5.0
- 1% rule +3.3/10.0
- Schools +2.9/10.0
- Rent growth +2.5/5.0
- Condition / age +2.5/5.0
$129,900
🖨 Deal sheet 📄 Offer letter ✓ Due diligence
Key facts
- Natural light
- Beautiful trees
- Corner lot
Tags
Neighborhood map
What this means for you Summary
Snapshot
- This is a 3-bed/1.5-bath single-family listed at $130k.
Deal economics
- At list price, monthly cash flow is $-22 ($-265/yr) — negative.
- To cash-flow at today's rent, offer at most $126k (3.0% below list).
- To meet the 1% rule (rent ≥ 1% of price), the offer needs to be $107k (17.3% below list).
- Recommended offer: $107k (17.3% below list) — sets the bar for 1% rule.
Location & tenants
- Location reads 67/100 on livability (#248 in KS) — a middle-class / working-renter tenant base. Strengths: cost of living A+, housing A+, health & safety A+; Watch: schools C-, employment D+, crime F.
- Chapman (rural): math 29% / reading 37% proficiency, ranked #73 of 169 in KS (top 43%) — families likely to look elsewhere, expect single-tenant / working-renter base with shorter leases.
- Market conditions: 6 active listings in the ZIP; 26 units permitted in Dickinson County in 2024 (0 in 5+ unit buildings).
Forward outlook
- In year one you build about $6k of equity ($898 loan paydown + $5k appreciation (4.1% local appreciation)).
- Dickinson County population projected at -12% by 2050 — secular population decline; favor cash flow + early exit over multi-decade hold.
- At projected returns (4.1% appreciation + 3.0% rent growth), your $36k cash investment doubles in ~6 years — after that, you're playing with house money.
- By year 6, paydown + projected appreciation supports a ~$33k cash-out refi (75% LTV) — recoverable capital for the next deal without selling this one.
Negotiation context
- Only 13 days on market — expect competitive offers; lowballing is unlikely to land.
- Current owner paid $32k; list at $130k implies a 300% gain — meaningful room to come down on a strong offer.
Risks & watch-outs
- Climate carrying-cost: moderate wildfire risk; extreme-heat days projected 7→17/yr by 2055 (HVAC capex compounding) — expect insurance premiums to compound above CPI over the hold.
Questions for the listing agent
- What do current leases actually rent for vs. the listed asking? Can we see a recent rent roll and the last 12 months of T-12 income?
- Built in 1975 — when were the roof, HVAC, electrical panel, plumbing, and water heater last replaced?
- Is there a deadline driving the sale (1031 exchange, divorce, estate, relocation)? That informs how much negotiation room exists.
- Crime grade is F in this area — have there been break-ins, vandalism, or insurance claims at this property in the last 3 years? What carrier currently insures it and at what premium?
- The area grade is low — what's the realistic commute time and amenity access for the typical tenant pool here? Any planned neighborhood developments (good or bad) we should know about?
- What's the average days-on-market for RENTAL listings here right now (not sales)? A rising rental-DOM trend means longer vacancies and softer asking-rent achievability than the comps imply.
- What's the recent tenant-quality profile in this submarket — average credit score on applications, eviction rate, late-payment / NSF rate, and stable-employment percentage? A property-management company in the area should have these aggregated.
- How much new for-sale + rental construction is in the pipeline within 1–3 miles? Heavy new supply typically softens prices + rents 12–24 months out; constrained supply supports both.
Investment metrics
- 1% rule
- 0.83% ✗
- Cap rate
- 6.09%
- Cash-on-cash
- -0.73%
- DSCR
- 0.97
- GRM
- 10.1
CMA / ARV
No comps found within radius.
Projected returns pro-forma
4.09% appreciation · 3.0% rent growth · sell at horizon
- IRR
- 9.9%
- Equity multiple
- 1.60×
- Total profit
- $21,860
- Equity at exit
- $66,514
- IRR
- 11.7%
- Equity multiple
- 2.95×
- Total profit
- $70,829
- Equity at exit
- $109,312
Cash invested: $36,372 (down + closing). Projections, not guarantees.
Landlord ↔ Tenant lean methodology
- Overall (STATE)
- 83 Strongly Landlord-Friendly
- State Kansas
- 83 Strongly Landlord-Friendly · R+10
- County
- — inherits STATE
- City
- — inherits STATE
ZIP-level market 67441
- Home prices YoY
- 2.7%
- Active inventory
- 6
- Price-to-rent
- 10.1×
Monthly cashflow live
- Estimated rent
- $1,075 medium interval (Pro) →
- Mortgage (P&I)
- −$681
- Tax from tax record
- −$136 /mo · $1,630/yr
- Insurance
- −$54
- HOA
- −$0
- Vacancy / Maint / Mgmt
- −$226
- Net cashflow
- $-22
Break-even live
UW: 25.0% down · 7.5% · 30yr · 1.5% tax · 5.0% vac · 8.0% maint · 8.0% mgmt
Financing live
Cash to close
- Down payment
- $32,475
- Closing costs
- $3,897
- Reserves months
- —
- Total cash needed
- —
Loan-product check · same deal, 3 products live
Conventional
25% down · 7.5% · 30yr
- Down + closing
- —
- Monthly P&I
- —
- Monthly cashflow
- —
- DSCR
- —
- Eligible?
- —
Personal DTI + credit; lowest rate.
DSCR
20% down · 8.5% · 30yr
- Down + closing
- —
- Monthly P&I
- —
- Monthly cashflow
- —
- DSCR
- —
- Eligible?
- —
No personal income docs; deal must DSCR.
Hard money
10% down · 12.0% · 12mo
- Down + closing
- —
- Monthly P&I
- —
- Monthly cashflow
- —
- DSCR
- —
- Eligible?
- —
Short-term bridge; refi at stabilization.
Listing history 5 events
-
2026-04-14status Pending
-
2026-03-31price $129,900
-
2026-03-31$125,000 Active
-
1996-06-01soldstatus $32,500
-
1996-05-01soldstatus $45,300
ⓘ Source: listings_history table (triggers on properties + properties_extension) + one-shot
backfill from property_details.listing_events for pre-trigger history.
Tax reassessment forecast KS · Resets to sale price
- Current annual tax
- $1,630 · $136/mo
- Projected year-2 tax
- $1,832 · $153/mo
- Expected delta
- +$201/yr (+$17/mo · 12.3%)
ⓘ Screening estimate from a state-policy table — verify with the county assessor before closing.
Climate risk First Street
- Flood 1/10 Low 0% chance over 30 yrs
- Wildfire 5/10 Major
- Heat 5/10 Major 7 d/yr ≥108°F today · 17 d/yr by 30 yrs out
- Wind 2/10 Low
- Air quality 2/10 Low 1 unhealthy d/yr today · 1 by 30 yrs out
Nearby sold comps map
Loading sold comps map…
Walkable amenities ~0.75 mi
Loading nearby amenities…
Taxation est. · year 1
- Rental income
- $12,898
- − Mortgage interest
- −$7,276
- − Property taxes
- −$1,630
- − Insurance
- −$650
- − Repairs & maintenance
- −$1,032
- − Management
- −$1,032
- − Depreciation
- −$3,779
- Taxable loss
- −$2,501
- Est. tax savings @ 24.0%
- +$600
- After-tax cash flow
- $335/yr
For passive investors: Depreciation is non-cash, so a rental often shows a tax loss while cash-flowing — sheltering income. Rental losses are passive: they offset passive income freely, and up to $25,000/yr can offset ordinary (W-2) income if you actively participate and your MAGI is under $100k (phasing out to $0 by $150k); unused losses carry forward. On sale, claimed depreciation is recaptured at up to 25%, and gains may owe capital-gains tax (a 1031 exchange can defer both). Figures are a year-1 estimate at your 24.0% rate — not tax advice; consult a CPA.
Schools (NCES district)
- District
- Chapman
- NCES district ID
- 2004620
- Math proficiency
- 29% ▼ -11.00%
- Reading proficiency
- 37% ▼ -5.00%
- Median HH income
- $48,961
- Composite
- 28.56/100
- National rank
- #6726
- State rank
- #73 of 169 in KS
Livability — Enterprise
- Score
- 67/100
- State rank
- #248
- US rank
- #10975
Category grades
Schools grade is shown separately in the Schools card above.
Census & demographics
- Census place
- Enterprise, KS
- Population (ZIP)
- 1,041
Population outlook (Dickinson County) Hauer SSP2
- Today (2025)
- 18,727 people
- By 2030
- 18,312 · -2.2%
- By 2040
- 17,433 · -6.9%
- By 2050
- 16,493 · -11.9%
- By 2075
- 14,441 · -22.9%
- By 2100
- 11,707 · -37.5%
Race, ethnicity, and origin ACS 2023
- Neighborhood character
- Predominantly White (80%)
- Race & ethnicity
- White 80% Two or more races 14% Hispanic / Latino 4% Asian 2%
- Common ancestry
- Italian 3% Slovak 2% Iranian 1%
- Foreign-born
- 3% · Canada
- Languages at home
- 97% English-only · Russian/Polish/Slavic 2% Other Indo-European 1%
Political lean MEDSL · Dickinson
- 2024 margin
- Solid R (+55.0) · D 21.8% · R 76.7% · Other 1.5%
- 2008→2024 swing
- -12.8pp toward R · 2008: -42.2pp · 2024: -55.0pp
- All cycles
- 2024: R+55.0 2020: R+54.1 2016: R+54.0 2012: R+47.7 2008: R+42.2
Not yet ingested
- Civics
- —
Market trends
- HPI YoY
- ▲ 4.09%
- Current HPI
- 155.6649
- Rent YoY
- —
- Metro
- —
- State GDP YoY
- —
- F500 in state
- 0
Price history
+186.8% since first listed5 events — show timeline
- 2026-04-14 Pending — FHAOR as distributed by MLS GRID
- 2026-03-31 Price Changed $129,900 FHAOR as distributed by MLS GRID
- 2026-03-31 Listed $125,000 FHAOR as distributed by MLS GRID
- 1996-06-01 Sold (Public Records) $32,500 Public Records
- 1996-05-01 Sold (Public Records) $45,300 Public Records
Property tax history
+2.3%/yrLatest (2025): $1,630 · +2.3% YoY. Source: county tax records.
Cash-flow waterfall
monthlySold comps — $/sqft
last 12 mo · ≤1 miLoading sold comps…