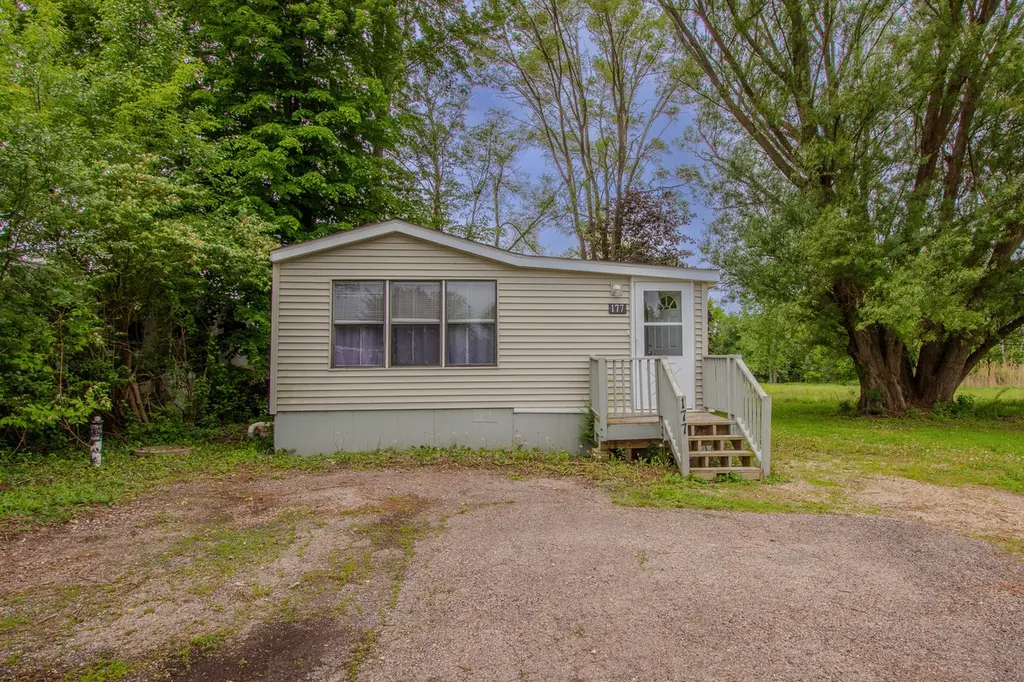
177 Windward · Lakemoor, IL
Flood risk 1/10 · Minimal
- FEMA flood zone
- X (unshaded)
- Chance of flooding over 30 yrs
- 0.0%
- Est. flood insurance / yr
- $507 – $1,088
Fire risk 4/10 · Minor
- Est. fire insurance / yr
- $804 – $1,492
Heat risk 2/10 · Minimal
- Hot days now (above 100°F)
- 7 days/yr
- Hot days in 30 yrs
- 14 days/yr
Wind risk 2/10 · Minimal
- Chance of severe wind over 30 yrs
- —
Air-quality risk 2/10 · Minimal
- Unhealthy air days now
- 1 days/yr
- Unhealthy air days in 30 yrs
- 2 days/yr
Risk factors via First Street. Map © Google.
Why this score? — see what drove the C grade
The composite is a weighted blend of 9 inputs, each scored 0–100. Each bar is that input's sub-score; the figure is the points it added to the 100-point composite (weight × sub-score).
- Cash flow +21.3/30.0
- Appreciation +10.0/10.0
- DSCR +6.8/10.0
- 1% rule +6.5/10.0
- Livability +3.6/5.0
- Rent growth +2.5/5.0
- Condition / age +2.5/5.0
- Schools +2.3/10.0
- ARV discount +0.0/15.0
$120,000
🖨 Deal sheet 📄 Offer letter ✓ Due diligence
Listing remarks MLS
Quaint and cozy best describe this one bedroom, one bath cottage located in the desirable Ports of Sullivan neighborhood! This property is on a double lot, the location makes it the ideal getaway home! Minutes from the Chain of lakes, close to the Fox River, you can utilize this cottage for summer and winter activities! The property has a nice floor plan, tons of windows, wooded lot! The home is unique and they do not come available often! Get inside today and take a look!
Key facts
- Manufactured home
- Newer roof
- Newer appliances
Tags
Property features AI
Finance
- Other: School bus service available; Located in the Ports of Sullivan subdivision
- HOA & community: Annual association fee of $700; Association covers water, clubhouse, pool, and scavenger service; Community amenities include clubhouse, park, pool, and tennis courts
Exterior
- Parking: Four parking spaces total; Driveway parking (dirt, gravel, owned)
- Utilities: Shared well water; Holding tank sewer; 100 amp electric service
- Home design: Detached single-family, manufactured home; Fee simple ownership with homeowners association; Age: 31–40 years; Asphalt roof; Vinyl siding
- Construction: Vinyl siding construction; Asphalt roof
- Exterior features: On golf course; Mature trees; Level lot; Lot dimensions approximately 100 x 80
Interior
- Kitchen: Range; Microwave; Refrigerator; Hardwood flooring in kitchen
- Bedrooms: Master bedroom (main level) with full bath; Additional bedrooms (2, 3, 4)
- Flooring: Laminate flooring in main living areas and bedrooms; Hardwood flooring in kitchen
- Bathrooms: One full bathroom
- Heating & cooling: Propane heat; Partial cooling with window unit(s)
- Interior features: Four total rooms; Kitchen/dining combo; CO detectors; Ceiling fan(s); Gas water heater; Electric fireplace in living room
- Laundry & utility: Laundry room
Neighborhood map
What this means for you Summary
Snapshot
- This is a 1-bed/1.0-bath single-family listed at $120k.
Deal economics
- At list price, monthly cash flow is $175 ($2k/yr) — positive.
- The deal already cash-flows at list — no discount required.
- Meets the 1% rule at list price ($1k rent vs $120k).
- Cap rate 8.0% vs local median 3.9% in Lakemoor — top-decile yield for the area; either an underpriced asset or a hidden risk that comps aren't pricing in. Stress-test before assuming the spread holds.
Location & tenants
- Location reads 72/100 on livability (#317 in IL) — a middle-class / working-renter tenant base. Strengths: employment A+, housing A+, health & safety A-; Watch: amenities F, commute F.
- Grant Chsd 124 (suburban): math 23% / reading 27% proficiency, ranked #296 of 620 in IL (top 48%) — low school quality limits family demand, transient renter base, plan for 1-2y turnover.
- Zoned schools: Grant Community High School (math 23% / reading 27%, grade F, #247 of 693 statewide, top 36%, 1,837 students, 0% FRL).
- Market conditions: 152 active listings in the ZIP; 948 units permitted in Lake County in 2024 (424 in 5+ unit buildings).
Forward outlook
- In year one you build about $13k of equity ($830 loan paydown + $12k appreciation (10.0% local appreciation)).
- Lake County population projected to shrink 8% by 2050 — rents likely to lag national; underwrite the cash flow, not the appreciation.
- At projected returns (10.0% appreciation + 3.0% rent growth), your $34k cash investment doubles in ~3 years — after that, you're playing with house money.
- By year 3, paydown + projected appreciation supports a ~$32k cash-out refi (75% LTV) — recoverable capital for the next deal without selling this one.
Negotiation context
- Only 5 days on market — expect competitive offers; lowballing is unlikely to land.
- 5 sale attempts since 19y ago with the ask held roughly flat each time — persistent listings suggest the price (not the market) is what's stuck; bring a comps-based counter.
- Current owner paid $18k; list at $120k implies a 549% gain — meaningful room to come down on a strong offer.
Questions for the listing agent
- What does the HOA fee cover, when was the last increase, and are there any pending special assessments or reserve-fund shortfalls?
- Is there a deadline driving the sale (1031 exchange, divorce, estate, relocation)? That informs how much negotiation room exists.
- Schools are F-rated, which usually means shorter tenancies and higher turnover. Who's the typical renter profile here, and what's been the actual vacancy rate?
- What's the average days-on-market for RENTAL listings here right now (not sales)? A rising rental-DOM trend means longer vacancies and softer asking-rent achievability than the comps imply.
- What's the recent tenant-quality profile in this submarket — average credit score on applications, eviction rate, late-payment / NSF rate, and stable-employment percentage? A property-management company in the area should have these aggregated.
- How much new for-sale + rental construction is in the pipeline within 1–3 miles? Heavy new supply typically softens prices + rents 12–24 months out; constrained supply supports both.
Investment metrics
- 1% rule
- 1.15% ✓
- Cap rate
- 8.04%
- Cash-on-cash
- 6.25%
- DSCR
- 1.28
- GRM
- 7.3
CMA / ARV
- ARV (on-the-fly)
- $83,640
- Comps found
- 1
Show comp detail 1 sale within ~0.75 mi
| Address | Dist | Beds/Ba | Sqft | Sold | Price | $/sf | Match |
|---|---|---|---|---|---|---|---|
| 44 Beacon Bay | 0.36mi | 1/1.0 | 350 (+3%) | 19mo | $86,000 | $246 | 62 |
Match score weights: distance 35% · size 25% · config 20% · recency 20%. Top-matched comps best support the ARV.
Projected returns pro-forma
10.0% appreciation · 3.0% rent growth · sell at horizon
- IRR
- 28.8%
- Equity multiple
- 3.28×
- Total profit
- $76,571
- Equity at exit
- $108,106
- IRR
- 25.1%
- Equity multiple
- 7.45×
- Total profit
- $216,867
- Equity at exit
- $233,134
Cash invested: $33,600 (down + closing). Projections, not guarantees.
Landlord ↔ Tenant lean methodology
- Overall (STATE)
- 43 Moderately Tenant-Leaning
- State Illinois
- 43 Moderately Tenant-Leaning · D+7
- County
- — inherits STATE
- City
- — inherits STATE
ZIP-level market 60051
- Home prices YoY
- 4.9%
- Active inventory
- 152
- Price-to-rent
- 7.3×
Monthly cashflow live
- Estimated rent
- $1,375 medium interval (Pro) →
- Mortgage (P&I)
- −$629
- Tax from tax record
- −$174 /mo · $2,085/yr
- Insurance
- −$50
- HOA
- −$58
- Vacancy / Maint / Mgmt
- −$289
- Net cashflow
- $175
Break-even live
UW: 25.0% down · 7.5% · 30yr · 1.5% tax · 5.0% vac · 8.0% maint · 8.0% mgmt
Financing live
Cash to close
- Down payment
- $30,000
- Closing costs
- $3,600
- Reserves months
- —
- Total cash needed
- —
Loan-product check · same deal, 3 products live
Conventional
25% down · 7.5% · 30yr
- Down + closing
- —
- Monthly P&I
- —
- Monthly cashflow
- —
- DSCR
- —
- Eligible?
- —
Personal DTI + credit; lowest rate.
DSCR
20% down · 8.5% · 30yr
- Down + closing
- —
- Monthly P&I
- —
- Monthly cashflow
- —
- DSCR
- —
- Eligible?
- —
No personal income docs; deal must DSCR.
Hard money
10% down · 12.0% · 12mo
- Down + closing
- —
- Monthly P&I
- —
- Monthly cashflow
- —
- DSCR
- —
- Eligible?
- —
Short-term bridge; refi at stabilization.
HOA detail
- Monthly dues
- $58 · $696/yr
Listing history 18 events
-
2026-05-19$120,000 Active
-
2018-11-16soldstatus $18,500
-
2018-10-29soldstatus $18,500 Closed Sale 477-char remark
Show marketing remark (477 chars)
Quaint and cozy best describe this one bedroom, one bath cottage located in the desirable Ports of Sullivan neighborhood! This property is on a double lot, the location makes it the ideal getaway home! Minutes from the Chain of lakes, close to the Fox River, you can utilize this cottage for summer and winter activities! The property has a nice floor plan, tons of windows, wooded lot! The home is unique and they do not come available often! Get inside today and take a look!
-
2018-10-02status Pending 477-char remark
Show marketing remark (477 chars)
Quaint and cozy best describe this one bedroom, one bath cottage located in the desirable Ports of Sullivan neighborhood! This property is on a double lot, the location makes it the ideal getaway home! Minutes from the Chain of lakes, close to the Fox River, you can utilize this cottage for summer and winter activities! The property has a nice floor plan, tons of windows, wooded lot! The home is unique and they do not come available often! Get inside today and take a look!
-
2018-08-23$24,900 New 477-char remark
Show marketing remark (477 chars)
Quaint and cozy best describe this one bedroom, one bath cottage located in the desirable Ports of Sullivan neighborhood! This property is on a double lot, the location makes it the ideal getaway home! Minutes from the Chain of lakes, close to the Fox River, you can utilize this cottage for summer and winter activities! The property has a nice floor plan, tons of windows, wooded lot! The home is unique and they do not come available often! Get inside today and take a look!
-
2015-03-28status Pending
-
2015-03-17historical
-
2015-02-27price
-
2014-12-27price
-
2014-12-27status Reactivated
-
2014-10-11status Pending
-
2014-08-22historical Contingent
-
2014-08-08New
-
2007-11-06soldstatus $80,000
-
2007-09-27historical
-
2007-06-14
-
2003-10-17soldstatus $55,000
-
1996-03-25soldstatus $12,000
ⓘ Source: listings_history table (triggers on properties + properties_extension) + one-shot
backfill from property_details.listing_events for pre-trigger history.
Tax reassessment forecast IL · Partial reset (capped growth)
- Current annual tax
- $2,085 · $174/mo
- Projected year-2 tax
- $2,404 · $200/mo
- Expected delta
- +$320/yr (+$27/mo · 15.3%)
ⓘ Screening estimate from a state-policy table — verify with the county assessor before closing.
Climate risk First Street
- Flood 1/10 Low FEMA zone X (unshaded) · 0% chance over 30 yrs
- Wildfire 4/10 Moderate
- Heat 2/10 Low 7 d/yr ≥100°F today · 14 d/yr by 30 yrs out
- Wind 2/10 Low
- Air quality 2/10 Low 1 unhealthy d/yr today · 2 by 30 yrs out
Nearby sold comps map
Loading sold comps map…
Walkable amenities ~0.75 mi
Loading nearby amenities…
Taxation est. · year 1
- Rental income
- $16,497
- − Mortgage interest
- −$6,722
- − Property taxes
- −$2,085
- − Insurance
- −$600
- − Repairs & maintenance
- −$1,320
- − Management
- −$1,320
- − HOA
- −$696
- − Depreciation
- −$3,491
- Taxable income
- $263
- Est. tax owed @ 24.0%
- −$63
- After-tax cash flow
- $2,037/yr
For passive investors: Depreciation is non-cash, so a rental often shows a tax loss while cash-flowing — sheltering income. Rental losses are passive: they offset passive income freely, and up to $25,000/yr can offset ordinary (W-2) income if you actively participate and your MAGI is under $100k (phasing out to $0 by $150k); unused losses carry forward. On sale, claimed depreciation is recaptured at up to 25%, and gains may owe capital-gains tax (a 1031 exchange can defer both). Figures are a year-1 estimate at your 24.0% rate — not tax advice; consult a CPA.
Schools (NCES district)
- District
- Grant Chsd 124
- NCES district ID
- 1717340
- Math proficiency
- 23% ▼ -9.00%
- Reading proficiency
- 27% ▼ -7.00%
- Median HH income
- $59,450
- Composite
- 22.95/100
- National rank
- #7989
- State rank
- #296 of 620 in IL
Livability — Lakemoor
- Score
- 72/100
- State rank
- #317
- US rank
- #6294
Category grades
Schools grade is shown separately in the Schools card above.
Census & demographics
- Census place
- Lakemoor, IL
- Population (ZIP)
- 23,931
Population outlook (Lake County) Hauer SSP2
- Today (2025)
- 700,217 people
- By 2030
- 693,290 · -1.0%
- By 2040
- 673,588 · -3.8%
- By 2050
- 643,556 · -8.1%
- By 2075
- 562,792 · -19.6%
- By 2100
- 457,715 · -34.6%
Race, ethnicity, and origin ACS 2023
- Neighborhood character
- Predominantly White (84%)
- Race & ethnicity
- White 84% Hispanic / Latino 10% Two or more races 6% Asian 2%
- Hispanic origin (detail)
- Mexican 8%
- Common ancestry
- Romanian 12% Slovak 2% Lithuanian 2%
- Foreign-born
- 5% · Canada
- Languages at home
- 92% English-only · Spanish 5% Other Indo-European 2% Russian/Polish/Slavic 1%
Political lean MEDSL · Lake
- 2024 margin
- Strong D (+20.8) · D 59.7% · R 38.9% · Other 1.4%
- 2008→2024 swing
- +1.1pp toward D · 2008: 19.6pp · 2024: 20.8pp
- All cycles
- 2024: D+20.8 2020: D+24.1 2016: D+20.3 2012: D+8.1 2008: D+19.6
Not yet ingested
- Civics
- —
Market trends
- HPI YoY
- ▲ 28.50%
- Current HPI
- 612.07
- Rent YoY
- —
- Metro
- —
- State GDP YoY
- ▲ 1.59%
- F500 in state
- 60
Industry mix (Fortune 500 HQ in IL)
| Industry | F500 HQs | Revenue |
|---|---|---|
| Insurance | 4 | $201B |
|
||
| Consumer Goods | 4 | $87B |
|
||
| Industrial Machinery | 3 | $64B |
|
||
| Healthcare | 2 | $55B |
|
||
| Retail / Pharmacy | 1 | $148B |
|
||
| Agriculture / Food | 1 | $86B |
|
||
Price history
+900.0% since first listed18 events — show timeline
- 2026-05-19 Listed $120,000 MRED as Distributed by MLS Grid
- 2018-11-16 Sold (Public Records) $18,500 Public Records
- 2018-10-29 Sold (MLS) $18,500 MRED as Distributed by MLS Grid
- 2018-10-02 Pending — MRED as Distributed by MLS Grid
- 2018-08-23 Listed $24,900 MRED as Distributed by MLS Grid
- 2015-03-28 Pending — MRED as Distributed by MLS Grid
- 2015-03-17 Listing Removed — MRED as Distributed by MLS Grid
- 2015-02-27 Price Changed — MRED as Distributed by MLS Grid
- 2014-12-27 Relisted — MRED as Distributed by MLS Grid
- 2014-12-27 Price Changed — MRED as Distributed by MLS Grid
- 2014-10-11 Pending — MRED as Distributed by MLS Grid
- 2014-08-22 Contingent — MRED as Distributed by MLS Grid
- 2014-08-08 Listed — MRED as Distributed by MLS Grid
- 2007-11-06 Sold (Public Records) $80,000 Public Records
- 2007-09-27 Listing Removed — MRED as Distributed by MLS Grid
- 2007-06-14 Listed — MRED as Distributed by MLS Grid
- 2003-10-17 Sold (Public Records) $55,000 Public Records
- 1996-03-25 Sold (Public Records) $12,000 Public Records
Property tax history
+4.2%/yrLatest (2024): $2,085 · +13.8% YoY. Source: county tax records.
Cash-flow waterfall
monthlySold comps — $/sqft
last 12 mo · ≤1 miLoading sold comps…