 🏷️ Likely Rental
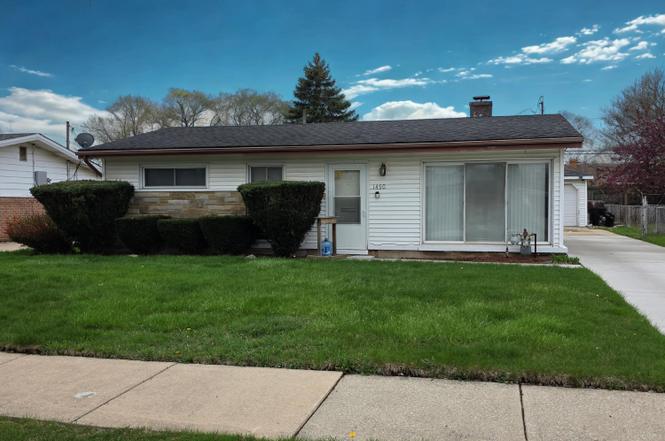
1490 Stanley Blvd · Calumet City, IL
Flood risk 4/10 · Minor
- FEMA flood zone
- X (shaded)
- Chance of flooding over 30 yrs
- 0.24%
- Est. flood insurance / yr
- $473 – $860
Fire risk 1/10 · Minimal
- Est. fire insurance / yr
- $804 – $1,492
Heat risk 3/10 · Minor
- Hot days now (above 102°F)
- 7 days/yr
- Hot days in 30 yrs
- 15 days/yr
Wind risk 2/10 · Minimal
- Chance of severe wind over 30 yrs
- —
Air-quality risk 4/10 · Minor
- Unhealthy air days now
- 5 days/yr
- Unhealthy air days in 30 yrs
- 6 days/yr
Risk factors via First Street. Map © Google.
Why this score? — see what drove the B+ grade
The composite is a weighted blend of 9 inputs, each scored 0–100. Each bar is that input's sub-score; the figure is the points it added to the 100-point composite (weight × sub-score).
- Cash flow +30.0/30.0
- ARV discount +15.0/15.0
- 1% rule +10.0/10.0
- DSCR +10.0/10.0
- Rent growth +4.0/5.0
- Livability +3.6/5.0
- Condition / age +2.5/5.0
- Schools +1.0/10.0
- Appreciation +0.0/10.0
$110,000
🖨 Deal sheet 📄 Offer letter ✓ Due diligence
Listing remarks MLS
UPDATE: No longer tenant-occupied. NOW OPEN TO ALL HOME BUYERS. Located in Calumet City, this 3 bedroom, 1 bath ranch offers a great opportunity for homeowners or investors. While it needs a few updates, this home features a single-level layout, a detached garage, a manageable yard, and a newer concrete driveway. Conveniently located near Schrum Memorial Middle School. Quick close available, schedule your showing today.
Key facts
- Manageable yard
- Single-level layout
- Detached garage
Tags
Property features AI
Finance
- Other: Fee simple ownership; Property is not currently leased; Estimated living area (approx. 1,010 finished square feet); Built before 1978; Parcel number 30203120380000
- Financial info: Special service area: No
- HOA & community: No master association fees required
Exterior
- Parking: Detached concrete garage with 2 garage spaces (2 total parking spaces)
- Utilities: Water from Lake Michigan and public supply; Public sewer
- Home design: Detached single-family home; One-story
- Construction: Built approximately 61–70 years ago; Vinyl siding and brick exterior
- Exterior features: Flood zone; Lot dimensions approximately 54 x 111; Lot smaller than 0.25 acre
Interior
- Kitchen: Kitchen (main level, 9 x 16)
- Bedrooms: 3 bedrooms (all on the main level); Master bedroom (main level, 9 x 13); Bedroom 2 (main level, 9 x 13); Bedroom 3 (main level, 9 x 10)
- Bathrooms: 1 full bathroom
- Heating & cooling: Natural gas forced-air heating; Central air conditioning
- Interior features: Five total rooms; Dining room; Family room; Living room (11 x 17)
- Laundry & utility: Dedicated laundry room
Neighborhood map
What this means for you Summary
Snapshot
- This is a 3-bed/1.0-bath single-family listed at $110k.
Deal economics
- At list price, monthly cash flow is $562 ($7k/yr) — positive.
- The deal already cash-flows at list — no discount required.
- Meets the 1% rule at list price ($2k rent vs $110k).
- Recommended offer: $103k (6.0% below list) — sets the bar for market timing.
- Cap rate 12.4% vs local median 8.2% in Calumet City — top-decile yield for the area; either an underpriced asset or a hidden risk that comps aren't pricing in. Stress-test before assuming the spread holds.
Location & tenants
- Location reads 71/100 on livability (#330 in IL) — a middle-class / working-renter tenant base. Strengths: commute A+, cost of living A+, housing A+; Watch: employment C-, schools F, crime D-.
- Thornton Fractional Twp Hsd 215 (suburban): math 9% / reading 13% proficiency, ranked #563 of 620 in IL (top 91%) — low school quality limits family demand, transient renter base, plan for 1-2y turnover.
- Market conditions: Rents rising fast (+6.2%/yr); 198 active listings in the ZIP; 17 comparable units currently listed for rent nearby; rentals at typical pace (median 17d on market — plan ~3-4 weeks tenant-placement turnaround); 6,272 units permitted in Cook County in 2024 (4,658 in 5+ unit buildings).
- This rent runs 36% of the median local income ($55k/yr) — at the standard rent-burdened threshold; future hikes will face affordability resistance.
Forward outlook
- Local home prices are declining (-3.0%/yr); year-one equity from $761 of loan paydown is wiped out by about $3k of value loss. Plan a longer hold.
- At projected returns (-3.0% appreciation + 6.2% rent growth), your $31k cash investment doubles in ~5 years — after that, you're playing with house money.
Negotiation context
- It's been on market 61 days — a 6% lower offer ($103k) is reasonable based on typical stale-listing flexibility.
- 2 sale attempts; this cycle's ask has dropped $15k (12%) from the opening price — seller is motivated, your offer sets the floor, not the list.
- Current owner paid $66k; list at $110k implies a 67% gain — meaningful room to come down on a strong offer.
Risks & watch-outs
- Watch-outs: built in 1956 — expect roof / HVAC / electrical / plumbing capex.
Questions for the listing agent
- It's been on market 61 days. Have you received any prior offers? Is the seller open to a 6% concession, seller financing, or rate buy-down credit?
- Built in 1956 — when were the roof, HVAC, electrical panel, plumbing, and water heater last replaced?
- Why hasn't it sold? Are there any deal-killer items the seller is aware of (foundation, flood, title, zoning, code violations)?
- Is there a deadline driving the sale (1031 exchange, divorce, estate, relocation)? That informs how much negotiation room exists.
- Schools are F-rated, which usually means shorter tenancies and higher turnover. Who's the typical renter profile here, and what's been the actual vacancy rate?
- Crime grade is D in this area — have there been break-ins, vandalism, or insurance claims at this property in the last 3 years? What carrier currently insures it and at what premium?
- What's the average days-on-market for RENTAL listings here right now (not sales)? A rising rental-DOM trend means longer vacancies and softer asking-rent achievability than the comps imply.
- What's the recent tenant-quality profile in this submarket — average credit score on applications, eviction rate, late-payment / NSF rate, and stable-employment percentage? A property-management company in the area should have these aggregated.
- How much new for-sale + rental construction is in the pipeline within 1–3 miles? Heavy new supply typically softens prices + rents 12–24 months out; constrained supply supports both.
Investment metrics
- 1% rule
- 1.52% ✓
- Cap rate
- 12.43%
- Cash-on-cash
- 21.90%
- DSCR
- 1.97
- GRM
- 5.5
CMA / ARV
- ARV (on-the-fly)
- $141,400
- Comps found
- 12
Show comp detail 12 sales within ~0.75 mi
| Address | Dist | Beds/Ba | Sqft | Sold | Price | $/sf | Match |
|---|---|---|---|---|---|---|---|
| 1531 Lincoln Ave | 0.22mi | 3/1.0 | 1,109 (+10%) | 1mo | $170,000 | $153 | 73 |
| 1554 Burnham Ave | 0.27mi | 2/1.0 (-1) | 945 (-6%) | 2mo | $125,000 | $132 | 70 |
| 17115 Park Ave | 0.57mi | 3/1.0 | 1,030 (+2%) | 2mo | $179,999 | $175 | 69 |
| 1394 Forest Pl | 0.29mi | 3/1.0 | 1,147 (+14%) | 2mo | $81,000 | $71 | 62 |
| 116 163rd St | 0.46mi | 3/1.0 | 1,125 (+11%) | 1mo | $61,500 | $55 | 59 |
| 1382 Burnham Ave | 0.34mi | 3/1.5 | 1,147 (+14%) | 1mo | $105,000 | $92 | 59 |
| 1374 Kenilworth Dr | 0.46mi | 3/2.0 | 1,111 (+10%) | 0mo | $138,000 | $124 | 58 |
| 17222 Roy St | 0.57mi | 2/1.0 (-1) | 945 (-6%) | 1mo | $149,900 | $159 | 57 |
| 1263 Mackinaw Ave | 0.64mi | 3/1.5 | 1,102 (+9%) | 1mo | $175,900 | $160 | 52 |
| 1636 State Line Rd | 0.63mi | 3/3.0 | 1,084 (+7%) | 2mo | $241,000 | $222 | 49 |
| 43 162nd Pl | 0.52mi | 3/2.5 | 1,135 (+12%) | 0mo | $159,000 | $140 | 48 |
| 910 163rd St | 0.66mi | 3/1.5 | 1,160 (+15%) | 1mo | $150,000 | $129 | 42 |
Match score weights: distance 35% · size 25% · config 20% · recency 20%. Top-matched comps best support the ARV.
Projected returns pro-forma
-3.0% appreciation · 6.17% rent growth · sell at horizon
- IRR
- 18.1%
- Equity multiple
- 1.76×
- Total profit
- $23,510
- Equity at exit
- $16,401
- IRR
- 28.7%
- Equity multiple
- 3.95×
- Total profit
- $90,799
- Equity at exit
- $9,511
Cash invested: $30,800 (down + closing). Projections, not guarantees.
Landlord ↔ Tenant lean methodology
- Overall (STATE)
- 43 Moderately Tenant-Leaning
- State Illinois
- 43 Moderately Tenant-Leaning · D+7
- County
- — inherits STATE
- City
- — inherits STATE
ZIP-level market 60409
- Home prices YoY
- -27.6%
- Rents YoY
- 6.2%
- Active inventory
- 198
- Price-to-rent
- 5.5×
Monthly cashflow live
- Estimated rent
- $1,674 high interval (Pro) →
- Mortgage (P&I)
- −$577
- Tax est. 1.5%
- −$138 /mo · $1,650/yr
- Insurance
- −$46
- HOA
- −$0
- Vacancy / Maint / Mgmt
- −$351
- Net cashflow
- $562
Break-even live
UW: 25.0% down · 7.5% · 30yr · 1.5% tax · 5.0% vac · 8.0% maint · 8.0% mgmt
Financing live
Cash to close
- Down payment
- $27,500
- Closing costs
- $3,300
- Reserves months
- —
- Total cash needed
- —
Loan-product check · same deal, 3 products live
Conventional
25% down · 7.5% · 30yr
- Down + closing
- —
- Monthly P&I
- —
- Monthly cashflow
- —
- DSCR
- —
- Eligible?
- —
Personal DTI + credit; lowest rate.
DSCR
20% down · 8.5% · 30yr
- Down + closing
- —
- Monthly P&I
- —
- Monthly cashflow
- —
- DSCR
- —
- Eligible?
- —
No personal income docs; deal must DSCR.
Hard money
10% down · 12.0% · 12mo
- Down + closing
- —
- Monthly P&I
- —
- Monthly cashflow
- —
- DSCR
- —
- Eligible?
- —
Short-term bridge; refi at stabilization.
Rent comps 17 comps
| Address | Beds | Baths | Sqft | Rent | $/sqft | DOM | Units | Dist |
|---|---|---|---|---|---|---|---|---|
| 1539 Wentworth Ave Unit 3W Calumet City, IL | 3.0 | 1.0 | 1100 | $1,700 | $1.55 | 12d | 1 | 0.35mi |
| 1312 Gordon Ave Calumet City, IL | 2.0 | 1.0 | 1134 | $1,600 | $1.41 | 7d | 1 | 0.47mi |
| 1338 Wentworth Ave Unit 1338 Calumet City, IL | 2.0 | 1.0 | 800 | $1,430 | $1.79 | 24d | 1 | 0.50mi |
| 3069 Bernice Rd Apt 2N Lansing, IL | 3.0 | 1.0 | 950 | $1,535 | $1.62 | 20d | 1 | 0.82mi |
| 3069 Bernice Rd Apt 2S Lansing, IL | 3.0 | 1.0 | 950 | $1,535 | $1.62 | 2d | 1 | 0.83mi |
| 3023 Bernice Rd Apt 2S Lansing, IL | 3.0 | 1.0 | 1000 | $1,600 | $1.60 | 1d | 1 | 0.85mi |
| 3649 173rd Ct Lansing, IL | 2.0 | 2.0 | 972 | $1,357 | $1.40 | 24d | 1 | 0.87mi |
| 407 Kenwood St Hammond, IN | 2.0 | 1.0 | 920 | $1,495 | $1.62 | 24d | 1 | 1.13mi |
| 407 Kenwood St Hammond, IN | 2.0 | 1.0 | 920 | $1,495 | $1.62 | 16d | 1 | 1.13mi |
| 34 Elizabeth St Calumet City, IL | 3.0 | 1.0 | 1246 | $2,400 | $1.93 | 1d | 1 | 1.15mi |
| 3 Waltham St Hammond, IN | 3.0 | 1.0 | 1200 | $1,095 | $0.91 | 24d | 1 | 1.26mi |
| 3020 178th St Unit C1 Lansing, IL | 2.0 | 1.0 | 900 | $1,550 | $1.72 | 1d | 1 | 1.28mi |
| 3020 178th St Apt C7 Lansing, IL | 2.0 | 1.0 | 900 | $1,550 | $1.72 | 24d | 1 | 1.28mi |
| 5 Ruth St Unit 2W Hammond, IN | 2.0 | 1.0 | 900 | $1,250 | $1.39 | 12d | 1 | 1.30mi |
| 3 Ruth St Hammond, IN | 2.0 | 1.0 | 900 | $1,250 | $1.39 | 24d | 1 | 1.30mi |
| 17723 Exchange Ave Unit 17723-1N Lansing, IL | 3.0 | 2.0 | 1100 | $1,800 | $1.64 | 1d | 1 | 1.41mi |
| 115 157th St Unit 3 Calumet City, IL | 3.0 | 1.0 | 800 | $1,350 | $1.69 | 24d | 1 | 1.45mi |
Listing history 17 events
-
2026-06-16status $110,000 Pending 61 DOM
-
2026-06-15days on market $110,000 Contingent - Continue to Show 61 DOM
-
2026-06-13days on market $110,000 Contingent - Continue to Show 59 DOM
-
2026-06-09days on market $110,000 Contingent - Continue to Show 55 DOM
-
2026-06-08days on market $110,000 Contingent - Continue to Show 54 DOM
-
2026-06-07days on market $110,000 Contingent - Continue to Show 53 DOM
-
2026-06-04days on market $110,000 Contingent - Continue to Show 50 DOM
-
2026-06-03days on market $110,000 Contingent - Continue to Show 49 DOM
-
2026-06-02days on market $110,000 Contingent - Continue to Show 48 DOM
-
2026-06-01days on market $110,000 Contingent - Continue to Show 47 DOM
-
2026-05-31statusdays on market $110,000 Contingent - Continue to Show 46 DOM
-
2026-05-19price $110,000
Show marketing remark (423 chars)
UPDATE: No longer tenant-occupied. NOW OPEN TO ALL HOME BUYERS. Located in Calumet City, this 3 bedroom, 1 bath ranch offers a great opportunity for homeowners or investors. While it needs a few updates, this home features a single-level layout, a detached garage, a manageable yard, and a newer concrete driveway. Conveniently located near Schrum Memorial Middle School. Quick close available, schedule your showing today.
-
2026-05-19price $110,000 423-char remark
Show marketing remark (423 chars)
UPDATE: No longer tenant-occupied. NOW OPEN TO ALL HOME BUYERS. Located in Calumet City, this 3 bedroom, 1 bath ranch offers a great opportunity for homeowners or investors. While it needs a few updates, this home features a single-level layout, a detached garage, a manageable yard, and a newer concrete driveway. Conveniently located near Schrum Memorial Middle School. Quick close available, schedule your showing today.
-
2026-04-15$124,900 Active
Show marketing remark (423 chars)
UPDATE: No longer tenant-occupied. NOW OPEN TO ALL HOME BUYERS. Located in Calumet City, this 3 bedroom, 1 bath ranch offers a great opportunity for homeowners or investors. While it needs a few updates, this home features a single-level layout, a detached garage, a manageable yard, and a newer concrete driveway. Conveniently located near Schrum Memorial Middle School. Quick close available, schedule your showing today.
-
2026-04-15$124,900 Active 423-char remark
Show marketing remark (423 chars)
UPDATE: No longer tenant-occupied. NOW OPEN TO ALL HOME BUYERS. Located in Calumet City, this 3 bedroom, 1 bath ranch offers a great opportunity for homeowners or investors. While it needs a few updates, this home features a single-level layout, a detached garage, a manageable yard, and a newer concrete driveway. Conveniently located near Schrum Memorial Middle School. Quick close available, schedule your showing today.
-
1996-01-03soldstatus $66,000
-
1987-06-01soldstatus $45,000
ⓘ Source: listings_history table (triggers on properties + properties_extension) + one-shot
backfill from property_details.listing_events for pre-trigger history.
Climate risk First Street
- Flood 4/10 Moderate FEMA zone X (shaded) · 24% chance over 30 yrs
- Wildfire 1/10 Low
- Heat 3/10 Moderate 7 d/yr ≥102°F today · 15 d/yr by 30 yrs out
- Wind 2/10 Low
- Air quality 4/10 Moderate 5 unhealthy d/yr today · 6 by 30 yrs out
Nearby sold comps map
Loading sold comps map…
Walkable amenities ~0.75 mi
Loading nearby amenities…
Taxation est. · year 1
- Rental income
- $20,086
- − Mortgage interest
- −$6,162
- − Property taxes
- −$1,650
- − Insurance
- −$550
- − Repairs & maintenance
- −$1,607
- − Management
- −$1,607
- − Depreciation
- −$3,200
- Taxable income
- $5,310
- Est. tax owed @ 24.0%
- −$1,274
- After-tax cash flow
- $5,471/yr
For passive investors: Depreciation is non-cash, so a rental often shows a tax loss while cash-flowing — sheltering income. Rental losses are passive: they offset passive income freely, and up to $25,000/yr can offset ordinary (W-2) income if you actively participate and your MAGI is under $100k (phasing out to $0 by $150k); unused losses carry forward. On sale, claimed depreciation is recaptured at up to 25%, and gains may owe capital-gains tax (a 1031 exchange can defer both). Figures are a year-1 estimate at your 24.0% rate — not tax advice; consult a CPA.
Schools (NCES district)
- District
- Thornton Fractional Twp Hsd 215
- NCES district ID
- 1738940
- Math proficiency
- 9% ▼ -3.00%
- Reading proficiency
- 13% ▼ -3.00%
- Median HH income
- $48,207
- Composite
- 10.27/100
- National rank
- #9793
- State rank
- #563 of 620 in IL
Livability — Calumet City
- Score
- 71/100
- State rank
- #330
- US rank
- #6552
Category grades
Schools grade is shown separately in the Schools card above.
Census & demographics
- Census place
- Calumet City, IL
- County
- Cook County · 4,486,803 people
- City population
- 35,100
- Metro
- Chicago-Naperville-Elgin, IL-IN-WI
- Population (ZIP)
- 35,100
- Household income
- $55,369
- Rent vs Own
- Severe rent burden
- 2415.0
Population outlook (Cook County) Hauer SSP2
- Today (2025)
- 5,347,519 people
- By 2030
- 5,357,703 · +0.2%
- By 2040
- 5,324,924 · -0.4%
- By 2050
- 5,230,762 · -2.2%
- By 2075
- 4,785,735 · -10.5%
- By 2100
- 4,188,836 · -21.7%
Race, ethnicity, and origin ACS 2023
- Neighborhood character
- Predominantly Black (74%)
- Race & ethnicity
- Black 74% Hispanic / Latino 15% White 7% Two or more races 4%
- Hispanic origin (detail)
- Mexican 14%
- Common ancestry
- Romanian 2%
- Foreign-born
- 9% · Canada
- Languages at home
- 83% English-only · Spanish 14%
Political lean MEDSL · Cook
- 2024 margin
- Solid D (+42.0) · D 70.4% · R 28.4% · Other 1.2%
- 2008→2024 swing
- -11.4pp toward R · 2008: 53.4pp · 2024: 42.0pp
- All cycles
- 2024: D+42.0 2020: D+50.3 2016: D+53.0 2012: D+49.4 2008: D+53.4
Not yet ingested
- Civics
- —
Market trends
- HPI YoY
- ▼ -75.01%
- Current HPI
- 197.2137
- Rent YoY
- ▲ 6.17%
- Metro
- Chicago-Naperville-Elgin, IL-IN-WI
- State GDP YoY
- ▲ 1.59%
- F500 in state
- 60
Industry mix (Fortune 500 HQ in IL)
| Industry | F500 HQs | Revenue |
|---|---|---|
| Insurance | 4 | $201B |
|
||
| Consumer Goods | 4 | $87B |
|
||
| Industrial Machinery | 3 | $64B |
|
||
| Healthcare | 2 | $55B |
|
||
| Retail / Pharmacy | 1 | $148B |
|
||
| Agriculture / Food | 1 | $86B |
|
||
Price history
+144.4% since first listed6 events — show timeline
- 2026-05-19 Price Changed $110,000 MRED as Distributed by MLS Grid
- 2026-05-19 Price Changed $110,000 NIRA MLS as Distributed by MLS Grid
- 2026-04-15 Listed $124,900 NIRA MLS as Distributed by MLS Grid
- 2026-04-15 Listed $124,900 MRED as Distributed by MLS Grid
- 1996-01-03 Sold (Public Records) $66,000 Public Records
- 1987-06-01 Sold (Public Records) $45,000 Public Records
Property tax history
+5.4%/yrLatest (2023): $7,233 · +24.6% YoY. Source: county tax records.
Cash-flow waterfall
monthlySold comps — $/sqft
last 12 mo · ≤1 miLoading sold comps…