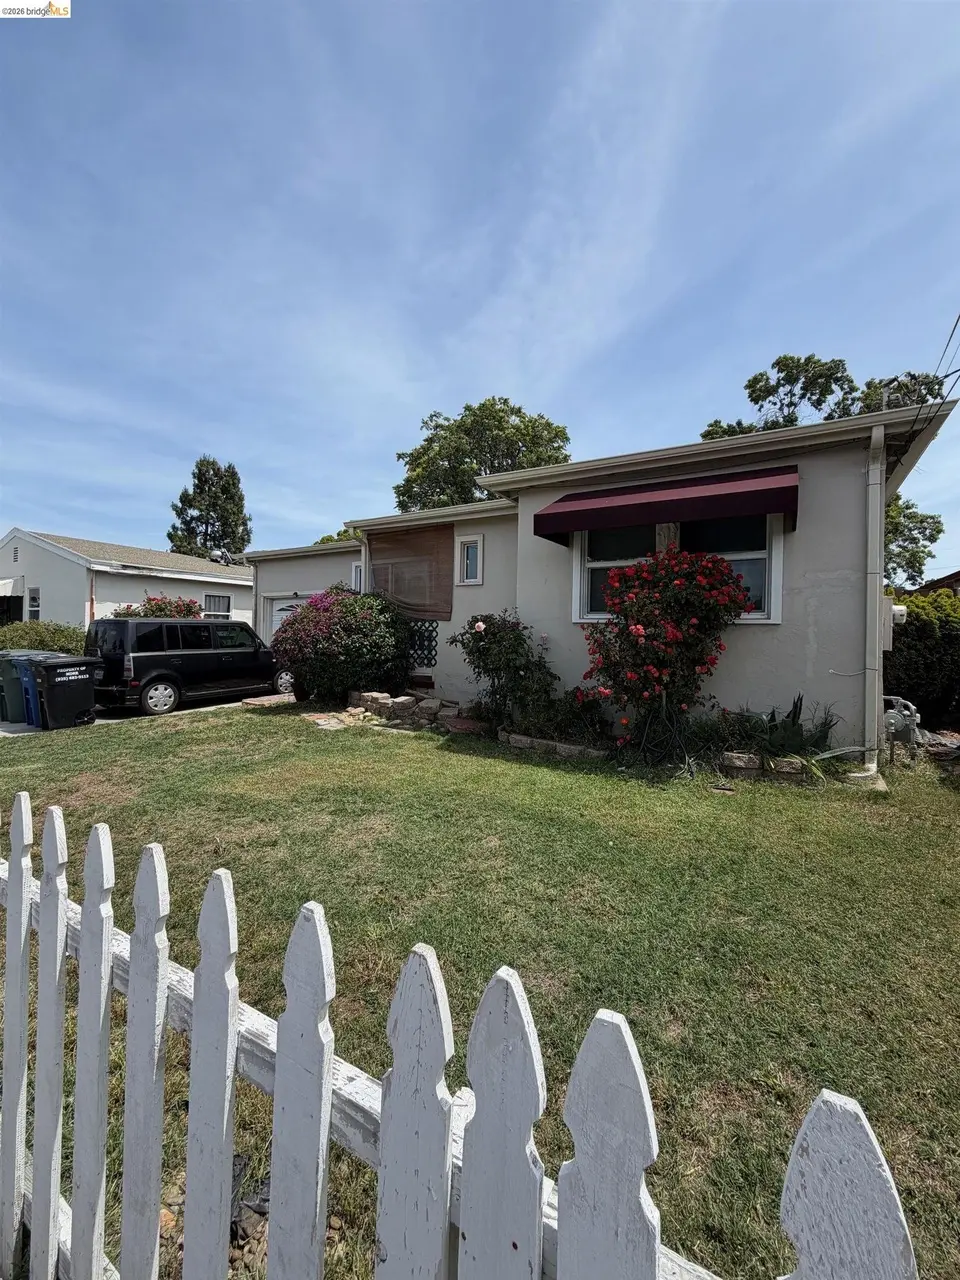
177 Jimno Ave · Pittsburg, CA
Flood risk 1/10 · Minimal
- FEMA flood zone
- X (unshaded)
- Chance of flooding over 30 yrs
- 0.0%
- Est. flood insurance / yr
- $507 – $1,088
Fire risk 6/10 · Moderate
- Est. fire insurance / yr
- $659 – $1,223
Heat risk 5/10 · Moderate
- Hot days now (above 97°F)
- 7 days/yr
- Hot days in 30 yrs
- 15 days/yr
Wind risk 1/10 · Minimal
- Chance of severe wind over 30 yrs
- —
Air-quality risk 8/10 · Major
- Unhealthy air days now
- 14 days/yr
- Unhealthy air days in 30 yrs
- 14 days/yr
Risk factors via First Street. Map © Google.
Why this score? — see what drove the D grade
The composite is a weighted blend of 9 inputs, each scored 0–100. Each bar is that input's sub-score; the figure is the points it added to the 100-point composite (weight × sub-score).
- ARV discount +15.0/15.0
- Cash flow +10.2/30.0
- DSCR +2.9/10.0
- Livability +2.9/5.0
- Rent growth +2.8/5.0
- Schools +2.8/10.0
- Condition / age +2.5/5.0
- 1% rule +2.2/10.0
- Appreciation +0.0/10.0
$319,900
🖨 Deal sheet (PDF) 📄 Offer letter ✓ Due diligence
Listing remarks
Probate sale with no court approval required. This property offers a strong opportunity for investors or contractors ready to take on a full renovation. The home is in distressed condition and has been partially gutted, including the kitchen and all doors which have been completely removed. Significant work is needed throughout, including installation of a new kitchen, bathroom updates, flooring, interior paint, doors, casings, trim, and exterior landscaping. Property is being sold strictly as-is with no repairs or credits. Due to condition, this will not qualify for traditional financing. Cash offers only.
Key facts
- New kitchen
- Interior paint
- Full renovation
Tags
Property features AI
Exterior
- Parking: Attached garage (1 covered space, 1 garage space)
- Utilities: Public water; Public sewer
- Home design: Single family residence; Residential property; Built in 1950
- Construction: Stucco exterior
- Exterior features: Front yard; Back yard
Interior
- Kitchen: No kitchen features listed
- Bedrooms: 2 bedrooms (street level)
- Flooring: Wood flooring
- Bathrooms: 1 full bathroom
- Heating & cooling: Wall furnace heating
- Interior features: No additional rooms; Main entry
- Laundry & utility: Washer/dryer hookups only
Neighborhood map
What this means for you Summary
Snapshot
- This is a 2-bed/1.0-bath single-family listed at $320k.
Deal economics
- At list price, monthly cash flow is $-183 ($-2k/yr) — negative.
- To cash-flow at today's rent, offer at most $288k (10.1% below list).
- To meet the 1% rule (rent ≥ 1% of price), the offer needs to be $231k (27.9% below list).
- Recommended offer: $231k (27.9% below list) — sets the bar for 1% rule.
- Cap rate 5.6% vs local median 3.4% in Pittsburg — top-decile yield for the area; either an underpriced asset or a hidden risk that comps aren't pricing in. Stress-test before assuming the spread holds.
Location & tenants
- Location reads 58/100 on livability (#687 in CA) — a working-class tenant base; expect higher turnover. Strengths: employment A+, housing A+; Watch: schools F, crime D-, amenities F.
- Pittsburg Unified (suburban): math 21% / reading 35% proficiency, ranked #1,069 of 1,400 in CA (top 76%) — low school quality limits family demand, transient renter base, plan for 1-2y turnover; 66% free/reduced lunch — lower-income household profile, screen leases tightly.
- Market conditions: Rents rising (+1.1%/yr); 271 active listings in the ZIP; 18 comparable units currently listed for rent nearby; rentals at typical pace (median 20d on market — plan ~3-4 weeks tenant-placement turnaround); solid renter incomes; 2,169 units permitted in Contra Costa County in 2024 (896 in 5+ unit buildings).
Forward outlook
- Local home prices are declining (-3.0%/yr); year-one equity from $2k of loan paydown is wiped out by about $10k of value loss. Plan a longer hold.
- Contra Costa County population projected at +26% by 2050 — long-run rental-demand tailwind backs the buy-and-hold thesis.
Negotiation context
- Only 8 days on market — expect competitive offers; lowballing is unlikely to land.
Risks & watch-outs
- Watch-outs: built in 1950 — expect roof / HVAC / electrical / plumbing capex.
- Climate carrying-cost: major wildfire risk; extreme-heat days projected 7→15/yr by 2055 (HVAC capex compounding) — expect insurance premiums to compound above CPI over the hold.
Questions for the listing agent
- What do current leases actually rent for vs. the listed asking? Can we see a recent rent roll and the last 12 months of T-12 income?
- Built in 1950 — when were the roof, HVAC, electrical panel, plumbing, and water heater last replaced?
- Is there a deadline driving the sale (1031 exchange, divorce, estate, relocation)? That informs how much negotiation room exists.
- Schools are F-rated, which usually means shorter tenancies and higher turnover. Who's the typical renter profile here, and what's been the actual vacancy rate?
- Crime grade is D in this area — have there been break-ins, vandalism, or insurance claims at this property in the last 3 years? What carrier currently insures it and at what premium?
- The area grade is low — what's the realistic commute time and amenity access for the typical tenant pool here? Any planned neighborhood developments (good or bad) we should know about?
- What's the average days-on-market for RENTAL listings here right now (not sales)? A rising rental-DOM trend means longer vacancies and softer asking-rent achievability than the comps imply.
- What's the recent tenant-quality profile in this submarket — average credit score on applications, eviction rate, late-payment / NSF rate, and stable-employment percentage? A property-management company in the area should have these aggregated.
- How much new for-sale + rental construction is in the pipeline within 1–3 miles? Heavy new supply typically softens prices + rents 12–24 months out; constrained supply supports both.
Investment metrics
- 1% rule
- 0.72% ✗
- Cap rate
- 5.61%
- Cash-on-cash
- -2.45%
- DSCR
- 0.89
- GRM
- 11.6
CMA / ARV
- ARV (median comp)
- $484,936
- List price
- $319,900
- Delta
- -34.03%
- Verdict
- UNDERPRICED
- Comps
- 20 within 1.0 mi
Show comp detail 12 sales within ~0.75 mi
| Address | Dist | Beds/Ba | Sqft | Sold | Price | $/sf | Match |
|---|---|---|---|---|---|---|---|
| 124 Jimno Ave | 0.05mi | 2/1.0 | 898 (0%) | 10mo | $468,000 | $521 | 90 |
| 339 Dimaggio Ave | 0.21mi | 2/1.0 | 882 (-2%) | 2mo | $480,000 | $544 | 86 |
| 182 Dimaggio Ave | 0.03mi | 2/2.0 | 898 (0%) | 11mo | $485,000 | $540 | 86 |
| 52 Rose Ann Ave | 0.12mi | 3/1.0 (+1) | 955 (+6%) | 5mo | $515,000 | $539 | 75 |
| 226 W 9th St | 0.58mi | 2/1.0 | 908 (+1%) | 1mo | $275,000 | $303 | 71 |
| 56 Parkside Ln | 0.35mi | 2/1.0 | 863 (-4%) | 13mo | $460,000 | $533 | 66 |
| 266 Warren Way | 0.25mi | 3/1.0 (+1) | 964 (+7%) | 10mo | $440,000 | $456 | 63 |
| 860 W 17th St | 0.25mi | 3/1.0 (+1) | 964 (+7%) | 11mo | $500,000 | $519 | 62 |
| 65 Locust Dr | 0.41mi | 2/1.0 | 826 (-8%) | 8mo | $442,000 | $535 | 60 |
| 2 Salisbury Dr | 0.59mi | 3/1.0 (+1) | 1,020 (+14%) | 6mo | $495,500 | $486 | 40 |
| 83 Asbury Way | 0.70mi | 3/2.0 (+1) | 1,020 (+14%) | 5mo | $519,000 | $509 | 31 |
| 157 Arlington Dr | 0.67mi | 3/2.0 (+1) | 1,020 (+14%) | 9mo | $510,000 | $500 | 30 |
Match score weights: distance 35% · size 25% · config 20% · recency 20%. Top-matched comps best support the ARV.
Projected returns pro-forma
-3.0% appreciation · 1.11% rent growth · sell at horizon
- IRR
- -22.3%
- Equity multiple
- 0.24×
- Total profit
- $-67,881
- Equity at exit
- $47,698
- IRR
- -21.4%
- Equity multiple
- -0.02×
- Total profit
- $-91,488
- Equity at exit
- $27,659
Cash invested: $89,572 (down + closing). Projections, not guarantees.
Landlord ↔ Tenant lean methodology
- Overall (STATE)
- 18 Strongly Tenant-Friendly
- State California
- 18 Strongly Tenant-Friendly · D+13
- County
- — inherits STATE
- City
- — inherits STATE
ZIP-level market 94565
- Rents YoY
- 1.1%
- Active inventory
- 271
- Price-to-rent
- 11.6×
Monthly cashflow live
- Estimated rent
- $2,307 high interval (Pro) →
- Mortgage (P&I)
- −$1,678
- Tax from tax record
- −$194 /mo · $2,333/yr
- Insurance
- −$133
- HOA
- −$0
- Vacancy / Maint / Mgmt
- −$484
- Net cashflow
- $-183
Break-even live
Sensitivity live
| Price | -10% $-2 | -5% $-92 | +0% $-183 | +5% $-273 | +10% $-364 |
|---|---|---|---|---|---|
| Rent | -10% $-365 | -5% $-274 | +0% $-183 | +5% $-92 | +10% $-1 |
| Rate | -1.0pp $-22 | -0.5pp $-101 | base $-183 | +0.5pp $-266 | +1.0pp $-350 |
UW: 25.0% down · 7.5% · 30yr · 1.5% tax · 5.0% vac · 8.0% maint · 8.0% mgmt
Financing live
Cash to close
- Down payment
- $79,975
- Closing costs
- $9,597
- Reserves months
- —
- Total cash needed
- —
Loan-product check · same deal, 3 products live
Conventional
25% down · 7.5% · 30yr
- Down + closing
- —
- Monthly P&I
- —
- Monthly cashflow
- —
- DSCR
- —
- Eligible?
- —
Personal DTI + credit; lowest rate.
DSCR
20% down · 8.5% · 30yr
- Down + closing
- —
- Monthly P&I
- —
- Monthly cashflow
- —
- DSCR
- —
- Eligible?
- —
No personal income docs; deal must DSCR.
Hard money
10% down · 12.0% · 12mo
- Down + closing
- —
- Monthly P&I
- —
- Monthly cashflow
- —
- DSCR
- —
- Eligible?
- —
Short-term bridge; refi at stabilization.
Rent comps 18 comps
| Address | Beds | Baths | Sqft | Rent | $/sqft | DOM | Units | Dist |
|---|---|---|---|---|---|---|---|---|
| 1249 Beacon St Unit 2 Pittsburg, CA | 2.0 | 1.5 | 900 | $2,500 | $2.78 | 25d | 1 | 0.37mi |
| 505 W 10th St Pittsburg, CA | 1.0–4.0 | 1.0–2.0 | 416 | $2,141 | $5.14 | 6d | 8 | 0.50mi |
| 1010 Power Ave Pittsburg, CA | 1.0–2.0 | 1.0–2.0 | 818 | $2,169 | $2.65 | 4d | 12 | 0.57mi |
| 4 Covington Dr Unit A Pittsburg, CA | 1.0 | 1.0 | 600 | $2,000 | $3.33 | 12d | 1 | 0.61mi |
| 1680 Barrus Ave Pittsburg, CA | 2.0 | 1.0 | 850 | $2,300 | $2.71 | 25d | 1 | 0.74mi |
| 322 E 8th St Pittsburg, CA | 2.0 | 1.0 | 884 | $2,495 | $2.82 | 19d | 1 | 0.78mi |
| 1346 Redwood St Pittsburg, CA | 3.0 | 1.5 | 1066 | $2,915 | $2.73 | 17d | 1 | 0.82mi |
| 535 Central Ave Unit 2 Pittsburg, CA | 1.0 | 1.0 | 700 | $1,795 | $2.56 | 44d | 1 | 0.83mi |
| 461 E 9th St Unit 461 Pittsburg, CA | 2.0 | 1.0 | 875 | $2,100 | $2.40 | 0d | 1 | 0.87mi |
| 100 E Leland Rd Pittsburg, CA | 1.0 | 1.0 | 654 | $1,745 | $2.67 | 25d | 1 | 0.93mi |
| 706 E 12th St Pittsburg, CA | 2.0 | 1.0 | 939 | $2,490 | $2.65 | 25d | 1 | 0.97mi |
| 706 E 12th St Pittsburg, CA | 2.0 | 1.0 | 935 | $2,490 | $2.66 | 22d | 1 | 0.97mi |
| 2 Marina Blvd Pittsburg, CA | 1.0 | 1.0 | 660 | $1,841 | $2.79 | 0d | 15 | 1.08mi |
| 1373 Columbia St Pittsburg, CA | 1.0 | 1.0 | 736 | $1,900 | $2.58 | 44d | 1 | 1.14mi |
| 3818 Harbor St Pittsburg, CA | 2.0 | 1.0 | 825 | $2,350 | $2.85 | 4d | 1 | 1.40mi |
| 1128 E Leland Rd Pittsburg, CA | 1.0–2.0 | 1.0 | 758 | $2,245 | $2.96 | 0d | 12 | 1.41mi |
| 110 Dias Cir Pittsburg, CA | 1.0–3.0 | 1.0–2.0 | 819 | $2,385 | $2.91 | 0d | 17 | 1.45mi |
| 4 Meadowbrook Ave Pittsburg, CA | 2.0 | 2.0 | 1122 | $2,600 | $2.32 | 44d | 1 | 1.47mi |
Listing history 5 events
-
2026-05-12status Pending 615-char remark
-
2026-05-12historical Active Under Contract 615-char remark
-
2026-05-04$319,900 Active 615-char remark
-
1993-08-13soldstatus $97,500
-
1989-11-22soldstatus $88,000
ⓘ Source: listings_history table (triggers on properties + properties_extension) + one-shot
backfill from property_details.listing_events for pre-trigger history.
Tax reassessment forecast CA · Resets to sale price
- Current annual tax
- $2,333 · $194/mo
- Projected year-2 tax
- $2,431 · $203/mo
- Expected delta
- +$98/yr (+$8/mo · 4.2%)
ⓘ Screening estimate from a state-policy table — verify with the county assessor before closing.
Climate risk First Street
- Flood 1/10 Low FEMA zone X (unshaded) · 0% chance over 30 yrs
- Wildfire 6/10 Major
- Heat 5/10 Major 7 d/yr ≥97°F today · 15 d/yr by 30 yrs out
- Wind 1/10 Low
- Air quality 8/10 Severe 14 unhealthy d/yr today · 14 by 30 yrs out
Nearby sold comps map
Loading sold comps map…
Walkable amenities ~0.75 mi
Loading nearby amenities…
Taxation est. · year 1
- Rental income
- $27,683
- − Mortgage interest
- −$17,919
- − Property taxes
- −$2,333
- − Insurance
- −$1,600
- − Repairs & maintenance
- −$2,215
- − Management
- −$2,215
- − Depreciation
- −$9,306
- Taxable loss
- −$7,905
- Est. tax savings @ 24.0%
- +$1,897
- After-tax cash flow
- $-297/yr
For passive investors: Depreciation is non-cash, so a rental often shows a tax loss while cash-flowing — sheltering income. Rental losses are passive: they offset passive income freely, and up to $25,000/yr can offset ordinary (W-2) income if you actively participate and your MAGI is under $100k (phasing out to $0 by $150k); unused losses carry forward. On sale, claimed depreciation is recaptured at up to 25%, and gains may owe capital-gains tax (a 1031 exchange can defer both). Figures are a year-1 estimate at your 24.0% rate — not tax advice; consult a CPA.
Schools (NCES district)
- District
- Pittsburg Unified
- NCES district ID
- 0630600
- Math proficiency
- 21% ▲ 1.00%
- Reading proficiency
- 35% ▲ 1.00%
- Median HH income
- $55,872
- Composite
- 27.99/100
- National rank
- #12238
- State rank
- #1069 of 1400 in CA
Livability — Pittsburg
- Score
- 58/100
- State rank
- #687
- US rank
- #20922
Category grades
Schools grade is shown separately in the Schools card above.
Census & demographics
- Census place
- Pittsburg, CA
- County
- Contra Costa County · 1,059,880 people
- City population
- 100,488
- Metro
- San Francisco-Oakland-Berkeley, CA
- Population (ZIP)
- 100,488
- Household income
- $95,556
- Rent vs Own
- Severe rent burden
- 3942.0
Population outlook (Contra Costa County) Hauer SSP2
- Today (2025)
- 1,287,720 people
- By 2030
- 1,364,937 · +6.0%
- By 2040
- 1,506,209 · +17.0%
- By 2050
- 1,624,373 · +26.1%
- By 2075
- 1,853,193 · +43.9%
- By 2100
- 1,901,231 · +47.6%
Race, ethnicity, and origin ACS 2023
- Neighborhood character
- Diverse neighborhood (Simpson 0.70)
- Race & ethnicity
- Hispanic / Latino 48% Two or more races 19% Asian 17% White 16% Black 13% Pacific Islander 1% Native American 1%
- Hispanic origin (detail)
- Mexican 38% Puerto Rican 1%
- Common ancestry
- Italian 1% Russian 1% Lithuanian 1%
- Foreign-born
- 34% · Canada, China, Vietnam
- Languages at home
- 47% English-only · Spanish 37% Tagalog/Filipino 6% Other Indo-European 4%
Political lean MEDSL · Contra Costa
- 2024 margin
- Solid D (+38.0) · D 67.3% · R 29.4% · Other 3.3%
- 2008→2024 swing
- +0.2pp no change · 2008: 37.8pp · 2024: 38.0pp
- All cycles
- 2024: D+38.0 2020: D+45.3 2016: D+43.5 2012: D+33.7 2008: D+37.8
Not yet ingested
- Civics
- —
Market trends
- HPI YoY
- ▼ -478.40%
- Current HPI
- 376.2576
- Rent YoY
- ▲ 1.11%
- Metro
- San Francisco-Oakland-Berkeley, CA
- State GDP YoY
- ▲ 3.21%
- F500 in state
- 116
Industry mix (Fortune 500 HQ in CA)
| Industry | F500 HQs | Revenue |
|---|---|---|
| Technology | 27 | $1,492B |
|
||
| Financial Services | 3 | $174B |
|
||
| Retail | 3 | $44B |
|
||
| Insurance | 3 | $26B |
|
||
| Media / Entertainment | 2 | $115B |
|
||
| Pharmaceuticals / Biotech | 2 | $62B |
|
||
Price history
+286.4% since first listed6 events — show timeline
- 2026-06-03 Sold (Public Records) $340,000 Public Records
- 2026-05-12 Pending — bridgeMLS, Bay East AOR, or Contra Costa AOR
- 2026-05-12 Contingent — bridgeMLS, Bay East AOR, or Contra Costa AOR
- 2026-05-04 Listed $319,900 bridgeMLS, Bay East AOR, or Contra Costa AOR
- 1993-08-13 Sold (Public Records) $97,500 Public Records
- 1989-11-22 Sold (Public Records) $88,000 Public Records
Property tax history
+2.7%/yrLatest (2025): $2,333 · +9.3% YoY. Source: county tax records.
Cash-flow waterfall
monthlySold comps — $/sqft
last 12 mo · ≤1 miLoading sold comps…