 Duplex
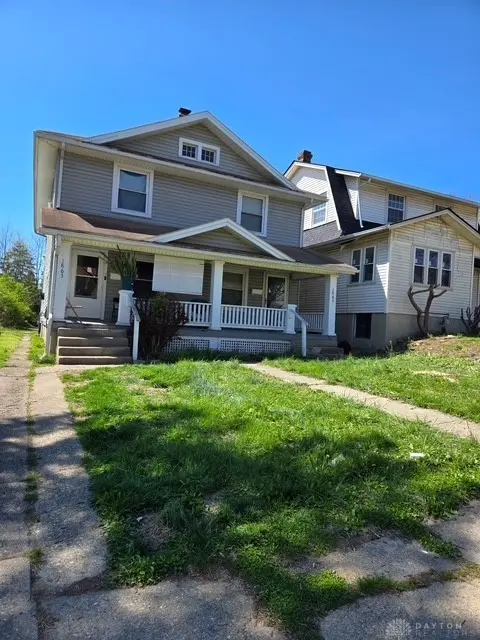
1863-1865 Emerson Ave · Dayton, OH
Flood risk 1/10 · Minimal
- FEMA flood zone
- X (unshaded)
- Chance of flooding over 30 yrs
- 0.0%
- Est. flood insurance / yr
- $473 – $860
Fire risk 1/10 · Minimal
- Est. fire insurance / yr
- $713 – $1,323
Heat risk 3/10 · Minor
- Hot days now (above 104°F)
- 7 days/yr
- Hot days in 30 yrs
- 18 days/yr
Wind risk 2/10 · Minimal
- Chance of severe wind over 30 yrs
- —
Air-quality risk 3/10 · Minor
- Unhealthy air days now
- 2 days/yr
- Unhealthy air days in 30 yrs
- 4 days/yr
Risk factors via First Street. Map © Google.
Why this score? — see what drove the C grade
The composite is a weighted blend of 9 inputs, each scored 0–100. Each bar is that input's sub-score; the figure is the points it added to the 100-point composite (weight × sub-score).
- Cash flow +30.0/30.0
- DSCR +10.0/10.0
- 1% rule +8.0/10.0
- Rent growth +3.3/5.0
- Livability +3.2/5.0
- Condition / age +2.5/5.0
- Schools +1.3/10.0
- ARV discount +0.0/15.0
- Appreciation +0.0/10.0
$155,000
🖨 Deal sheet (PDF) 📄 Offer letter ✓ Due diligence
Multi-family units
County records classify this as Multi-Family (2-4 Unit). Listing-text estimate: 2 units. confirmed
Listing remarks
Discover an investment opportunity in Dayton with this updated, fully occupied duplex, perfectly positioned to offer both immediate income and future growth potential. Each side of this multi-family dwelling features three comfortable bedrooms and a full bathroom, providing ample living space across its two stories. Tenants have established long-term residency, with one side generating $800.00 monthly and the other $900.00 monthly, including the valuable addition of a two-car garage. Both units are currently on month-to-month leases, presenting an excellent opportunity for rental income adjustments and increased profitability in the future. Situated on a generous 0.13-acre lot, this propert
Key facts
- 5,602 sq ft lot
- 2 garage spots
- Built 1926
Property features AI
Finance
- Financial info: Gross rental income listed as $1,700; Offered for sale
Exterior
- Parking: Detached two-car garage
- Home design: Multi-unit property with 2 units in 1 building; 2 stories; Frame construction
- Construction: Frame construction
- Exterior features: Residential lot (approximately 0.13 acres)
Interior
- Bedrooms: Three-bedroom unit(s)
- Bathrooms: 2 full bathrooms (total)
- Heating & cooling: Forced air heating; Window air conditioning units
- Interior features: Full unfinished basement
Neighborhood map
What this means for you Summary
Snapshot
- This is a 2 × 3-bed/1.0-bath units multifamily listed at $155k.
Deal economics
- At list price, monthly cash flow is $606 ($7k/yr) — positive. Per door: $303/mo.
- The deal already cash-flows at list — no discount required.
- Meets the 1% rule at list price ($2k rent vs $155k).
- Recommended offer: $150k (3.0% below list) — sets the bar for market timing.
- Cap rate 11.0% vs local median 7.4% in Dayton — top-decile yield for the area; either an underpriced asset or a hidden risk that comps aren't pricing in. Stress-test before assuming the spread holds.
Location & tenants
- Location reads 65/100 on livability (#716 in OH) — a middle-class / working-renter tenant base. Strengths: cost of living A+, housing A+, health & safety A; Watch: schools C-, amenities C-, crime F.
- Dayton City (urban): math 12% / reading 21% proficiency, ranked #641 of 656 in OH (top 98%) — low school quality limits family demand, transient renter base, plan for 1-2y turnover; 74% free/reduced lunch — lower-income household profile, screen leases tightly.
- Market conditions: Rents rising (+3.0%/yr); 156 active listings in the ZIP; 33 comparable units currently listed for rent nearby; rentals lingering (median 45d on market — plan ~5-8 weeks vacancy on turnover, expect pricing pressure); 55% of comp listings sitting > 30 days — soft ceiling on asking rent; lower-income renter base — watch delinquency; 907 units permitted in Montgomery County in 2024 (416 in 5+ unit buildings).
- At $2,010/mo this rent would consume 58% of the median local household income ($42k/yr) (locally 1504% of renters already pay >50% of income on rent) — very limited rent-growth headroom before tenants either downsize or default.
Forward outlook
- Local home prices are declining (-3.0%/yr); year-one equity from $1k of loan paydown is wiped out by about $5k of value loss. Plan a longer hold.
- Montgomery County population projected at -10% by 2050 — secular population decline; favor cash flow + early exit over multi-decade hold.
- At projected returns (-3.0% appreciation + 3.0% rent growth), your $43k cash investment doubles in ~8 years — after that, you're playing with house money.
Negotiation context
- It's been on market 35 days — a 3% lower offer ($150k) is reasonable based on typical stale-listing flexibility.
- Current owner paid $37k; list at $155k implies a 319% gain — meaningful room to come down on a strong offer.
Risks & watch-outs
- Watch-outs: built in 1926 — expect roof / HVAC / electrical / plumbing capex.
Questions for the listing agent
- It's been on market 35 days. Have you received any prior offers? Is the seller open to a 3% concession, seller financing, or rate buy-down credit?
- Can we see the unit-by-unit rent roll, current vacancy, and any below-market leases? What's the average tenancy length?
- What capital expenditures (roof, boiler, parking lot, exteriors) have been made in the last 5 years, and what's planned in the next 2?
- Built in 1926 — when were the roof, HVAC, electrical panel, plumbing, and water heater last replaced?
- Is there a deadline driving the sale (1031 exchange, divorce, estate, relocation)? That informs how much negotiation room exists.
- Crime grade is F in this area — have there been break-ins, vandalism, or insurance claims at this property in the last 3 years? What carrier currently insures it and at what premium?
- What's the average days-on-market for RENTAL listings here right now (not sales)? A rising rental-DOM trend means longer vacancies and softer asking-rent achievability than the comps imply.
- What's the recent tenant-quality profile in this submarket — average credit score on applications, eviction rate, late-payment / NSF rate, and stable-employment percentage? A property-management company in the area should have these aggregated.
- How much new apartment / multifamily construction is in the pipeline within 1–3 miles? Heavy new supply (>2% of stock underway) typically softens rents 12–24 months out; light construction supports rent growth.
Investment metrics
- 1% rule
- 1.30% ✓
- Cap rate
- 10.99%
- Cash-on-cash
- 16.76%
- DSCR
- 1.75
- GRM
- 6.4
CMA / ARV
- ARV (median comp)
- $114,097
- List price
- $155,000
- Delta
- 35.85%
- Verdict
- OVERPRICED
- Comps
- 20 within 1.0 mi
Show comp detail 4 sales within ~0.75 mi
| Address | Dist | Beds/Ba | Sqft | Sold | Price | $/sf | Match |
|---|---|---|---|---|---|---|---|
| 1263 Linda Vista Ave | 0.40mi | 4/2.0 | 1,944 (-1%) | 24mo | $110,000 | $57 | 61 |
| 960 Sherwood Dr | 0.63mi | 4/2.0 | 2,080 (+6%) | 8mo | $145,000 | $70 | 53 |
| 10 Marie Ave | 0.37mi | 4/2.0 | 2,200 (+12%) | 16mo | $179,000 | $81 | 49 |
| 605 Delaware Ave | 0.54mi | 5/3.0 (+1) | 2,240 (+14%) | 5mo | $180,000 | $80 | 37 |
Match score weights: distance 35% · size 25% · config 20% · recency 20%. Top-matched comps best support the ARV.
Projected returns pro-forma
-3.0% appreciation · 3.03% rent growth · sell at horizon
- IRR
- 8.0%
- Equity multiple
- 1.31×
- Total profit
- $13,532
- Equity at exit
- $23,111
- IRR
- 17.2%
- Equity multiple
- 2.42×
- Total profit
- $61,652
- Equity at exit
- $13,402
Cash invested: $43,400 (down + closing). Projections, not guarantees.
Landlord ↔ Tenant lean methodology
- Overall (STATE)
- 73 Landlord-Friendly
- State Ohio
- 73 Landlord-Friendly · R+6
- County
- — inherits STATE
- City
- — inherits STATE
ZIP-level market 45406
- Rents YoY
- 3.0%
- Active inventory
- 156
- Price-to-rent
- 12.9×
Monthly cashflow live
- Estimated rent
- $2,010 high interval (Pro) →
- Mortgage (P&I)
- −$813
- Tax from tax record
- −$104 /mo · $1,251/yr
- Insurance
- −$65
- HOA
- −$0
- Vacancy / Maint / Mgmt
- −$422
- Net cashflow
- $606
Break-even live
Sensitivity live
| Price | -10% $694 | -5% $650 | +0% $606 | +5% $562 | +10% $519 |
|---|---|---|---|---|---|
| Rent | -10% $447 | -5% $527 | +0% $606 | +5% $686 | +10% $765 |
| Rate | -1.0pp $684 | -0.5pp $646 | base $606 | +0.5pp $566 | +1.0pp $525 |
2-unit breakdown (identical units grouped — click to expand)
| Units | Beds | Baths | Est. rent |
|---|---|---|---|
| 2× units | 3 | 1 | $2,010 |
| #1 | 3 | 1 | $1,005 |
| #2 | 3 | 1 | $1,005 |
| Total (2 units) | $2,010 | ||
UW: 25.0% down · 7.5% · 30yr · 1.5% tax · 5.0% vac · 8.0% maint · 8.0% mgmt
Financing live
Cash to close
- Down payment
- $38,750
- Closing costs
- $4,650
- Reserves months
- —
- Total cash needed
- —
Loan-product check · same deal, 3 products live
Conventional
25% down · 7.5% · 30yr
- Down + closing
- —
- Monthly P&I
- —
- Monthly cashflow
- —
- DSCR
- —
- Eligible?
- —
Personal DTI + credit; lowest rate.
DSCR
20% down · 8.5% · 30yr
- Down + closing
- —
- Monthly P&I
- —
- Monthly cashflow
- —
- DSCR
- —
- Eligible?
- —
No personal income docs; deal must DSCR.
Hard money
10% down · 12.0% · 12mo
- Down + closing
- —
- Monthly P&I
- —
- Monthly cashflow
- —
- DSCR
- —
- Eligible?
- —
Short-term bridge; refi at stabilization.
Rent comps 33 comps
| Address | Beds | Baths | Sqft | Rent | $/sqft | DOM | Units | Dist |
|---|---|---|---|---|---|---|---|---|
| 1743 Radcliffe Rd Dayton, OH | 3.0 | 1.5 | 1729 | $1,200 | $0.69 | 44d | 1 | 0.21mi |
| 439 W Fairview Ave Dayton, OH | 3.0 | 1.0 | 1500 | $1,200 | $0.80 | 44d | 1 | 0.25mi |
| 2232 Salem Ave Dayton, OH | 3.0 | 1.0 | 1250 | $1,200 | $0.96 | 4d | 1 | 0.30mi |
| 2247 Salem Ave Unit 2247 Dayton, OH | 3.0 | 1.5 | 1300 | $1,350 | $1.04 | 4d | 1 | 0.32mi |
| 2247 Salem Ave Unit 2249 Dayton, OH | 3.0 | 1.5 | 1300 | $1,400 | $1.08 | 44d | 1 | 0.32mi |
| 201 W Norman Ave Dayton, OH | 3.0 | 1.0 | 1424 | $1,200 | $0.84 | 44d | 1 | 0.35mi |
| 181 W Norman Ave Dayton, OH | 3.0 | 2.0 | 1228 | $1,150 | $0.94 | 44d | 1 | 0.37mi |
| 167 W Hudson Ave Dayton, OH | 3.0 | 1.5 | 1344 | $1,185 | $0.88 | 44d | 1 | 0.40mi |
| 1927 Burroughs Dr Dayton, OH | 3.0 | 2.0 | 1409 | $1,245 | $0.88 | 15d | 1 | 0.47mi |
| 234 Santa Clara Ave Dayton, OH | 3.0 | 1.0 | 1368 | $1,125 | $0.82 | 44d | 1 | 0.48mi |
| 101 W Norman Ave Unit 101 Dayton, OH | 3.0 | 1.0 | 1600 | $945 | $0.59 | 44d | 1 | 0.52mi |
| 41 W Fairview Ave Unit 2 Dayton, OH | 3.0 | 1.0 | 1452 | $1,200 | $0.83 | 15d | 1 | 0.60mi |
| 26 W Beechwood Ave Dayton, OH | 3.0 | 1.5 | 1468 | $1,050 | $0.72 | 44d | 1 | 0.65mi |
| 1225 Amherst Pl Dayton, OH | 3.0 | 1.0 | 1548 | $1,300 | $0.84 | 15d | 1 | 0.67mi |
| 2141 Philadelphia Dr Dayton, OH | 3.0 | 1.0 | 1736 | $1,395 | $0.80 | 44d | 1 | 0.69mi |
| 39 E Maplewood Ave Dayton, OH | 4.0 | 1.5 | 1560 | $1,050 | $0.67 | 4d | 1 | 0.82mi |
| 2327 Eastview Ave Dayton, OH | 5.0 | 1.0 | 1290 | $1,300 | $1.01 | 44d | 1 | 0.83mi |
| 42 Pointview Ave Unit 42 Dayton, OH | 3.0 | 2.0 | 1240 | $1,200 | $0.97 | 4d | 1 | 0.84mi |
| 942 Harvard Blvd Dayton, OH | 3.0 | 2.0 | 1596 | $1,200 | $0.75 | 4d | 1 | 0.90mi |
| 932 Harvard Blvd Dayton, OH | 5.0 | 2.0 | 1986 | $1,500 | $0.76 | 44d | 1 | 0.90mi |
| 338 Kenwood Ave Dayton, OH | 3.0 | 1.5 | 1512 | $1,195 | $0.79 | 44d | 1 | 0.92mi |
| 101 E Bruce Ave Dayton, OH | 3.0 | 1.0 | 1455 | $1,150 | $0.79 | 3d | 1 | 0.99mi |
| 1501 Viola Ave Dayton, OH | 3.0 | 1.0 | 1952 | $1,175 | $0.60 | 15d | 1 | 1.02mi |
| 253 E Hillcrest Ave Dayton, OH | 3.0 | 2.5 | 2569 | $1,800 | $0.70 | 3d | 1 | 1.04mi |
| 424 Lexington Ave Dayton, OH | 3.0 | 2.0 | 1536 | $1,025 | $0.67 | 44d | 1 | 1.06mi |
| 132 Wroe Ave Unit 132 Dayton, OH | 3.0 | 2.5 | 1934 | $1,297 | $0.67 | 44d | 1 | 1.08mi |
| 317 Fernwood Ave Dayton, OH | 3.0 | 1.0 | 1320 | $1,100 | $0.83 | 12d | 1 | 1.12mi |
| 1011 N Broadway St Dayton, OH | 3.0 | 1.5 | 1700 | $950 | $0.56 | 44d | 1 | 1.15mi |
| 138 Rockwood Ave Dayton, OH | 3.0 | 1.5 | 1439 | $1,200 | $0.83 | 24d | 1 | 1.19mi |
| 136 Rockwood Ave Dayton, OH | 3.0 | 1.5 | 1439 | $1,200 | $0.83 | 44d | 1 | 1.19mi |
| 1119 Superior Ave Unit 1119 Dayton, OH | 3.0 | 1.0 | 1435 | $1,350 | $0.94 | 4d | 1 | 1.20mi |
| 1045 Shakespeare Ave Dayton, OH | 3.0 | 1.0 | 1435 | $1,275 | $0.89 | 44d | 1 | 1.22mi |
| 534 Geyer St Dayton, OH | 4.0 | 1.0 | 1640 | $1,530 | $0.93 | 24d | 1 | 1.40mi |
Listing history 18 events
-
2026-06-18days on market $155,000 Active 35 DOM
-
2026-06-17days on market $155,000 Active 34 DOM
-
2026-06-16pricedays on market $155,000 Active 33 DOM
-
2026-06-15days on market $165,000 Active 32 DOM
-
2026-06-14days on market $165,000 Active 30 DOM
-
2026-06-13days on market $165,000 Active 29 DOM
-
2026-06-10days on market $165,000 Active 27 DOM
-
2026-06-09days on market $165,000 Active 26 DOM
-
2026-06-08days on market $165,000 Active 25 DOM
-
2026-06-07days on market $165,000 Active 24 DOM
-
2026-06-05days on market $165,000 Active 21 DOM
-
2026-06-03days on market $165,000 Active 20 DOM
-
2026-06-02days on market $165,000 Active 19 DOM
-
2026-06-01days on market $165,000 Active 18 DOM
-
2026-05-31days on market $165,000 Active 17 DOM
-
2026-05-13$170,000 Active 865-char remark
-
2022-07-13soldstatus $37,000
-
1993-07-02soldstatus $37,500
ⓘ Source: listings_history table (triggers on properties + properties_extension) + one-shot
backfill from property_details.listing_events for pre-trigger history.
Tax reassessment forecast OH · Partial reset (capped growth)
- Current annual tax
- $1,251 · $104/mo
- Projected year-2 tax
- $1,834 · $153/mo
- Expected delta
- +$584/yr (+$49/mo · 46.7%)
ⓘ Screening estimate from a state-policy table — verify with the county assessor before closing.
Climate risk First Street
- Flood 1/10 Low FEMA zone X (unshaded) · 0% chance over 30 yrs
- Wildfire 1/10 Low
- Heat 3/10 Moderate 7 d/yr ≥104°F today · 18 d/yr by 30 yrs out
- Wind 2/10 Low
- Air quality 3/10 Moderate 2 unhealthy d/yr today · 4 by 30 yrs out
Nearby sold comps map
Loading sold comps map…
Walkable amenities ~0.75 mi
Loading nearby amenities…
Taxation est. · year 1
- Rental income
- $24,120
- − Mortgage interest
- −$8,682
- − Property taxes
- −$1,251
- − Insurance
- −$775
- − Repairs & maintenance
- −$1,930
- − Management
- −$1,930
- − Depreciation
- −$4,509
- Taxable income
- $5,044
- Est. tax owed @ 24.0%
- −$1,210
- After-tax cash flow
- $6,065/yr
For passive investors: Depreciation is non-cash, so a rental often shows a tax loss while cash-flowing — sheltering income. Rental losses are passive: they offset passive income freely, and up to $25,000/yr can offset ordinary (W-2) income if you actively participate and your MAGI is under $100k (phasing out to $0 by $150k); unused losses carry forward. On sale, claimed depreciation is recaptured at up to 25%, and gains may owe capital-gains tax (a 1031 exchange can defer both). Figures are a year-1 estimate at your 24.0% rate — not tax advice; consult a CPA.
Schools (NCES district)
- District
- Dayton City
- NCES district ID
- 3904384
- Math proficiency
- 12% ▼ -12.00%
- Reading proficiency
- 21% ▼ -11.00%
- Median HH income
- $28,688
- Composite
- 12.94/100
- National rank
- #9579
- State rank
- #641 of 656 in OH
Livability — Dayton
- Score
- 65/100
- State rank
- #716
- US rank
- #12895
Category grades
Schools grade is shown separately in the Schools card above.
Census & demographics
- Census place
- Dayton, OH
- County
- Montgomery County · 459,541 people
- City population
- 164,387
- Metro
- Dayton-Kettering, OH
- Population (ZIP)
- 19,991
- Household income
- $41,796
- Rent vs Own
- Severe rent burden
- 1504.0
Population outlook (Montgomery County) Hauer SSP2
- Today (2025)
- 523,241 people
- By 2030
- 514,948 · -1.6%
- By 2040
- 493,378 · -5.7%
- By 2050
- 469,639 · -10.2%
- By 2075
- 418,360 · -20.0%
- By 2100
- 353,315 · -32.5%
Race, ethnicity, and origin ACS 2023
- Neighborhood character
- Predominantly Black (75%)
- Race & ethnicity
- Black 75% White 16% Two or more races 7% Hispanic / Latino 3%
- Common ancestry
- Italian 2% Lithuanian 1% Slovak 1%
- Foreign-born
- 2% · Canada
- Languages at home
- 97% English-only · Spanish 1%
Political lean MEDSL · Montgomery
- 2024 margin
- Toss-up / Even · D 49.8% · R 49.3%
- 2008→2024 swing
- -5.8pp toward R · 2008: 6.2pp · 2024: 0.5pp
- All cycles
- 2024: D+0.5 2020: D+2.2 2016: R+1.2 2012: D+3.1 2008: D+6.2
Not yet ingested
- Civics
- —
Market trends
- HPI YoY
- ▼ -113.75%
- Current HPI
- 197.1302
- Rent YoY
- ▲ 3.03%
- Metro
- Dayton-Kettering, OH
- State GDP YoY
- ▲ 1.98%
- F500 in state
- 48
Industry mix (Fortune 500 HQ in OH)
| Industry | F500 HQs | Revenue |
|---|---|---|
| Insurance | 3 | $145B |
|
||
| Industrial Machinery | 3 | $49B |
|
||
| Financial Services | 3 | $24B |
|
||
| Consumer Goods | 2 | $93B |
|
||
| Aerospace / Defense | 2 | $47B |
|
||
| Utilities | 2 | $33B |
|
||
Price history
+313.3% since first listed5 events — show timeline
- 2026-06-16 Price Changed $155,000 Dayton MLS
- 2026-05-26 Price Changed $165,000 Dayton MLS
- 2026-05-13 Listed $170,000 Dayton MLS
- 2022-07-13 Sold (Public Records) $37,000 Public Records
- 1993-07-02 Sold (Public Records) $37,500 Public Records
Property tax history
+0.4%/yrLatest (2025): $1,251 · -0.2% YoY. Source: county tax records.
Cash-flow waterfall
monthlySold comps — $/sqft
last 12 mo · ≤1 miLoading sold comps…