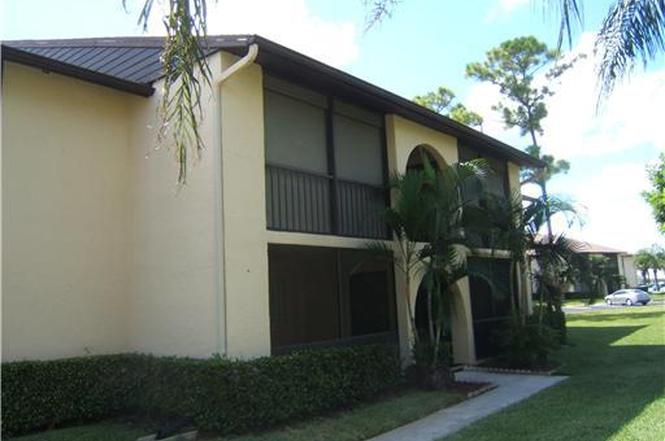
429 Pine Gln Unit C2 · Greenacres, FL
Flood risk 1/10 · Minimal
- FEMA flood zone
- X (unshaded)
- Chance of flooding over 30 yrs
- 0.0%
- Est. flood insurance / yr
- $507 – $1,088
Fire risk 1/10 · Minimal
- Est. fire insurance / yr
- $947 – $1,759
Heat risk 10/10 · Severe
- Hot days now (above 106°F)
- 7 days/yr
- Hot days in 30 yrs
- 28 days/yr
Wind risk 10/10 · Severe
- Chance of severe wind over 30 yrs
- 99.0%
Air-quality risk 2/10 · Minimal
- Unhealthy air days now
- 0 days/yr
- Unhealthy air days in 30 yrs
- 2 days/yr
Risk factors via First Street. Map © Google.
Why this score? — see what drove the C- grade
The composite is a weighted blend of 9 inputs, each scored 0–100. Each bar is that input's sub-score; the figure is the points it added to the 100-point composite (weight × sub-score).
- Cash flow +15.7/30.0
- 1% rule +9.0/10.0
- ARV discount +7.5/15.0
- DSCR +4.8/10.0
- Schools +4.3/10.0
- Livability +3.5/5.0
- Rent growth +2.8/5.0
- Condition / age +2.5/5.0
- Appreciation +0.0/10.0
$138,500
🖨 Deal sheet 📄 Offer letter ✓ Due diligence
Listing remarks
Live in style in an immaculate 2-bedroom homes in all of Pine Ridge! Experience the best of 55+ living in Pine Ridge, a peaceful and friendly community tailored for comfort and ease. This immaculate second-floor 2-bedroom, 1-bathroom condo has been thoughtfully updated and is move-in ready. Inside, you'll find a bright and inviting living space, perfect for relaxing or entertaining. Both bedrooms offer generous closet space and natural light, making them ideal for guests, a home office, or your own small retreat. Step onto the covered balcony to sip your morning coffee or unwind in the evening breeze. Additional features include accordion shutters for added security and storm protection. Th
Key facts
- Covered balcony
- Accordion shutters
- Washer and dryer
Tags
Property features AI
Finance
- Other: Is a senior community
- HOA & community: HOA with monthly fee (includes insurance, grounds maintenance, trash); Association amenities: boating, clubhouse, parking, pool, shuffleboard court, manager on site, sidewalks; Pets allowed (restrictions possible)
Exterior
- Parking: Assigned parking
- Utilities: Public water; Public sewer; Three-phase electric; Sewer available; Water available
- Home design: Condominium; Multi/split levels; 2 total stories; Faces southwest; Resale condition
- Construction: Concrete construction; Composition/shingle roof; Building constructed as unit 429
- Exterior features: Covered patio; Patio
Interior
- Kitchen: Electric range; Refrigerator
- Bedrooms: 2 bedrooms on the main level
- Flooring: Carpet
- Bathrooms: 1 full bathroom on the main level
- Heating & cooling: Central heating; Central electric air conditioning
- Interior features: Walk-in closet(s)
Neighborhood map
What this means for you Summary
Snapshot
- This is a 2-bed/1.0-bath condo listed at $138k.
Deal economics
- At list price, monthly cash flow is $61 ($728/yr) — positive.
- The deal already cash-flows at list — no discount required.
- Meets the 1% rule at list price ($2k rent vs $138k).
- Recommended offer: $122k (12.0% below list) — sets the bar for market timing.
Location & tenants
- Location reads 69/100 on livability (#490 in FL) — a middle-class / working-renter tenant base. Strengths: cost of living A+, housing A+, health & safety A; Watch: employment D, amenities F, commute F.
- Palm Beach (suburban): math 46% / reading 53% proficiency, ranked #34 of 73 in FL (top 47%) — families likely to look elsewhere, expect single-tenant / working-renter base with shorter leases.
- Zoned schools: Heritage Elementary School (math 35% / reading 39%, grade F, #1,609 of 2,144 statewide, top 77%, 786 students, 75% FRL); L C Swain Middle School (math 26% / reading 33%, grade F, #469 of 571 statewide, top 84%, 1,451 students, 74% FRL); Santaluces Community High (math 22% / reading 39%, grade F, #434 of 667 statewide, top 66%, 2,675 students, 61% FRL) — zoned schools average 70% FRL vs 52% district-wide (18 pts higher); higher-poverty schools than district average — tighter screening recommended.
- Zoned-school proficiency averages 32% at this address vs 50% district-wide (-17 pts) — the specific schools serving this property underperform the Palm Beach average; the district grade overstates school quality for this exact location.
- Market conditions: Rents rising (+1.3%/yr); 346 active listings in the ZIP; 40 comparable units currently listed for rent nearby; rentals at typical pace (median 24d on market — plan ~3-4 weeks tenant-placement turnaround); 3,974 units permitted in Palm Beach County in 2024 (1,012 in 5+ unit buildings).
- This rent runs 32% of the median local income ($74k/yr) — at the standard rent-burdened threshold; future hikes will face affordability resistance.
Forward outlook
- Local home prices are declining (-3.0%/yr); year-one equity from $958 of loan paydown is wiped out by about $4k of value loss. Plan a longer hold.
- Palm Beach County population projected at +30% by 2050 — long-run rental-demand tailwind backs the buy-and-hold thesis.
Negotiation context
- It's been on market 312 days — a 12% lower offer ($122k) is reasonable based on typical stale-listing flexibility.
- 5 sale attempts since 15y ago; this cycle's ask is 8294% above the opening price — seller raised mid-cycle; expect resistance to lowballs.
- Current owner paid $30k; list at $138k implies a 362% gain — meaningful room to come down on a strong offer.
Risks & watch-outs
- Watch-outs: HOA is 26% of rent.
- Climate carrying-cost: severe wind risk, 99% chance of damaging wind over 30y; extreme-heat days projected 7→28/yr by 2055 (HVAC capex compounding) — expect insurance premiums to compound above CPI over the hold.
Questions for the listing agent
- It's been on market 312 days. Have you received any prior offers? Is the seller open to a 12% concession, seller financing, or rate buy-down credit?
- What does the HOA fee cover, when was the last increase, and are there any pending special assessments or reserve-fund shortfalls?
- Any open or pending special assessments — roof, HVAC, plumbing, elevator, façade? What's the per-unit balance and payoff schedule, and is the seller paying it off at close or rolling it to the buyer?
- Why hasn't it sold? Are there any deal-killer items the seller is aware of (foundation, flood, title, zoning, code violations)?
- Is there a deadline driving the sale (1031 exchange, divorce, estate, relocation)? That informs how much negotiation room exists.
- Schools are D-rated, which usually means shorter tenancies and higher turnover. Who's the typical renter profile here, and what's been the actual vacancy rate?
- What's the average days-on-market for RENTAL listings here right now (not sales)? A rising rental-DOM trend means longer vacancies and softer asking-rent achievability than the comps imply.
- What's the recent tenant-quality profile in this submarket — average credit score on applications, eviction rate, late-payment / NSF rate, and stable-employment percentage? A property-management company in the area should have these aggregated.
- How much new apartment / multifamily construction is in the pipeline within 1–3 miles? Heavy new supply (>2% of stock underway) typically softens rents 12–24 months out; light construction supports rent growth.
Investment metrics
- 1% rule
- 1.40% ✓
- Cap rate
- 6.82%
- Cash-on-cash
- 1.88%
- DSCR
- 1.08
- GRM
- 5.9
CMA / ARV
No comps found within radius.
Projected returns pro-forma
-3.0% appreciation · 1.33% rent growth · sell at horizon
- IRR
- -15.9%
- Equity multiple
- 0.45×
- Total profit
- $-21,448
- Equity at exit
- $20,651
- IRR
- -12.1%
- Equity multiple
- 0.35×
- Total profit
- $-25,045
- Equity at exit
- $11,975
Cash invested: $38,780 (down + closing). Projections, not guarantees.
Landlord ↔ Tenant lean methodology
- Overall (STATE)
- 87 Strongly Landlord-Friendly
- State Florida
- 87 Strongly Landlord-Friendly · R+3
- County
- — inherits STATE
- City
- — inherits STATE
ZIP-level market 33463
- Home prices YoY
- -30.9%
- Rents YoY
- 1.3%
- Active inventory
- 346
- Price-to-rent
- 5.9×
Monthly cashflow live
- Estimated rent
- $1,945 high interval (Pro) →
- Mortgage (P&I)
- −$726
- Tax from tax record
- −$193 /mo · $2,312/yr
- Insurance
- −$58
- HOA
- −$499
- Vacancy / Maint / Mgmt
- −$408
- Net cashflow
- $61
Break-even live
UW: 25.0% down · 7.5% · 30yr · 1.5% tax · 5.0% vac · 8.0% maint · 8.0% mgmt
Financing live
Cash to close
- Down payment
- $34,625
- Closing costs
- $4,155
- Reserves months
- —
- Total cash needed
- —
Loan-product check · same deal, 3 products live
Conventional
25% down · 7.5% · 30yr
- Down + closing
- —
- Monthly P&I
- —
- Monthly cashflow
- —
- DSCR
- —
- Eligible?
- —
Personal DTI + credit; lowest rate.
DSCR
20% down · 8.5% · 30yr
- Down + closing
- —
- Monthly P&I
- —
- Monthly cashflow
- —
- DSCR
- —
- Eligible?
- —
No personal income docs; deal must DSCR.
Hard money
10% down · 12.0% · 12mo
- Down + closing
- —
- Monthly P&I
- —
- Monthly cashflow
- —
- DSCR
- —
- Eligible?
- —
Short-term bridge; refi at stabilization.
Rent comps 40 comps
| Address | Beds | Baths | Sqft | Rent | $/sqft | DOM | Units | Dist |
|---|---|---|---|---|---|---|---|---|
| 429 Pine Glen Ln Unit C2 Greenacres, FL | 2.0 | 1.0 | 804 | $1,650 | $2.05 | 24d | 1 | 0.03mi |
| 417 Pine Glen Ln Unit D2 Greenacres, FL | 2.0 | 2.0 | 922 | $1,550 | $1.68 | 24d | 1 | 0.10mi |
| 417 Pine Glen Ln Unit C2 Greenacres, FL | 2.0 | 2.0 | 922 | $1,800 | $1.95 | 24d | 1 | 0.10mi |
| 407 Pine Cir Unit C1 Greenacres, FL | 2.0 | 2.0 | 922 | $1,800 | $1.95 | 24d | 1 | 0.14mi |
| 407 Pine Cir Unit B1 Greenacres, FL | 2.0 | 2.0 | 922 | $1,750 | $1.90 | 24d | 1 | 0.14mi |
| 443 Pine Glen Ln Unit B2 Greenacres, FL | 2.0 | 2.0 | 922 | $1,500 | $1.63 | 24d | 1 | 0.16mi |
| 408 Pine Glen Ln Unit C-2 Greenacres, FL | 2.0 | 1.0 | 804 | $1,600 | $1.99 | 24d | 1 | 0.17mi |
| 446 Pine Glen Ln Unit A1 Greenacres, FL | 1.0 | 1.0 | 614 | $1,550 | $2.52 | 15d | 1 | 0.20mi |
| 4535 Oak Terrace Dr Greenacres, FL | 3.0 | 2.0 | 1061 | $2,400 | $2.26 | 12d | 1 | 0.29mi |
| 4535 Oak Terrace Dr Greenacres, FL | 3.0 | 2.0 | 1061 | $2,500 | $2.36 | 15d | 1 | 0.29mi |
| 4838 Esedra Ct Lake Worth, FL | 1.0 | 1.0 | 804 | $1,550 | $1.93 | 24d | 2 | 0.33mi |
| 4832 Esedra Ct Lake Worth, FL | 1.0–3.0 | 1.0–2.0 | 1026 | $1,650 | $1.61 | 3d | 2 | 0.36mi |
| 4801 Esedra Ct Lake Worth, FL | 2.0 | 2.0 | 1027 | $2,075 | $2.02 | 11d | 2 | 0.37mi |
| 4801 Esedra Ct #201 Lake Worth, FL | 2.0 | 2.0 | 1005 | $2,300 | $2.29 | 24d | 1 | 0.37mi |
| 5905 Triphammer Rd Lake Worth, FL | 2.0 | 2.0 | 1020 | $3,000 | $2.94 | 24d | 1 | 0.39mi |
| 4243 Oak Terrace Dr #4243 Greenacres, FL | 2.0 | 2.0 | 883 | $1,950 | $2.21 | 24d | 1 | 0.43mi |
| 4245 Oak Terrace Dr Greenacres, FL | 2.0 | 2.0 | 883 | $2,000 | $2.27 | 24d | 1 | 0.43mi |
| 104 Lake Pine Cir Unit A1 Greenacres, FL | 2.0 | 2.0 | 937 | $2,050 | $2.19 | 24d | 1 | 0.44mi |
| 4259 Oak Terrace Dr Greenacres, FL | 2.0 | 2.0 | 883 | $1,900 | $2.15 | 24d | 1 | 0.45mi |
| 4185 Oak Terrace Dr Greenacres, FL | 2.0 | 2.0 | 883 | $1,850 | $2.10 | 22d | 1 | 0.46mi |
| 4221 Oak Terrace Dr Greenacres, FL | 2.0 | 2.0 | 883 | $1,900 | $2.15 | 24d | 1 | 0.47mi |
| 102 Lake Pine Cir Unit A2 Greenacres, FL | 2.0 | 1.0 | 937 | $1,500 | $1.60 | 24d | 1 | 0.47mi |
| 4254 Deste Ct #305 Greenacres, FL | 1.0 | 1.0 | 716 | $1,500 | $2.09 | 24d | 1 | 0.49mi |
| 4121 Oak Terrace Dr Greenacres, FL | 2.0 | 2.0 | 883 | $1,950 | $2.21 | 24d | 1 | 0.50mi |
| 4101 Oak Terrace Dr Greenacres, FL | 2.0 | 2.0 | 883 | $1,850 | $2.10 | 11d | 1 | 0.51mi |
| 4266 Deste Ct #107 Greenacres, FL | 2.0 | 2.0 | 978 | $2,100 | $2.15 | 24d | 1 | 0.52mi |
| 121 Lake Pine Cir Unit A2 Greenacres, FL | 2.0 | 1.0 | 818 | $1,600 | $1.96 | 24d | 1 | 0.53mi |
| 105 Lake Pine Cir Unit B2 Greenacres, FL | 2.0 | 2.0 | 937 | $2,000 | $2.13 | 24d | 1 | 0.53mi |
| 4657 Fountains Dr S #206 Lake Worth, FL | 1.0 | 1.0 | 882 | $1,650 | $1.87 | 12d | 1 | 0.54mi |
| 133 Lake Pine Cir Unit B1 Greenacres, FL | 1.0 | 1.0 | 639 | $1,450 | $2.27 | 24d | 1 | 0.58mi |
| 133 Lake Pine Cir Greenacres, FL | 1.0 | 1.0 | 639 | $1,300 | $2.03 | 18d | 1 | 0.58mi |
| 4242 Deste Ct Unit 208 Greenacres, FL | 2.0 | 2.0 | 978 | $2,500 | $2.56 | 24d | 1 | 0.59mi |
| 6615 Waterfront Xing Lake Worth, FL | 1.0–3.0 | 1.0–2.0 | 1087 | $2,864 | $2.63 | 2d | 22 | 0.61mi |
| 231 Pine Hov Cir Unit A1 Greenacres, FL | 1.0 | 1.0 | 818 | $1,650 | $2.02 | 24d | 1 | 0.64mi |
| 4236 Deste Ct #108 Greenacres, FL | 1.0 | 1.0 | 716 | $1,800 | $2.51 | 17d | 1 | 0.65mi |
| 4284 Deste Ct #304 Greenacres, FL | 1.0 | 1.0 | 716 | $2,200 | $3.07 | 17d | 1 | 0.69mi |
| 4539 Luxemburg Ct Lake Worth, FL | 2.0 | 2.0 | 1005 | $2,250 | $2.24 | 24d | 1 | 0.69mi |
| 4539 Luxemburg Ct Lake Worth, FL | 2.0 | 2.0 | 1027 | $2,250 | $2.19 | 5d | 1 | 0.69mi |
| 211 Pine Hov Cir Unit D2 Greenacres, FL | 2.0 | 2.0 | 924 | $1,850 | $2.00 | 24d | 1 | 0.70mi |
| 4489 Luxemburg Ct #101 Lake Worth, FL | 2.0 | 2.0 | 1005 | $2,000 | $1.99 | 24d | 1 | 0.70mi |
HOA detail condo
- Monthly dues
- $499 · $5,988/yr
- Likely covers
- security
- Assessments
- None detected in remarks — confirm with the listing agent.
Listing history 13 events
-
2026-04-10$1,650
-
2026-03-31historical $1,650
-
2026-03-02price $138,500
-
2026-01-12$1,650
-
2026-01-12historical $1,650
-
2026-01-10$1,650
-
2025-11-10price $139,900
-
2025-09-29price $149,990
-
2025-07-18$149,999 Active
-
2012-03-09soldstatus $30,000
-
2012-02-10historical
-
2011-09-16$33,900
-
1982-03-01soldstatus $43,800
ⓘ Source: listings_history table (triggers on properties + properties_extension) + one-shot
backfill from property_details.listing_events for pre-trigger history.
Tax reassessment forecast FL · Resets to sale price
- Current annual tax
- $2,312 · $193/mo
- Projected year-2 tax
- $2,312 · $193/mo
- Expected delta
- $0/yr ($0/mo · 0.0%)
ⓘ Screening estimate from a state-policy table — verify with the county assessor before closing.
Climate risk First Street
- Flood 1/10 Low FEMA zone X (unshaded) · 0% chance over 30 yrs
- Wildfire 1/10 Low
- Heat 10/10 Extreme 7 d/yr ≥106°F today · 28 d/yr by 30 yrs out
- Wind 10/10 Extreme 99% chance of damaging wind over 30 yrs
- Air quality 2/10 Low 0 unhealthy d/yr today · 2 by 30 yrs out
Nearby sold comps map
Loading sold comps map…
Walkable amenities ~0.75 mi
Loading nearby amenities…
Taxation est. · year 1
- Rental income
- $23,336
- − Mortgage interest
- −$7,758
- − Property taxes
- −$2,312
- − Insurance
- −$692
- − Repairs & maintenance
- −$1,867
- − Management
- −$1,867
- − HOA
- −$5,988
- − Depreciation
- −$4,029
- Taxable loss
- −$1,177
- Est. tax savings @ 24.0%
- +$283
- After-tax cash flow
- $1,010/yr
For passive investors: Depreciation is non-cash, so a rental often shows a tax loss while cash-flowing — sheltering income. Rental losses are passive: they offset passive income freely, and up to $25,000/yr can offset ordinary (W-2) income if you actively participate and your MAGI is under $100k (phasing out to $0 by $150k); unused losses carry forward. On sale, claimed depreciation is recaptured at up to 25%, and gains may owe capital-gains tax (a 1031 exchange can defer both). Figures are a year-1 estimate at your 24.0% rate — not tax advice; consult a CPA.
Schools (NCES district)
- District
- Palm Beach
- NCES district ID
- 1201500
- Math proficiency
- 46% ▼ -16.00%
- Reading proficiency
- 53% ▼ -4.00%
- Median HH income
- $53,943
- Composite
- 42.72/100
- National rank
- #3160
- State rank
- #34 of 73 in FL
Livability — Greenacres
- Score
- 69/100
- State rank
- #490
- US rank
- #9008
Category grades
Schools grade is shown separately in the Schools card above.
Census & demographics
- Census place
- Greenacres, FL
- County
- Palm Beach County · 1,438,312 people
- City population
- 65,478
- Metro
- Miami-Fort Lauderdale-Pompano Beach, FL
- Population (ZIP)
- 65,478
- Household income
- $73,865
- Rent vs Own
- Severe rent burden
- 1466.0
Population outlook (Palm Beach County) Hauer SSP2
- Today (2025)
- 1,637,487 people
- By 2030
- 1,743,255 · +6.5%
- By 2040
- 1,948,712 · +19.0%
- By 2050
- 2,132,979 · +30.3%
- By 2075
- 2,530,027 · +54.5%
- By 2100
- 2,706,979 · +65.3%
Race, ethnicity, and origin ACS 2023
- Neighborhood character
- Diverse neighborhood (Simpson 0.70)
- Race & ethnicity
- Hispanic / Latino 38% Black 29% White 27% Two or more races 11% Asian 4%
- Hispanic origin (detail)
- Mexican 8% Puerto Rican 6% Cuban 5% Dominican 2%
- Common ancestry
- Hispanic 15% Romanian 1% Slovak 1%
- Foreign-born
- 39% · Canada, Jamaica, China
- Languages at home
- 45% English-only · Spanish 32% French/Haitian/Cajun 17% Other Indo-European 2%
Political lean MEDSL · Palm Beach
- 2024 margin
- Toss-up / Even · D 50.0% · R 49.2%
- 2008→2024 swing
- -22.1pp toward R · 2008: 22.9pp · 2024: 0.8pp
- All cycles
- 2024: D+0.8 2020: D+12.8 2016: D+15.3 2012: D+17.0 2008: D+22.9
Not yet ingested
- Civics
- —
Market trends
- HPI YoY
- ▼ -175.33%
- Current HPI
- 392.055
- Rent YoY
- ▲ 1.33%
- Metro
- Miami-Fort Lauderdale-Pompano Beach, FL
- State GDP YoY
- ▲ 3.28%
- F500 in state
- 36
Industry mix (Fortune 500 HQ in FL)
| Industry | F500 HQs | Revenue |
|---|---|---|
| Industrial Technology | 2 | $29B |
|
||
| Insurance | 2 | $17B |
|
||
| Retail | 1 | $60B |
|
||
| Technology Distribution | 1 | $58B |
|
||
| Homebuilding | 1 | $35B |
|
||
| Technology Manufacturing | 1 | $35B |
|
||
Price history
-96.2% since first listed13 events — show timeline
- 2026-04-10 Listed for Rent $1,650 RMLSFL
- 2026-03-31 Rental Removed $1,650 GFLMLS
- 2026-03-02 Price Changed $138,500 Beaches MLS
- 2026-01-12 Listed for Rent $1,650 GFLMLS
- 2026-01-12 Rental Removed $1,650 RMLSFL
- 2026-01-10 Listed for Rent $1,650 RMLSFL
- 2025-11-10 Price Changed $139,900 Beaches MLS
- 2025-09-29 Price Changed $149,990 Beaches MLS
- 2025-07-18 Listed $149,999 Beaches MLS
- 2012-03-09 Sold (Public Records) $30,000 Public Records
- 2012-02-10 Listing Removed — Beaches MLS
- 2011-09-16 Listed $33,900 Beaches MLS
- 1982-03-01 Sold (Public Records) $43,800 Public Records
Property tax history
+6.8%/yrLatest (2025): $2,312 · +5.7% YoY. Source: county tax records.
Cash-flow waterfall
monthlySold comps — $/sqft
last 12 mo · ≤1 miLoading sold comps…