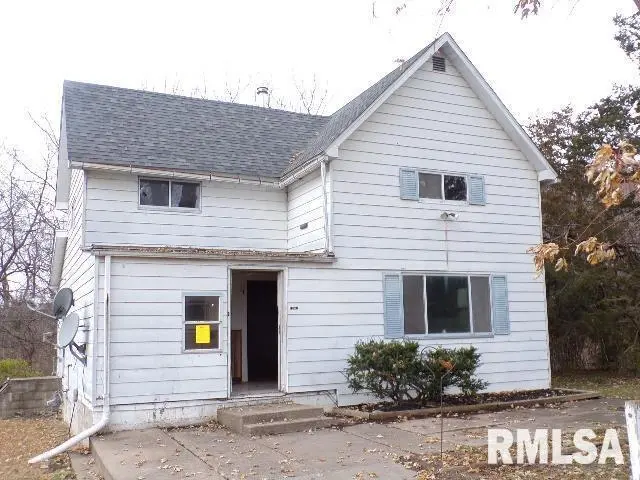
12080 100th Ave · Buffalo, IA
Flood risk 1/10 · Minimal
- FEMA flood zone
- X (unshaded)
- Chance of flooding over 30 yrs
- 0.0%
- Est. flood insurance / yr
- $473 – $860
Fire risk 1/10 · Minimal
- Est. fire insurance / yr
- $902 – $1,676
Heat risk 3/10 · Minor
- Hot days now (above 104°F)
- 7 days/yr
- Hot days in 30 yrs
- 16 days/yr
Wind risk 2/10 · Minimal
- Chance of severe wind over 30 yrs
- —
Air-quality risk 3/10 · Minor
- Unhealthy air days now
- 2 days/yr
- Unhealthy air days in 30 yrs
- 3 days/yr
Risk factors via First Street. Map © Google.
Why this score? — see what drove the B- grade
The composite is a weighted blend of 9 inputs, each scored 0–100. Each bar is that input's sub-score; the figure is the points it added to the 100-point composite (weight × sub-score).
- Cash flow +29.2/30.0
- DSCR +10.0/10.0
- 1% rule +8.2/10.0
- ARV discount +7.5/15.0
- Schools +3.9/10.0
- Livability +3.6/5.0
- Rent growth +3.5/5.0
- Condition / age +2.5/5.0
- Appreciation +0.0/10.0
$102,900
🖨 Deal sheet 📄 Offer letter ✓ Due diligence
Listing remarks
Oh the potential! 3 BR, 1 Bath country home on 1.55 acres. No close neighbors. Wooded back yard. 24 x 40 outbuilding. Very private setting. This is a Fannie Mae HomePath property. Roof installed in 2018 per Scott Co Assessor. This property has been placed in an upcoming online event. All bids should be submitted at the Xome Auctions website (void where prohibited). All properties are subject to a 3 pct buyer's premium, and bidding is pursuant to the Xome Auction Participation Agreement. Auction event 5/30-6/2.
Key facts
- Outbuilding
- Wooded back yard
- Private setting
Tags
Neighborhood map
What this means for you Summary
Snapshot
- This is a 3-bed/1.0-bath single-family listed at $103k.
Deal economics
- At list price, monthly cash flow is $360 ($4k/yr) — positive.
- The deal already cash-flows at list — no discount required.
- Meets the 1% rule at list price ($1k rent vs $103k).
- Recommended offer: $91k (12.0% below list) — sets the bar for market timing.
Location & tenants
- Location reads 72/100 on livability (#317 in IA) — a middle-class / working-renter tenant base. Strengths: crime A+, cost of living A+, housing A+; Watch: amenities F, commute F, health & safety F.
- Davenport Community School District (urban): math 43% / reading 50% proficiency, ranked #288 of 289 in IA (top 100%) — families likely to look elsewhere, expect single-tenant / working-renter base with shorter leases.
- Market conditions: Rents rising (+4.0%/yr); 161 active listings in the ZIP; 805 units permitted in Scott County in 2024 (479 in 5+ unit buildings).
Forward outlook
- Local home prices are declining (-3.0%/yr); year-one equity from $711 of loan paydown is wiped out by about $3k of value loss. Plan a longer hold.
- Scott County population projected at +19% by 2050 — long-run rental-demand tailwind backs the buy-and-hold thesis.
- At projected returns (-3.0% appreciation + 4.0% rent growth), your $29k cash investment doubles in ~8 years — after that, you're playing with house money.
Negotiation context
- It's been on market 176 days — a 12% lower offer ($91k) is reasonable based on typical stale-listing flexibility.
Risks & watch-outs
- Watch-outs: built in 1890 — expect roof / HVAC / electrical / plumbing capex.
Questions for the listing agent
- It's been on market 176 days. Have you received any prior offers? Is the seller open to a 12% concession, seller financing, or rate buy-down credit?
- Built in 1890 — when were the roof, HVAC, electrical panel, plumbing, and water heater last replaced?
- Why hasn't it sold? Are there any deal-killer items the seller is aware of (foundation, flood, title, zoning, code violations)?
- Is there a deadline driving the sale (1031 exchange, divorce, estate, relocation)? That informs how much negotiation room exists.
- Schools are B-rated — typically a magnet for longer-tenancy family renters. What's the average tenant stay here, and is there a school-zone premium baked into asking?
- What's the average days-on-market for RENTAL listings here right now (not sales)? A rising rental-DOM trend means longer vacancies and softer asking-rent achievability than the comps imply.
- What's the recent tenant-quality profile in this submarket — average credit score on applications, eviction rate, late-payment / NSF rate, and stable-employment percentage? A property-management company in the area should have these aggregated.
- How much new for-sale + rental construction is in the pipeline within 1–3 miles? Heavy new supply typically softens prices + rents 12–24 months out; constrained supply supports both.
Investment metrics
- 1% rule
- 1.32% ✓
- Cap rate
- 10.49%
- Cash-on-cash
- 14.99%
- DSCR
- 1.67
- GRM
- 6.3
CMA / ARV
- ARV (median comp)
- $260,226
- List price
- $102,900
- Delta
- -60.46%
- Verdict
- UNDERPRICED
- Comps
- 3 within 1.0 mi
Projected returns pro-forma
-3.0% appreciation · 3.99% rent growth · sell at horizon
- IRR
- 6.7%
- Equity multiple
- 1.27×
- Total profit
- $7,641
- Equity at exit
- $15,343
- IRR
- 16.9%
- Equity multiple
- 2.46×
- Total profit
- $41,993
- Equity at exit
- $8,897
Cash invested: $28,812 (down + closing). Projections, not guarantees.
Landlord ↔ Tenant lean methodology
- Overall (STATE)
- 83 Strongly Landlord-Friendly
- State Iowa
- 83 Strongly Landlord-Friendly · R+6
- County
- — inherits STATE
- City
- — inherits STATE
ZIP-level market 52804
- Home prices YoY
- -25.3%
- Rents YoY
- 4.0%
- Active inventory
- 161
- Price-to-rent
- 6.3×
Monthly cashflow live
- Estimated rent
- $1,360 medium interval (Pro) →
- Mortgage (P&I)
- −$540
- Tax from tax record
- −$132 /mo · $1,584/yr
- Insurance
- −$43
- HOA
- −$0
- Vacancy / Maint / Mgmt
- −$286
- Net cashflow
- $360
Break-even live
UW: 25.0% down · 7.5% · 30yr · 1.5% tax · 5.0% vac · 8.0% maint · 8.0% mgmt
Financing live
Cash to close
- Down payment
- $25,725
- Closing costs
- $3,087
- Reserves months
- —
- Total cash needed
- —
Loan-product check · same deal, 3 products live
Conventional
25% down · 7.5% · 30yr
- Down + closing
- —
- Monthly P&I
- —
- Monthly cashflow
- —
- DSCR
- —
- Eligible?
- —
Personal DTI + credit; lowest rate.
DSCR
20% down · 8.5% · 30yr
- Down + closing
- —
- Monthly P&I
- —
- Monthly cashflow
- —
- DSCR
- —
- Eligible?
- —
No personal income docs; deal must DSCR.
Hard money
10% down · 12.0% · 12mo
- Down + closing
- —
- Monthly P&I
- —
- Monthly cashflow
- —
- DSCR
- —
- Eligible?
- —
Short-term bridge; refi at stabilization.
Listing history 27 events
-
2026-06-18days on market $102,900 Active 176 DOM
-
2026-06-17days on market $102,900 Active 175 DOM
-
2026-06-16price $102,900 Active 174 DOM
-
2026-06-16days on market $128,000 Active 174 DOM
-
2026-06-15days on market $128,000 Active 173 DOM
-
2026-06-14days on market $128,000 Active 171 DOM
-
2026-06-13days on market $128,000 Active 170 DOM
-
2026-06-10days on market $128,000 Active 168 DOM
-
2026-06-09days on market $128,000 Active 167 DOM
-
2026-06-08days on market $128,000 Active 166 DOM
-
2026-06-07days on market $128,000 Active 165 DOM
-
2026-06-03days on market $128,000 Active 162 DOM
-
2026-06-02days on market $128,000 Active 161 DOM
-
2026-06-01days on market $128,000 Active 160 DOM
-
2026-05-31days on market $128,000 Active 159 DOM
-
2026-05-30days on market $128,000 Active 158 DOM
-
2026-03-09price $128,000
-
2026-02-06price $132,900
-
2026-01-18status Active
-
2026-01-14historical
-
2026-01-07price $136,000
-
2026-01-07status Active
-
2026-01-06historical
-
2026-01-05historical
-
2026-01-02status Active
-
2026-01-02historical
-
2025-12-09Active
ⓘ Source: listings_history table (triggers on properties + properties_extension) + one-shot
backfill from property_details.listing_events for pre-trigger history.
Tax reassessment forecast IA · Partial reset (capped growth)
- Current annual tax
- $1,584 · $132/mo
- Projected year-2 tax
- $1,600 · $133/mo
- Expected delta
- +$16/yr (+$1/mo · 1.0%)
ⓘ Screening estimate from a state-policy table — verify with the county assessor before closing.
Climate risk First Street
- Flood 1/10 Low FEMA zone X (unshaded) · 0% chance over 30 yrs
- Wildfire 1/10 Low
- Heat 3/10 Moderate 7 d/yr ≥104°F today · 16 d/yr by 30 yrs out
- Wind 2/10 Low
- Air quality 3/10 Moderate 2 unhealthy d/yr today · 3 by 30 yrs out
Nearby sold comps map
Loading sold comps map…
Walkable amenities ~0.75 mi
Loading nearby amenities…
Taxation est. · year 1
- Rental income
- $16,320
- − Mortgage interest
- −$5,764
- − Property taxes
- −$1,584
- − Insurance
- −$514
- − Repairs & maintenance
- −$1,306
- − Management
- −$1,306
- − Depreciation
- −$2,993
- Taxable income
- $2,853
- Est. tax owed @ 24.0%
- −$685
- After-tax cash flow
- $3,634/yr
For passive investors: Depreciation is non-cash, so a rental often shows a tax loss while cash-flowing — sheltering income. Rental losses are passive: they offset passive income freely, and up to $25,000/yr can offset ordinary (W-2) income if you actively participate and your MAGI is under $100k (phasing out to $0 by $150k); unused losses carry forward. On sale, claimed depreciation is recaptured at up to 25%, and gains may owe capital-gains tax (a 1031 exchange can defer both). Figures are a year-1 estimate at your 24.0% rate — not tax advice; consult a CPA.
Schools (NCES district)
- District
- Davenport Community School District
- NCES district ID
- 1908580
- Math proficiency
- 43% ▼ -11.00%
- Reading proficiency
- 50% ▼ -3.00%
- Median HH income
- $46,157
- Composite
- 39.49/100
- National rank
- #3951
- State rank
- #288 of 289 in IA
Livability — Buffalo
- Score
- 72/100
- State rank
- #317
- US rank
- #6216
Category grades
Schools grade is shown separately in the Schools card above.
Census & demographics
- County
- Scott County · 144,583 people
- City population
- 987
- Metro
- Davenport-Moline-Rock Island, IA-IL
- Population (ZIP)
- 26,835
- Household income
- $65,849
- Rent vs Own
- Severe rent burden
- 830.0
Population outlook (Scott County) Hauer SSP2
- Today (2025)
- 188,878 people
- By 2030
- 196,648 · +4.1%
- By 2040
- 210,860 · +11.6%
- By 2050
- 224,359 · +18.8%
- By 2075
- 258,884 · +37.1%
- By 2100
- 286,447 · +51.7%
Race, ethnicity, and origin ACS 2023
- Neighborhood character
- Predominantly White (71%)
- Race & ethnicity
- White 71% Black 10% Hispanic / Latino 10% Two or more races 9% Asian 2%
- Hispanic origin (detail)
- Mexican 8%
- Common ancestry
- Iranian 2% Romanian 2% Portuguese 1%
- Foreign-born
- 4% · Canada, China, Vietnam
- Languages at home
- 94% English-only · Spanish 3% Russian/Polish/Slavic 1% Chinese 1%
Political lean MEDSL · Scott
- 2024 margin
- Toss-up / Even · D 47.3% · R 51.2% · Other 1.4%
- 2008→2024 swing
- -18.4pp toward R · 2008: 14.6pp · 2024: -3.9pp
- All cycles
- 2024: R+3.9 2020: D+3.5 2016: D+1.4 2012: D+13.8 2008: D+14.6
Not yet ingested
- Civics
- —
Market trends
- HPI YoY
- ▼ -66.50%
- Current HPI
- 196.2267
- Rent YoY
- ▲ 3.99%
- Metro
- Davenport-Moline-Rock Island, IA-IL
- State GDP YoY
- ▲ 2.48%
- F500 in state
- 4
Industry mix (Fortune 500 HQ in IA)
| Industry | F500 HQs | Revenue |
|---|---|---|
| Financial Services | 1 | $16B |
|
||
| Retail / Convenience | 1 | $15B |
|
||
Price history
-5.9% since first listed11 events — show timeline
- 2026-03-09 Price Changed $128,000 MRED as Distributed by MLS Grid
- 2026-02-06 Price Changed $132,900 MRED as Distributed by MLS Grid
- 2026-01-18 Relisted — MRED as Distributed by MLS Grid
- 2026-01-14 Listing Removed — MRED as Distributed by MLS Grid
- 2026-01-07 Price Changed $136,000 MRED as Distributed by MLS Grid
- 2026-01-07 Relisted — MRED as Distributed by MLS Grid
- 2026-01-06 Listing Removed — RMLSA as Distributed by MLS Grid
- 2026-01-05 Listing Removed — MRED as Distributed by MLS Grid
- 2026-01-02 Relisted — MRED as Distributed by MLS Grid
- 2026-01-02 Listing Removed — MRED as Distributed by MLS Grid
- 2025-12-09 Listed — RMLSA as Distributed by MLS Grid
Property tax history
+1.0%/yrLatest (2025): $1,584 · +2.7% YoY. Source: county tax records.
Cash-flow waterfall
monthlySold comps — $/sqft
last 12 mo · ≤1 miLoading sold comps…