585 Cr 32 · Iron Mountain Lake, MO
Flood risk 1/10 · Minimal
- FEMA flood zone
- X (unshaded)
- Chance of flooding over 30 yrs
- 0.0%
- Est. flood insurance / yr
- $473 – $860
Fire risk 4/10 · Minor
- Est. fire insurance / yr
- $1,054 – $1,958
Heat risk 4/10 · Minor
- Hot days now (above 104°F)
- 7 days/yr
- Hot days in 30 yrs
- 20 days/yr
Wind risk 2/10 · Minimal
- Chance of severe wind over 30 yrs
- 1.0%
Air-quality risk 1/10 · Minimal
- Unhealthy air days now
- 0 days/yr
- Unhealthy air days in 30 yrs
- 0 days/yr
Risk factors via First Street. Map © Google.
Why this score? — see what drove the B+ grade
The composite is a weighted blend of 9 inputs, each scored 0–100. Each bar is that input's sub-score; the figure is the points it added to the 100-point composite (weight × sub-score).
- Cash flow +30.0/30.0
- 1% rule +10.0/10.0
- DSCR +10.0/10.0
- Appreciation +9.1/10.0
- ARV discount +7.5/15.0
- Schools +3.6/10.0
- Rent growth +2.5/5.0
- Livability +2.2/5.0
- Condition / age +1.0/5.0
$79,900
🖨 Deal sheet 📄 Offer letter ✓ Due diligence
Listing remarks MLS
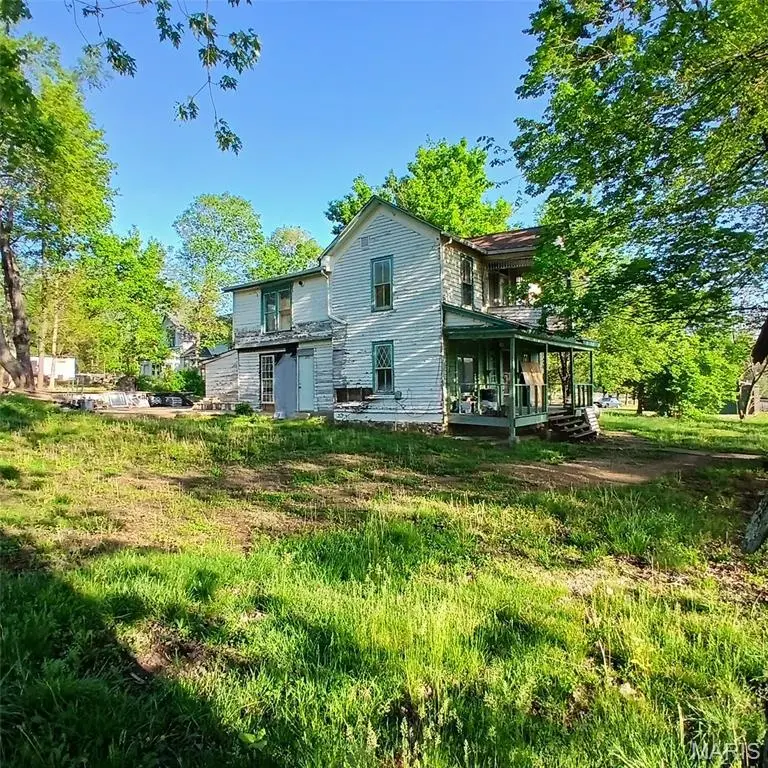
This historic Arcadia Valley home is ready for someone with vision. Featuring 4 bedrooms and classic architectural character, it offers the kind of solid bones and timeless charm you can only find in older homes. It needs a complete remodel, but that’s exactly where the opportunity lies — with the right updates, this property could become something truly remarkable. Set in the beautiful Arcadia Valley, you’re surrounded by scenic views and just minutes from several of Missouri’s most beloved state parks, including Elephant Rocks, Johnson’s Shut-Ins, and Taum Sauk Mountain. Whether you’re dreaming of a full restoration project, an investment property, or a custom home with historic soul, this place gives you the perfect canvas.
Key facts
- Complete remodel
- Scenic views
- 1.27 acre lot
Tags
Neighborhood map
What this means for you Summary
Snapshot
- This is a 4-bed/2.0-bath single-family listed at $80k. Condition is rated poor.
Deal economics
- At list price, monthly cash flow is $513 ($6k/yr) — positive.
- The deal already cash-flows at list — no discount required.
- Meets the 1% rule at list price ($1k rent vs $80k).
- Recommended offer: $75k (6.0% below list) — sets the bar for market timing.
Location & tenants
- Location reads 44/100 on livability (#966 in MO) — a working-class tenant base; expect higher turnover. Strengths: cost of living A+; Watch: schools F, crime F, amenities F.
- Arcadia Valley R-II (rural): math 42% / reading 46% proficiency, ranked #115 of 324 in MO (top 36%) — families likely to look elsewhere, expect single-tenant / working-renter base with shorter leases.
- Market conditions: 8 active listings in the ZIP; 6 units permitted in Iron County in 2024 (0 in 5+ unit buildings).
Forward outlook
- In year one you build about $7k of equity ($552 loan paydown + $7k appreciation (8.2% local appreciation)).
- Iron County population projected at -25% by 2050 — secular population decline; favor cash flow + early exit over multi-decade hold.
- At projected returns (8.2% appreciation + 3.0% rent growth), your $22k cash investment doubles in ~2 years — after that, you're playing with house money.
- By year 5, paydown + projected appreciation supports a ~$32k cash-out refi (75% LTV) — recoverable capital for the next deal without selling this one.
Negotiation context
- It's been on market 61 days — a 6% lower offer ($75k) is reasonable based on typical stale-listing flexibility.
Risks & watch-outs
- Watch-outs: built in 1860 — expect roof / HVAC / electrical / plumbing capex.
Questions for the listing agent
- It's been on market 61 days. Have you received any prior offers? Is the seller open to a 6% concession, seller financing, or rate buy-down credit?
- Have any recent inspections been done? Can we get a copy of the seller's disclosures and any deferred-maintenance estimates?
- Built in 1860 — when were the roof, HVAC, electrical panel, plumbing, and water heater last replaced?
- Why hasn't it sold? Are there any deal-killer items the seller is aware of (foundation, flood, title, zoning, code violations)?
- Is there a deadline driving the sale (1031 exchange, divorce, estate, relocation)? That informs how much negotiation room exists.
- Schools are F-rated, which usually means shorter tenancies and higher turnover. Who's the typical renter profile here, and what's been the actual vacancy rate?
- Crime grade is F in this area — have there been break-ins, vandalism, or insurance claims at this property in the last 3 years? What carrier currently insures it and at what premium?
- What's the average days-on-market for RENTAL listings here right now (not sales)? A rising rental-DOM trend means longer vacancies and softer asking-rent achievability than the comps imply.
- What's the recent tenant-quality profile in this submarket — average credit score on applications, eviction rate, late-payment / NSF rate, and stable-employment percentage? A property-management company in the area should have these aggregated.
- How much new for-sale + rental construction is in the pipeline within 1–3 miles? Heavy new supply typically softens prices + rents 12–24 months out; constrained supply supports both.
Investment metrics
- 1% rule
- 1.69% ✓
- Cap rate
- 13.99%
- Cash-on-cash
- 27.50%
- DSCR
- 2.22
- GRM
- 4.9
CMA / ARV
- ARV (median comp)
- $315,151
- List price
- $79,900
- Delta
- -74.65%
- Verdict
- UNDERPRICED
- Comps
- 1 within 2.0 mi
Projected returns pro-forma
8.16% appreciation · 3.0% rent growth · sell at horizon
- IRR
- 42.2%
- Equity multiple
- 3.97×
- Total profit
- $66,403
- Equity at exit
- $61,563
- IRR
- 37.6%
- Equity multiple
- 8.53×
- Total profit
- $168,475
- Equity at exit
- $123,033
Cash invested: $22,372 (down + closing). Projections, not guarantees.
Landlord ↔ Tenant lean methodology
- Overall (STATE)
- 81 Strongly Landlord-Friendly
- State Missouri
- 81 Strongly Landlord-Friendly · R+10
- County
- — inherits STATE
- City
- — inherits STATE
ZIP-level market 63656
- Home prices YoY
- 5.1%
- Active inventory
- 8
- Price-to-rent
- 4.9×
Monthly cashflow live
- Estimated rent
- $1,348 medium interval (Pro) →
- Mortgage (P&I)
- −$419
- Tax est. 1.5%
- −$100 /mo · $1,198/yr
- Insurance
- −$33
- HOA
- −$0
- Vacancy / Maint / Mgmt
- −$283
- Net cashflow
- $513
Break-even live
UW: 25.0% down · 7.5% · 30yr · 1.5% tax · 5.0% vac · 8.0% maint · 8.0% mgmt
Financing live
Cash to close
- Down payment
- $19,975
- Closing costs
- $2,397
- Reserves months
- —
- Total cash needed
- —
Loan-product check · same deal, 3 products live
Conventional
25% down · 7.5% · 30yr
- Down + closing
- —
- Monthly P&I
- —
- Monthly cashflow
- —
- DSCR
- —
- Eligible?
- —
Personal DTI + credit; lowest rate.
DSCR
20% down · 8.5% · 30yr
- Down + closing
- —
- Monthly P&I
- —
- Monthly cashflow
- —
- DSCR
- —
- Eligible?
- —
No personal income docs; deal must DSCR.
Hard money
10% down · 12.0% · 12mo
- Down + closing
- —
- Monthly P&I
- —
- Monthly cashflow
- —
- DSCR
- —
- Eligible?
- —
Short-term bridge; refi at stabilization.
Listing history 15 events
-
2026-06-18days on market $79,900 Active 61 DOM
-
2026-06-17days on market $79,900 Active 60 DOM
-
2026-06-16days on market $79,900 Active 59 DOM
-
2026-06-15days on market $79,900 Active 58 DOM
-
2026-06-13days on market $79,900 Active 56 DOM
-
2026-06-12days on market $79,900 Active 55 DOM
-
2026-06-09days on market $79,900 Active 52 DOM
-
2026-06-08days on market $79,900 Active 51 DOM
-
2026-06-07days on market $79,900 Active 50 DOM
-
2026-06-07days on market $79,900 Active 49 DOM
-
2026-06-04days on market $79,900 Active 46 DOM
-
2026-06-02days on market $79,900 Active 45 DOM
-
2026-06-01days on market $79,900 Active 44 DOM
-
2026-05-31days on market $79,900 Active 43 DOM
-
2026-04-18$79,900 Active 773-char remark
Show marketing remark (773 chars)
This historic Arcadia Valley home is ready for someone with vision. Featuring 4 bedrooms and classic architectural character, it offers the kind of solid bones and timeless charm you can only find in older homes. It needs a complete remodel, but that’s exactly where the opportunity lies — with the right updates, this property could become something truly remarkable. Set in the beautiful Arcadia Valley, you’re surrounded by scenic views and just minutes from several of Missouri’s most beloved state parks, including Elephant Rocks, Johnson’s Shut-Ins, and Taum Sauk Mountain. Whether you’re dreaming of a full restoration project, an investment property, or a custom home with historic soul, this place gives you the perfect canvas.
ⓘ Source: listings_history table (triggers on properties + properties_extension) + one-shot
backfill from property_details.listing_events for pre-trigger history.
Climate risk First Street
- Flood 1/10 Low FEMA zone X (unshaded) · 0% chance over 30 yrs
- Wildfire 4/10 Moderate
- Heat 4/10 Moderate 7 d/yr ≥104°F today · 20 d/yr by 30 yrs out
- Wind 2/10 Low 100% chance of damaging wind over 30 yrs
- Air quality 1/10 Low 0 unhealthy d/yr today · 0 by 30 yrs out
Nearby sold comps map
Loading sold comps map…
Walkable amenities ~0.75 mi
Loading nearby amenities…
Taxation est. · year 1
- Rental income
- $16,176
- − Mortgage interest
- −$4,476
- − Property taxes
- −$1,198
- − Insurance
- −$400
- − Repairs & maintenance
- −$1,294
- − Management
- −$1,294
- − Depreciation
- −$2,324
- Taxable income
- $5,190
- Est. tax owed @ 24.0%
- −$1,246
- After-tax cash flow
- $4,908/yr
For passive investors: Depreciation is non-cash, so a rental often shows a tax loss while cash-flowing — sheltering income. Rental losses are passive: they offset passive income freely, and up to $25,000/yr can offset ordinary (W-2) income if you actively participate and your MAGI is under $100k (phasing out to $0 by $150k); unused losses carry forward. On sale, claimed depreciation is recaptured at up to 25%, and gains may owe capital-gains tax (a 1031 exchange can defer both). Figures are a year-1 estimate at your 24.0% rate — not tax advice; consult a CPA.
Condition & rehab AI · 13 photos
This historic home requires extensive repairs and renovations, including a new roof, siding, and HVAC system, to become move-in ready and significantly increase its value.
Repairs flagged
- Major roof — The roof appears to be in disrepair and likely leaking.
- Major exterior siding — The exterior siding is peeling and damaged, requiring replacement.
- Major flooring — The flooring is worn and in need of replacement.
- Major interior walls — The interior walls show signs of water damage and need repair.
- Major landscaping — The landscaping is overgrown and requires trimming and clearing.
- Major foundation — The foundation appears to be in poor condition and requires repair.
- Major HVAC system — The HVAC system is old and in need of replacement.
Value-add opportunities
- Resale roof replacement — A new roof will significantly improve the home's appearance and increase its value.
- Resale exterior siding replacement — New siding will improve the home's curb appeal and increase its value.
- Both HVAC system replacement — A new HVAC system will improve comfort and energy efficiency, benefiting both resale and rental value.
- Both landscaping and exterior painting — A well-maintained exterior and fresh paint will enhance curb appeal and increase both resale and rental value.
Renovation cost estimate screening
| Repair item | Severity | Est. cost |
|---|---|---|
| roof · The roof appears to be in disrepair and likely leaking. | Major | $15,000–50,000 |
| exterior siding · The exterior siding is peeling and damaged, requiring replacement. | Major | $15,000–50,000 |
| flooring · The flooring is worn and in need of replacement. | Major | $15,000–50,000 |
| interior walls · The interior walls show signs of water damage and need repair. | Major | $15,000–50,000 |
| landscaping · The landscaping is overgrown and requires trimming and clearing. | Major | $15,000–50,000 |
| foundation · The foundation appears to be in poor condition and requires repair. | Major | $15,000–50,000 |
| HVAC system · The HVAC system is old and in need of replacement. | Major | $15,000–50,000 |
| Total estimated repair cost · 7 items | $105,000–350,000 |
Value-add ROI direction
- Resale roof replacement — A new roof will significantly improve the home's appearance and increase its value. ↑
- Resale exterior siding replacement — New siding will improve the home's curb appeal and increase its value. ↑
- Both HVAC system replacement — A new HVAC system will improve comfort and energy efficiency, benefiting both resale and rental value. ↑
- Both landscaping and exterior painting — A well-maintained exterior and fresh paint will enhance curb appeal and increase both resale and rental value. ↑
ⓘ Cost ranges are severity-bucket heuristics (US national rule-of-thumb). Get contractor quotes + a written scope before underwriting a rehab budget.
Schools (NCES district)
- District
- Arcadia Valley R-II
- NCES district ID
- 2903150
- Math proficiency
- 42% ▼ -8.00%
- Reading proficiency
- 46% ▼ -6.00%
- Median HH income
- $34,573
- Composite
- 36.32/100
- National rank
- #4693
- State rank
- #115 of 324 in MO
Livability — Iron Mountain Lake
- Score
- 44/100
- State rank
- #966
- US rank
- #26705
Category grades
Schools grade is shown separately in the Schools card above.
Census & demographics
- Population (ZIP)
- 533
Population outlook (Iron County) Hauer SSP2
- Today (2025)
- 9,245 people
- By 2030
- 8,745 · -5.4%
- By 2040
- 7,808 · -15.5%
- By 2050
- 6,944 · -24.9%
- By 2075
- 5,320 · -42.5%
- By 2100
- 4,245 · -54.1%
Race, ethnicity, and origin ACS 2023
- Neighborhood character
- Predominantly White (90%)
- Race & ethnicity
- White 90% Two or more races 8%
- Common ancestry
- Serbian 3% Romanian 2% Lithuanian 2%
Political lean MEDSL · Iron
- 2024 margin
- Solid R (+62.4) · D 18.2% · R 80.7% · Other 1.1%
- 2008→2024 swing
- -65.2pp toward R · 2008: 2.8pp · 2024: -62.4pp
- All cycles
- 2024: R+62.4 2020: R+57.7 2016: R+52.6 2012: R+14.5 2008: D+2.8
Not yet ingested
- Civics
- —
Market trends
- HPI YoY
- ▲ 8.16%
- Current HPI
- 168.8906
- Rent YoY
- —
- Metro
- —
- State GDP YoY
- ▲ 1.84%
- F500 in state
- 20
Industry mix (Fortune 500 HQ in MO)
| Industry | F500 HQs | Revenue |
|---|---|---|
| Healthcare | 1 | $163B |
|
||
| Insurance | 1 | $21B |
|
||
| Industrial Technology | 1 | $17B |
|
||
| Retail | 1 | $16B |
|
||
| Industrial Distribution | 1 | $10B |
|
||
| Utilities | 1 | $9B |
|
||
Price history
1 event — show timeline
- 2026-04-18 Listed $79,900 MARIS as Distributed by MLS Grid
Cash-flow waterfall
monthlySold comps — $/sqft
last 12 mo · ≤1 miLoading sold comps…