 🏷️ Likely Rental
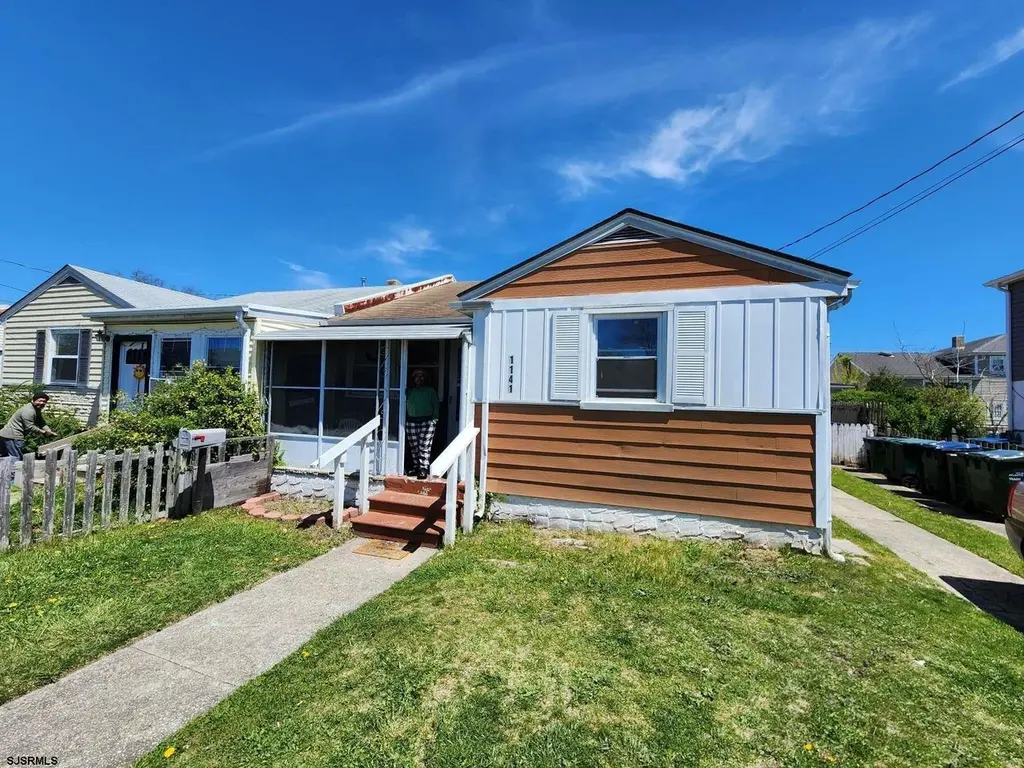
1141 N Michigan Ave · Atlantic City, NJ
Flood risk 9/10 · Severe
- FEMA flood zone
- AE
- Chance of flooding over 30 yrs
- 0.99%
- Est. flood insurance / yr
- $1,737 – $8,500
Fire risk 3/10 · Minor
- Est. fire insurance / yr
- $526 – $976
Heat risk 9/10 · Severe
- Hot days now (above 94°F)
- 7 days/yr
- Hot days in 30 yrs
- 16 days/yr
Wind risk 8/10 · Major
- Chance of severe wind over 30 yrs
- 80.0%
Air-quality risk 3/10 · Minor
- Unhealthy air days now
- 2 days/yr
- Unhealthy air days in 30 yrs
- 3 days/yr
Risk factors via First Street. Map © Google.
Why this score? — see what drove the B grade
The composite is a weighted blend of 9 inputs, each scored 0–100. Each bar is that input's sub-score; the figure is the points it added to the 100-point composite (weight × sub-score).
- Cash flow +29.7/30.0
- ARV discount +15.0/15.0
- DSCR +10.0/10.0
- 1% rule +7.7/10.0
- Rent growth +3.9/5.0
- Livability +2.8/5.0
- Condition / age +2.5/5.0
- Schools +1.4/10.0
- Appreciation +0.0/10.0
$179,900
🖨 Deal sheet (PDF) 📄 Offer letter ✓ Due diligence
Listing remarks MLS
Turnkey Atlantic City Rental — Long-Term Tenants, Immediate Cash Flow. 1141 N Michigan Ave, Atlantic City, NJ. $1,750/month + utilities. Lease through 6/28/2026. Single-family home, tenant-occupied Recent upgrades: new flooring in living room, hallway and carpet in bedrooms! Recent CO approved, ready to sell! Well-performing rental with multi-year tenants, excellent payment history, and no maintenance or turnover required. Rent history available via RentRedi. This is a true plug-and-play investment for cash buyers, 1031 exchanges, or portfolio investors seeking stable income from day one. Selling due to outside financial obligations — not property performance.
Key facts
- Parking
- Built 1959
- Listed 177 days
Neighborhood map
What this means for you Summary
Snapshot
- This is a 3-bed/1.0-bath single-family listed at $180k.
Deal economics
- At list price, monthly cash flow is $226 ($3k/yr) — positive.
- The deal already cash-flows at list — no discount required.
- Meets the 1% rule at list price ($2k rent vs $180k).
- Recommended offer: $158k (12.0% below list) — sets the bar for market timing.
- Cap rate 10.6% vs local median 3.7% in Atlantic City — top-decile yield for the area; either an underpriced asset or a hidden risk that comps aren't pricing in. Stress-test before assuming the spread holds.
Location & tenants
- Location reads 55/100 on livability (#525 in NJ) — a working-class tenant base; expect higher turnover. Strengths: health & safety A; Watch: commute D, schools F, crime F.
- Atlantic City School District (urban): math 9% / reading 26% proficiency, ranked #454 of 472 in NJ (top 96%) — low school quality limits family demand, transient renter base, plan for 1-2y turnover; 85% free/reduced lunch — lower-income household profile, screen leases tightly.
- Market conditions: Rents rising fast (+5.5%/yr); 482 active listings in the ZIP; 16 comparable units currently listed for rent nearby; rentals at typical pace (median 22d on market — plan ~3-4 weeks tenant-placement turnaround); lower-income renter base — watch delinquency; 672 units permitted in Atlantic County in 2024 (258 in 5+ unit buildings).
- At $2,279/mo this rent would consume 66% of the median local household income ($41k/yr) (locally 3414% of renters already pay >50% of income on rent) — very limited rent-growth headroom before tenants either downsize or default.
Forward outlook
- Local home prices are declining (-3.0%/yr); year-one equity from $1k of loan paydown is wiped out by about $5k of value loss. Plan a longer hold.
- Atlantic County population projected at -12% by 2050 — secular population decline; favor cash flow + early exit over multi-decade hold.
- At projected returns (-3.0% appreciation + 5.5% rent growth), your $50k cash investment doubles in ~10 years — after that, you're playing with house money.
Negotiation context
- It's been on market 178 days — a 12% lower offer ($158k) is reasonable based on typical stale-listing flexibility.
- 5 sale attempts since 8y ago; this cycle's ask has dropped $20k (10%) from the opening price — seller is motivated, your offer sets the floor, not the list.
- Current owner paid $125k; 44% above their basis — modest negotiation headroom, anchor on the comps not their cost.
Risks & watch-outs
- Watch-outs: flood insurance adds $427/mo; built in 1959 — expect roof / HVAC / electrical / plumbing capex.
- Climate carrying-cost: in FEMA flood zone AE (mandatory federal flood insurance); severe wind risk, 80% chance of damaging wind over 30y; extreme-heat days projected 7→16/yr by 2055 (HVAC capex compounding) — expect insurance premiums to compound above CPI over the hold.
Questions for the listing agent
- It's been on market 178 days. Have you received any prior offers? Is the seller open to a 12% concession, seller financing, or rate buy-down credit?
- Built in 1959 — when were the roof, HVAC, electrical panel, plumbing, and water heater last replaced?
- What's the actual annual flood-insurance premium (NFIP or private), and is the property in a SFHA with mandatory coverage?
- Why hasn't it sold? Are there any deal-killer items the seller is aware of (foundation, flood, title, zoning, code violations)?
- Is there a deadline driving the sale (1031 exchange, divorce, estate, relocation)? That informs how much negotiation room exists.
- Schools are F-rated, which usually means shorter tenancies and higher turnover. Who's the typical renter profile here, and what's been the actual vacancy rate?
- Crime grade is F in this area — have there been break-ins, vandalism, or insurance claims at this property in the last 3 years? What carrier currently insures it and at what premium?
- What's the average days-on-market for RENTAL listings here right now (not sales)? A rising rental-DOM trend means longer vacancies and softer asking-rent achievability than the comps imply.
- What's the recent tenant-quality profile in this submarket — average credit score on applications, eviction rate, late-payment / NSF rate, and stable-employment percentage? A property-management company in the area should have these aggregated.
- How much new for-sale + rental construction is in the pipeline within 1–3 miles? Heavy new supply typically softens prices + rents 12–24 months out; constrained supply supports both.
Investment metrics
- 1% rule
- 1.27% ✓
- Cap rate
- 10.64%
- Cash-on-cash
- 15.54%
- DSCR
- 1.69
- GRM
- 6.6
CMA / ARV
- ARV (on-the-fly)
- $233,618
- Comps found
- 12
Show comp detail 12 sales within ~0.75 mi
| Address | Dist | Beds/Ba | Sqft | Sold | Price | $/sf | Match |
|---|---|---|---|---|---|---|---|
| 822 N Arkansas Ave Ave | 0.24mi | 3/1.0 | 884 (-2%) | 5mo | $140,000 | $158 | 81 |
| 1007 N Ohio Ave | 0.16mi | 3/1.0 | 992 (+10%) | 8mo | $175,000 | $176 | 70 |
| 2018 Horace Bryant Jr Dr | 0.10mi | 3/1.5 | 1,032 (+14%) | 2mo | $297,000 | $288 | 68 |
| 2021 Grant Ave | 0.21mi | 3/1.0 | 1,011 (+12%) | 4mo | $125,000 | $124 | 67 |
| 1003 N Michigan Ave Ave | 0.15mi | 2/1.0 (-1) | 1,024 (+14%) | 0mo | $160,000 | $156 | 66 |
| 1946 Murray Ave | 0.55mi | 3/2.0 | 896 (-1%) | 7mo | $410,000 | $458 | 63 |
| 1521 N Michigan Ave | 0.36mi | 3/1.5 | 864 (-4%) | 14mo | $247,700 | $287 | 63 |
| 345 Ocean Ave | 0.69mi | 3/1.0 | 922 (+2%) | 2mo | $170,000 | $184 | 62 |
| 1510 N Arkansas Ave | 0.32mi | 3/2.0 | 1,008 (+12%) | 1mo | $275,000 | $273 | 61 |
| 1530 Beach Ave | 0.33mi | 3/2.0 | 1,014 (+12%) | 14mo | $267,000 | $263 | 48 |
| 1441 Caspian Ave | 0.51mi | 3/1.0 | 1,025 (+14%) | 8mo | $142,000 | $139 | 47 |
| 2117 Murray Ave | 0.56mi | 3/2.0 | 1,025 (+14%) | 10mo | $265,000 | $259 | 39 |
Match score weights: distance 35% · size 25% · config 20% · recency 20%. Top-matched comps best support the ARV.
Projected returns pro-forma
-3.0% appreciation · 5.52% rent growth · sell at horizon
- IRR
- -4.4%
- Equity multiple
- 0.83×
- Total profit
- $-8,620
- Equity at exit
- $26,824
- IRR
- 8.6%
- Equity multiple
- 1.75×
- Total profit
- $37,558
- Equity at exit
- $15,554
Cash invested: $50,372 (down + closing). Projections, not guarantees.
Landlord ↔ Tenant lean methodology
- Overall (STATE)
- 21 Tenant-Leaning
- State New Jersey
- 21 Tenant-Leaning · D+6
- County
- — inherits STATE
- City
- — inherits STATE
ZIP-level market 08401
- Home prices YoY
- -7.0%
- Rents YoY
- 5.5%
- Active inventory
- 482
- Price-to-rent
- 6.6×
Monthly cashflow live
- Estimated rent
- $2,279 high interval (Pro) →
- Mortgage (P&I)
- −$943
- Tax from tax record
- −$130 /mo · $1,555/yr
- Insurance
- −$75
- Flood insurance flood zone
- −$427 /mo · $5,118/yr
- HOA
- −$0
- Vacancy / Maint / Mgmt
- −$479
- Net cashflow
- $226
Break-even live
Sensitivity live
| Price | -10% $327 | -5% $277 | +0% $226 | +5% $175 | +10% $124 |
|---|---|---|---|---|---|
| Rent | -10% $46 | -5% $136 | +0% $226 | +5% $316 | +10% $406 |
| Rate | -1.0pp $316 | -0.5pp $271 | base $226 | +0.5pp $179 | +1.0pp $132 |
UW: 25.0% down · 7.5% · 30yr · 1.5% tax · 5.0% vac · 8.0% maint · 8.0% mgmt
Financing live
Cash to close
- Down payment
- $44,975
- Closing costs
- $5,397
- Reserves months
- —
- Total cash needed
- —
Loan-product check · same deal, 3 products live
Conventional
25% down · 7.5% · 30yr
- Down + closing
- —
- Monthly P&I
- —
- Monthly cashflow
- —
- DSCR
- —
- Eligible?
- —
Personal DTI + credit; lowest rate.
DSCR
20% down · 8.5% · 30yr
- Down + closing
- —
- Monthly P&I
- —
- Monthly cashflow
- —
- DSCR
- —
- Eligible?
- —
No personal income docs; deal must DSCR.
Hard money
10% down · 12.0% · 12mo
- Down + closing
- —
- Monthly P&I
- —
- Monthly cashflow
- —
- DSCR
- —
- Eligible?
- —
Short-term bridge; refi at stabilization.
Rent comps 16 comps
| Address | Beds | Baths | Sqft | Rent | $/sqft | DOM | Units | Dist |
|---|---|---|---|---|---|---|---|---|
| 905 Keener Ave Atlantic City, NJ | 3.0 | 1.0 | 1059 | $1,900 | $1.79 | 22d | 1 | 0.16mi |
| 2015 Grant Ave Atlantic City, NJ | 3.0 | 1.0 | 1056 | $2,325 | $2.20 | 22d | 1 | 0.17mi |
| 2021 Grant Ave Atlantic City, NJ | 3.0 | 1.0 | 1011 | $2,350 | $2.32 | 22d | 1 | 0.18mi |
| 1510 N Arkansas Ave Atlantic City, NJ | 3.0 | 2.0 | 1008 | $2,750 | $2.73 | 14d | 1 | 0.33mi |
| 1523 N Arkansas Ave Atlantic City, NJ | 3.0 | 2.0 | 984 | $2,500 | $2.54 | 22d | 1 | 0.37mi |
| 1914 N Missouri Ave Atlantic City, NJ | 2.0 | 1.0 | 750 | $1,795 | $2.39 | 22d | 1 | 0.66mi |
| 4 Italy Ter Atlantic City, NJ | 3.0 | 1.0 | 1000 | $2,300 | $2.30 | 22d | 1 | 0.73mi |
| 1724 Atlantic Ave Unit A1 Atlantic City, NJ | 3.0 | 1.0 | 950 | $2,300 | $2.42 | 22d | 1 | 0.89mi |
| 1724 Atlantic Ave Unit B2 Atlantic City, NJ | 2.0 | 1.0 | 750 | $1,495 | $1.99 | 22d | 1 | 0.89mi |
| 1710 Atlantic Ave Apt A Atlantic City, NJ | 2.0 | 1.0 | 600 | $4,500 | $7.50 | 22d | 1 | 0.89mi |
| 31 N Virginia Ave Atlantic City, NJ | 3.0 | 1.0 | 725 | $2,230 | $3.08 | 14d | 1 | 1.10mi |
| 38 N Boston Ave Unit B Atlantic City, NJ | 2.0 | 2.0 | 800 | $2,400 | $3.00 | 14d | 1 | 1.22mi |
| 848 Pacific Ave Unit 1014254P Atlantic City, NJ | 1.0–2.0 | 2.0–3.0 | 1243 | $2,413 | $1.94 | 14d | 2 | 1.34mi |
| 3636 Winchester Ave Atlantic City, NJ | 3.0 | 1.0 | 1094 | $1,995 | $1.82 | 22d | 1 | 1.37mi |
| 325 Atlantic Ave Unit 3 Atlantic City, NJ | 2.0 | 1.0 | 660 | $1,675 | $2.54 | 22d | 1 | 1.48mi |
| 351 N New Hampshire Ave Atlantic City, NJ | 2.0 | 2.0 | 972 | $1,948 | $2.00 | 14d | 3 | 1.49mi |
Listing history 29 events
-
2026-06-19days on market $179,900 Active 178 DOM
-
2026-06-18days on market $179,900 Active 177 DOM
-
2026-06-17days on market $179,900 Active 176 DOM
-
2026-06-16days on market $179,900 Active 175 DOM
-
2026-06-15days on market $179,900 Active 174 DOM
-
2026-06-14days on market $179,900 Active 172 DOM
-
2026-06-13days on market $179,900 Active 171 DOM
-
2026-06-10days on market $179,900 Active 169 DOM
-
2026-06-09days on market $179,900 Active 168 DOM
-
2026-06-08days on market $179,900 Active 167 DOM
-
2026-06-07days on market $179,900 Active 166 DOM
-
2026-06-02days on market $179,900 Active 161 DOM
-
2026-06-01days on market $179,900 Active 160 DOM
-
2026-05-31days on market $179,900 Active 159 DOM
-
2026-05-30days on market $179,900 Active 158 DOM
-
2026-05-11status Active 680-char remark
Show marketing remark (680 chars)
Turnkey Atlantic City Rental — Long-Term Tenants, Immediate Cash Flow. 1141 N Michigan Ave, Atlantic City, NJ. $1,750/month + utilities. Lease through 6/28/2026. Single-family home, tenant-occupied Recent upgrades: new flooring in living room, hallway and carpet in bedrooms! Recent CO approved, ready to sell! Well-performing rental with multi-year tenants, excellent payment history, and no maintenance or turnover required. Rent history available via RentRedi. This is a true plug-and-play investment for cash buyers, 1031 exchanges, or portfolio investors seeking stable income from day one. Selling due to outside financial obligations — not property performance.
-
2026-03-03historical Under Contract - Continue to Show 680-char remark
Show marketing remark (680 chars)
Turnkey Atlantic City Rental — Long-Term Tenants, Immediate Cash Flow. 1141 N Michigan Ave, Atlantic City, NJ. $1,750/month + utilities. Lease through 6/28/2026. Single-family home, tenant-occupied Recent upgrades: new flooring in living room, hallway and carpet in bedrooms! Recent CO approved, ready to sell! Well-performing rental with multi-year tenants, excellent payment history, and no maintenance or turnover required. Rent history available via RentRedi. This is a true plug-and-play investment for cash buyers, 1031 exchanges, or portfolio investors seeking stable income from day one. Selling due to outside financial obligations — not property performance.
-
2026-02-09price $179,900 680-char remark
Show marketing remark (680 chars)
Turnkey Atlantic City Rental — Long-Term Tenants, Immediate Cash Flow. 1141 N Michigan Ave, Atlantic City, NJ. $1,750/month + utilities. Lease through 6/28/2026. Single-family home, tenant-occupied Recent upgrades: new flooring in living room, hallway and carpet in bedrooms! Recent CO approved, ready to sell! Well-performing rental with multi-year tenants, excellent payment history, and no maintenance or turnover required. Rent history available via RentRedi. This is a true plug-and-play investment for cash buyers, 1031 exchanges, or portfolio investors seeking stable income from day one. Selling due to outside financial obligations — not property performance.
-
2026-01-08price $189,900 680-char remark
Show marketing remark (680 chars)
Turnkey Atlantic City Rental — Long-Term Tenants, Immediate Cash Flow. 1141 N Michigan Ave, Atlantic City, NJ. $1,750/month + utilities. Lease through 6/28/2026. Single-family home, tenant-occupied Recent upgrades: new flooring in living room, hallway and carpet in bedrooms! Recent CO approved, ready to sell! Well-performing rental with multi-year tenants, excellent payment history, and no maintenance or turnover required. Rent history available via RentRedi. This is a true plug-and-play investment for cash buyers, 1031 exchanges, or portfolio investors seeking stable income from day one. Selling due to outside financial obligations — not property performance.
-
2025-12-23$199,900 Active 680-char remark
Show marketing remark (680 chars)
Turnkey Atlantic City Rental — Long-Term Tenants, Immediate Cash Flow. 1141 N Michigan Ave, Atlantic City, NJ. $1,750/month + utilities. Lease through 6/28/2026. Single-family home, tenant-occupied Recent upgrades: new flooring in living room, hallway and carpet in bedrooms! Recent CO approved, ready to sell! Well-performing rental with multi-year tenants, excellent payment history, and no maintenance or turnover required. Rent history available via RentRedi. This is a true plug-and-play investment for cash buyers, 1031 exchanges, or portfolio investors seeking stable income from day one. Selling due to outside financial obligations — not property performance.
-
2025-07-20historical $900
-
2025-07-17$900
-
2024-06-06soldstatus $125,000
-
2024-05-29soldstatus $125,000 Sold 237-char remark
Show marketing remark (237 chars)
3 bedroom, 1 bathroom home in Atlantic City! Newer kitchen and spacious front and fenced in back yard. 2 car driveway and a screened in front porch. Purchase as a starter home or as a rental property. Call today to schedule your showing!
-
2024-05-21historical Under Contract 237-char remark
Show marketing remark (237 chars)
3 bedroom, 1 bathroom home in Atlantic City! Newer kitchen and spacious front and fenced in back yard. 2 car driveway and a screened in front porch. Purchase as a starter home or as a rental property. Call today to schedule your showing!
-
2023-12-08$135,000 Active 237-char remark
Show marketing remark (237 chars)
3 bedroom, 1 bathroom home in Atlantic City! Newer kitchen and spacious front and fenced in back yard. 2 car driveway and a screened in front porch. Purchase as a starter home or as a rental property. Call today to schedule your showing!
-
2018-10-02soldstatus $31,185 Sold
-
2018-09-12historical Under Contract
-
2018-08-31$33,000 Active
ⓘ Source: listings_history table (triggers on properties + properties_extension) + one-shot
backfill from property_details.listing_events for pre-trigger history.
Tax reassessment forecast NJ · Partial reset (capped growth)
- Current annual tax
- $1,555 · $130/mo
- Projected year-2 tax
- $3,017 · $251/mo
- Expected delta
- +$1,462/yr (+$122/mo · 94.1%)
ⓘ Screening estimate from a state-policy table — verify with the county assessor before closing.
Climate risk First Street
- Flood 9/10 Extreme FEMA zone AE · 99% chance over 30 yrs
- Wildfire 3/10 Moderate
- Heat 9/10 Extreme 7 d/yr ≥94°F today · 16 d/yr by 30 yrs out
- Wind 8/10 Severe 80% chance of damaging wind over 30 yrs
- Air quality 3/10 Moderate 2 unhealthy d/yr today · 3 by 30 yrs out
Nearby sold comps map
Loading sold comps map…
Walkable amenities ~0.75 mi
Loading nearby amenities…
Taxation est. · year 1
- Rental income
- $27,344
- − Mortgage interest
- −$10,077
- − Property taxes
- −$1,555
- − Insurance
- −$6,018
- − Repairs & maintenance
- −$2,187
- − Management
- −$2,187
- − Depreciation
- −$5,233
- Taxable income
- $85
- Est. tax owed @ 24.0%
- −$20
- After-tax cash flow
- $2,687/yr
For passive investors: Depreciation is non-cash, so a rental often shows a tax loss while cash-flowing — sheltering income. Rental losses are passive: they offset passive income freely, and up to $25,000/yr can offset ordinary (W-2) income if you actively participate and your MAGI is under $100k (phasing out to $0 by $150k); unused losses carry forward. On sale, claimed depreciation is recaptured at up to 25%, and gains may owe capital-gains tax (a 1031 exchange can defer both). Figures are a year-1 estimate at your 24.0% rate — not tax advice; consult a CPA.
Schools (NCES district)
- District
- Atlantic City School District
- NCES district ID
- 3400960
- Math proficiency
- 9% ▼ -12.00%
- Reading proficiency
- 26% ▼ -6.00%
- Median HH income
- $27,842
- Composite
- 13.66/100
- National rank
- #9504
- State rank
- #454 of 472 in NJ
Livability — Atlantic City
- Score
- 55/100
- State rank
- #525
- US rank
- #23095
Category grades
Schools grade is shown separately in the Schools card above.
Census & demographics
- Census place
- Atlantic City, NJ
- County
- Atlantic County · 143,611 people
- City population
- 38,925
- Metro
- Atlantic City-Hammonton, NJ
- Population (ZIP)
- 38,925
- Household income
- $41,126
- Rent vs Own
- Severe rent burden
- 3414.0
Population outlook (Atlantic County) Hauer SSP2
- Today (2025)
- 268,948 people
- By 2030
- 264,497 · -1.7%
- By 2040
- 252,261 · -6.2%
- By 2050
- 237,846 · -11.6%
- By 2075
- 210,650 · -21.7%
- By 2100
- 180,234 · -33.0%
Race, ethnicity, and origin ACS 2023
- Neighborhood character
- Highly diverse neighborhood (Simpson 0.75)
- Race & ethnicity
- Hispanic / Latino 32% Black 32% Asian 16% White 16% Two or more races 11% Native American 2%
- Hispanic origin (detail)
- Mexican 10% Puerto Rican 8% Dominican 8%
- Common ancestry
- Romanian 1% Scotch-Irish 1%
- Foreign-born
- 29% · Canada, Vietnam, Jamaica
- Languages at home
- 52% English-only · Spanish 30% Other Indo-European 8% Vietnamese 3%
Political lean MEDSL · Atlantic
- 2024 margin
- Toss-up / Even · D 47.7% · R 50.7% · Other 1.6%
- 2008→2024 swing
- -18.1pp toward R · 2008: 15.1pp · 2024: -3.0pp
- All cycles
- 2024: R+3.0 2020: D+6.7 2016: D+6.2 2012: D+17.2 2008: D+15.1
Not yet ingested
- Civics
- —
Market trends
- HPI YoY
- ▼ -26.82%
- Current HPI
- 353.7827
- Rent YoY
- ▲ 5.52%
- Metro
- Atlantic City-Hammonton, NJ
- State GDP YoY
- ▲ 2.05%
- F500 in state
- 34
Industry mix (Fortune 500 HQ in NJ)
| Industry | F500 HQs | Revenue |
|---|---|---|
| Consumer Goods | 3 | $31B |
|
||
| Pharmaceuticals | 2 | $153B |
|
||
| Technology | 2 | $21B |
|
||
| Insurance | 2 | $20B |
|
||
| Healthcare | 2 | $19B |
|
||
| Financial Services | 1 | $70B |
|
||
Price history
+445.2% since first listed14 events — show timeline
- 2026-05-11 Relisted — SJSRMLS
- 2026-03-03 Contingent — SJSRMLS
- 2026-02-09 Price Changed $179,900 SJSRMLS
- 2026-01-08 Price Changed $189,900 SJSRMLS
- 2025-12-23 Listed $199,900 SJSRMLS
- 2025-07-20 Rental Removed $900 SHOWMOJO
- 2025-07-17 Listed for Rent $900 SHOWMOJO
- 2024-06-06 Sold (Public Records) $125,000 Public Records
- 2024-05-29 Sold (MLS) $125,000 SJSRMLS
- 2024-05-21 Contingent — SJSRMLS
- 2023-12-08 Listed $135,000 SJSRMLS
- 2018-10-02 Sold (MLS) $31,185 SJSRMLS
- 2018-09-12 Contingent — SJSRMLS
- 2018-08-31 Listed $33,000 SJSRMLS
Property tax history
-10.9%/yrLatest (2025): $1,555 · -2.1% YoY. Source: county tax records.
Cash-flow waterfall
monthlySold comps — $/sqft
last 12 mo · ≤1 miLoading sold comps…