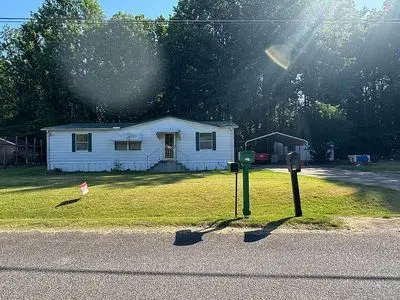
220 Blue Ridge St · Inman, SC
Flood risk 1/10 · Minimal
- FEMA flood zone
- X (unshaded)
- Chance of flooding over 30 yrs
- 0.0%
- Est. flood insurance / yr
- $507 – $1,088
Fire risk 4/10 · Minor
- Est. fire insurance / yr
- $783 – $1,453
Heat risk 5/10 · Moderate
- Hot days now (above 105°F)
- 7 days/yr
- Hot days in 30 yrs
- 17 days/yr
Wind risk 2/10 · Minimal
- Chance of severe wind over 30 yrs
- 1.0%
Air-quality risk 3/10 · Minor
- Unhealthy air days now
- 3 days/yr
- Unhealthy air days in 30 yrs
- 3 days/yr
Risk factors via First Street. Map © Google.
Why this score? — see what drove the B- grade
The composite is a weighted blend of 9 inputs, each scored 0–100. Each bar is that input's sub-score; the figure is the points it added to the 100-point composite (weight × sub-score).
- Cash flow +30.0/30.0
- DSCR +10.0/10.0
- ARV discount +7.5/15.0
- 1% rule +7.2/10.0
- Schools +4.1/10.0
- Livability +3.7/5.0
- Rent growth +2.9/5.0
- Condition / age +2.5/5.0
- Appreciation +0.0/10.0
$140,000
🖨 Deal sheet (PDF) 📄 Offer letter ✓ Due diligence
Listing remarks
For sale by owner. Brand new roof. Roof was put on last year. Washer and Dryer hookup ready. Refrigerator and stove is staying in the house. Sold as is.
Key facts
- Brand new roof
- Built 1982
- Listed 27 days
Tags
Neighborhood map
What this means for you Summary
Snapshot
- This is a 3-bed/2.0-bath manufactured listed at $140k.
Deal economics
- At list price, monthly cash flow is $524 ($6k/yr) — positive.
- The deal already cash-flows at list — no discount required.
- Meets the 1% rule at list price ($2k rent vs $140k).
- Recommended offer: $138k (1.5% below list) — sets the bar for market timing.
- Cap rate 10.8% vs local median 4.3% in Inman — top-decile yield for the area; either an underpriced asset or a hidden risk that comps aren't pricing in. Stress-test before assuming the spread holds.
Location & tenants
- Location reads 74/100 on livability (#29 in SC, #4,452 nationally) — a middle-class / working-renter tenant base. Strengths: cost of living A+, housing A+, health & safety A+; Watch: amenities D, commute F.
- Spartanburg 01 (rural): math 44% / reading 53% proficiency, ranked #14 of 80 in SC (top 18%) — families likely to look elsewhere, expect single-tenant / working-renter base with shorter leases.
- Market conditions: Rents rising (+1.8%/yr); 693 active listings in the ZIP; 1 comparable units currently listed for rent nearby; solid renter incomes; 3,129 units permitted in Spartanburg County in 2024 (40 in 5+ unit buildings).
Forward outlook
- Local home prices are declining (-3.0%/yr); year-one equity from $968 of loan paydown is wiped out by about $4k of value loss. Plan a longer hold.
- Spartanburg County population projected at +18% by 2050 — long-run rental-demand tailwind backs the buy-and-hold thesis.
- At projected returns (-3.0% appreciation + 1.8% rent growth), your $39k cash investment doubles in ~9 years — after that, you're playing with house money.
Negotiation context
- It's been on market 27 days — a 2% lower offer ($138k) is reasonable based on typical stale-listing flexibility.
- Current owner paid $45k; list at $140k implies a 211% gain — meaningful room to come down on a strong offer.
Risks & watch-outs
- Climate carrying-cost: extreme-heat days projected 7→17/yr by 2055 (HVAC capex compounding) — expect insurance premiums to compound above CPI over the hold.
Questions for the listing agent
- Is there a deadline driving the sale (1031 exchange, divorce, estate, relocation)? That informs how much negotiation room exists.
- What's the average days-on-market for RENTAL listings here right now (not sales)? A rising rental-DOM trend means longer vacancies and softer asking-rent achievability than the comps imply.
- What's the recent tenant-quality profile in this submarket — average credit score on applications, eviction rate, late-payment / NSF rate, and stable-employment percentage? A property-management company in the area should have these aggregated.
- How much new for-sale + rental construction is in the pipeline within 1–3 miles? Heavy new supply typically softens prices + rents 12–24 months out; constrained supply supports both.
Investment metrics
- 1% rule
- 1.22% ✓
- Cap rate
- 10.78%
- Cash-on-cash
- 16.03%
- DSCR
- 1.71
- GRM
- 6.8
CMA / ARV
No comps found within radius.
Projected returns pro-forma
-3.0% appreciation · 1.79% rent growth · sell at horizon
- IRR
- 5.7%
- Equity multiple
- 1.22×
- Total profit
- $8,551
- Equity at exit
- $20,874
- IRR
- 14.1%
- Equity multiple
- 2.07×
- Total profit
- $41,920
- Equity at exit
- $12,105
Cash invested: $39,200 (down + closing). Projections, not guarantees.
Landlord ↔ Tenant lean methodology
- Overall (STATE)
- 90 Strongly Landlord-Friendly
- State South Carolina
- 90 Strongly Landlord-Friendly · R+6
- County
- — inherits STATE
- City
- — inherits STATE
ZIP-level market 29349
- Home prices YoY
- -31.8%
- Rents YoY
- 1.8%
- Active inventory
- 693
- Price-to-rent
- 6.8×
Monthly cashflow live
- Estimated rent
- $1,706 medium interval (Pro) →
- Mortgage (P&I)
- −$734
- Tax from tax record
- −$32 /mo · $379/yr
- Insurance
- −$58
- HOA
- −$0
- Vacancy / Maint / Mgmt
- −$358
- Net cashflow
- $524
Break-even live
Sensitivity live
| Price | -10% $603 | -5% $563 | +0% $524 | +5% $484 | +10% $444 |
|---|---|---|---|---|---|
| Rent | -10% $389 | -5% $456 | +0% $524 | +5% $591 | +10% $658 |
| Rate | -1.0pp $594 | -0.5pp $559 | base $524 | +0.5pp $487 | +1.0pp $450 |
UW: 25.0% down · 7.5% · 30yr · 1.5% tax · 5.0% vac · 8.0% maint · 8.0% mgmt
Financing live
Cash to close
- Down payment
- $35,000
- Closing costs
- $4,200
- Reserves months
- —
- Total cash needed
- —
Loan-product check · same deal, 3 products live
Conventional
25% down · 7.5% · 30yr
- Down + closing
- —
- Monthly P&I
- —
- Monthly cashflow
- —
- DSCR
- —
- Eligible?
- —
Personal DTI + credit; lowest rate.
DSCR
20% down · 8.5% · 30yr
- Down + closing
- —
- Monthly P&I
- —
- Monthly cashflow
- —
- DSCR
- —
- Eligible?
- —
No personal income docs; deal must DSCR.
Hard money
10% down · 12.0% · 12mo
- Down + closing
- —
- Monthly P&I
- —
- Monthly cashflow
- —
- DSCR
- —
- Eligible?
- —
Short-term bridge; refi at stabilization.
Rent comps 1 comps
| Address | Beds | Baths | Sqft | Rent | $/sqft | DOM | Units | Dist |
|---|---|---|---|---|---|---|---|---|
| 14641 Asheville Hwy Inman, SC | 3.0 | 1.0 | 1414 | $1,595 | $1.13 | 24d | 1 | 1.27mi |
Listing history 16 events
-
2026-06-18days on market $140,000 Active 27 DOM
-
2026-06-17days on market $140,000 Active 26 DOM
-
2026-06-16days on market $140,000 Active 25 DOM
-
2026-06-15days on market $140,000 Active 24 DOM
-
2026-06-13days on market $140,000 Active 22 DOM
-
2026-06-10days on market $140,000 Active 19 DOM
-
2026-06-09days on market $140,000 Active 18 DOM
-
2026-06-08days on market $140,000 Active 17 DOM
-
2026-06-07days on market $140,000 Active 16 DOM
-
2026-06-03days on market $140,000 Active 12 DOM
-
2026-06-03days on market $140,000 Active 11 DOM
-
2026-06-01days on market $140,000 Active 10 DOM
-
2026-05-31days on market $140,000 Active 9 DOM
-
2026-05-23$140,000 Active
-
2013-11-07soldstatus $45,000
-
1990-04-01soldstatus $38,000
ⓘ Source: listings_history table (triggers on properties + properties_extension) + one-shot
backfill from property_details.listing_events for pre-trigger history.
Tax reassessment forecast SC · Resets to sale price
- Current annual tax
- $379 · $32/mo
- Projected year-2 tax
- $798 · $66/mo
- Expected delta
- +$419/yr (+$35/mo · 110.8%)
ⓘ Screening estimate from a state-policy table — verify with the county assessor before closing.
Climate risk First Street
- Flood 1/10 Low FEMA zone X (unshaded) · 0% chance over 30 yrs
- Wildfire 4/10 Moderate
- Heat 5/10 Major 7 d/yr ≥105°F today · 17 d/yr by 30 yrs out
- Wind 2/10 Low 100% chance of damaging wind over 30 yrs
- Air quality 3/10 Moderate 3 unhealthy d/yr today · 3 by 30 yrs out
Nearby sold comps map
Loading sold comps map…
Walkable amenities ~0.75 mi
Loading nearby amenities…
Taxation est. · year 1
- Rental income
- $20,472
- − Mortgage interest
- −$7,842
- − Property taxes
- −$379
- − Insurance
- −$700
- − Repairs & maintenance
- −$1,638
- − Management
- −$1,638
- − Depreciation
- −$4,073
- Taxable income
- $4,203
- Est. tax owed @ 24.0%
- −$1,009
- After-tax cash flow
- $5,275/yr
For passive investors: Depreciation is non-cash, so a rental often shows a tax loss while cash-flowing — sheltering income. Rental losses are passive: they offset passive income freely, and up to $25,000/yr can offset ordinary (W-2) income if you actively participate and your MAGI is under $100k (phasing out to $0 by $150k); unused losses carry forward. On sale, claimed depreciation is recaptured at up to 25%, and gains may owe capital-gains tax (a 1031 exchange can defer both). Figures are a year-1 estimate at your 24.0% rate — not tax advice; consult a CPA.
Schools (NCES district)
- District
- Spartanburg 01
- NCES district ID
- 4503480
- Math proficiency
- 44% ▼ -11.00%
- Reading proficiency
- 53% ▼ -1.00%
- Median HH income
- $44,612
- Composite
- 41.0/100
- National rank
- #3590
- State rank
- #14 of 80 in SC
Livability — Inman
- Score
- 74/100
- State rank
- #29
- US rank
- #4452
Category grades
Schools grade is shown separately in the Schools card above.
Census & demographics
- County
- Spartanburg County · 258,607 people
- City population
- 39,083
- Metro
- Spartanburg, SC
- Population (ZIP)
- 39,083
- Household income
- $76,168
- Rent vs Own
- Severe rent burden
- 271.0
Population outlook (Spartanburg County) Hauer SSP2
- Today (2025)
- 325,495 people
- By 2030
- 338,800 · +4.1%
- By 2040
- 363,471 · +11.7%
- By 2050
- 384,156 · +18.0%
- By 2075
- 430,137 · +32.1%
- By 2100
- 442,733 · +36.0%
Race, ethnicity, and origin ACS 2023
- Neighborhood character
- Predominantly White (80%)
- Race & ethnicity
- White 80% Black 9% Hispanic / Latino 6% Two or more races 4% Asian 2%
- Hispanic origin (detail)
- Mexican 5%
- Common ancestry
- Subsaharan African 6% Serbian 3% Scotch-Irish 3%
- Foreign-born
- 9% · Canada
- Languages at home
- 86% English-only · Russian/Polish/Slavic 7% Spanish 3% Other Asian/Pacific 2%
Political lean MEDSL · Spartanburg
- 2024 margin
- Solid R (+33.6) · D 32.6% · R 66.2% · Other 1.2%
- 2008→2024 swing
- -12.0pp toward R · 2008: -21.6pp · 2024: -33.6pp
- All cycles
- 2024: R+33.6 2020: R+27.3 2016: R+30.0 2012: R+23.1 2008: R+21.6
Not yet ingested
- Civics
- —
Market trends
- HPI YoY
- ▼ -113.67%
- Current HPI
- 244.0359
- Rent YoY
- ▲ 1.79%
- Metro
- Spartanburg, SC
- State GDP YoY
- ▲ 4.51%
- F500 in state
- 2
Industry mix (Fortune 500 HQ in SC)
| Industry | F500 HQs | Revenue |
|---|---|---|
| Packaging | 1 | $7B |
|
||
Price history
+268.4% since first listed3 events — show timeline
- 2026-05-23 Listed $140,000 FSBO.com
- 2013-11-07 Sold (Public Records) $45,000 Public Records
- 1990-04-01 Sold (Public Records) $38,000 Public Records
Property tax history
-0.1%/yrLatest (2025): $379 · +2.7% YoY. Source: county tax records.
Cash-flow waterfall
monthlySold comps — $/sqft
last 12 mo · ≤1 miLoading sold comps…