 Duplex
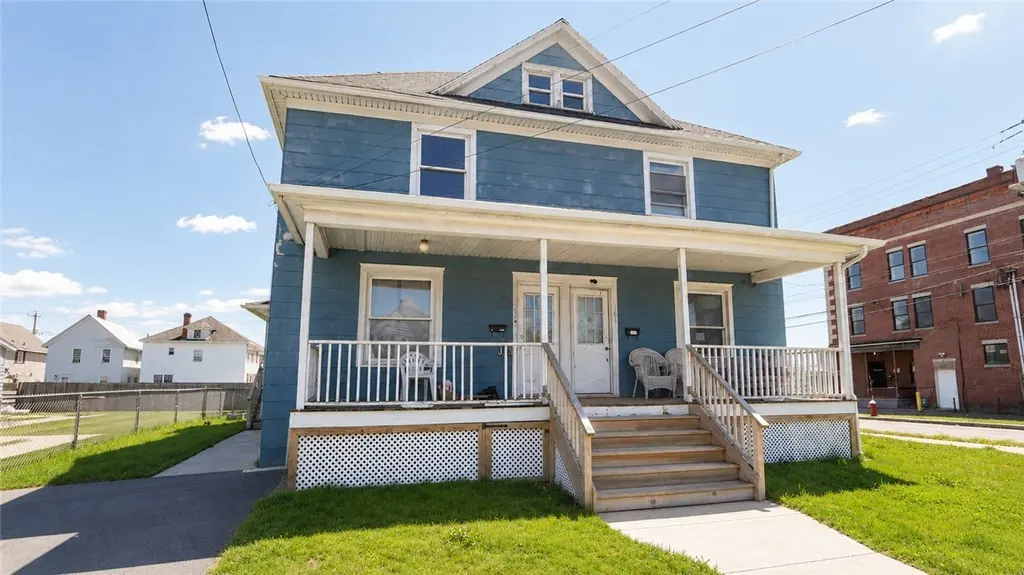
161-163 Exchange St · Geneva, NY
Flood risk 1/10 · Minimal
- FEMA flood zone
- X
- Chance of flooding over 30 yrs
- 0.0%
- Est. flood insurance / yr
- $473 – $860
Fire risk 3/10 · Minor
- Est. fire insurance / yr
- $691 – $1,283
Heat risk 3/10 · Minor
- Hot days now (above 97°F)
- 7 days/yr
- Hot days in 30 yrs
- 16 days/yr
Wind risk 1/10 · Minimal
- Chance of severe wind over 30 yrs
- —
Air-quality risk 2/10 · Minimal
- Unhealthy air days now
- 0 days/yr
- Unhealthy air days in 30 yrs
- 1 days/yr
Risk factors via First Street. Map © Google.
Why this score? — see what drove the B+ grade
The composite is a weighted blend of 9 inputs, each scored 0–100. Each bar is that input's sub-score; the figure is the points it added to the 100-point composite (weight × sub-score).
- Cash flow +30.0/30.0
- ARV discount +15.0/15.0
- 1% rule +10.0/10.0
- DSCR +10.0/10.0
- Livability +3.9/5.0
- Schools +3.3/10.0
- Rent growth +2.5/5.0
- Condition / age +2.5/5.0
- Appreciation +0.0/10.0
$119,000
🖨 Deal sheet (PDF) 📄 Offer letter ✓ Due diligence
Multi-family units
County records classify this as Multi-Family (2-4 Unit). Listing-text estimate: 2 units. confirmed
Listing remarks
Two-family home located in the City of Geneva just a short walk from downtown shops, restaurants, and beautiful Seneca Lake. Each spacious apartment features a two-story layout with three bedrooms, one full bathroom, eat-in kitchen, dining room, and comfortable living room. Both units offer nice character and convenient front and side entrances. This property is an excellent opportunity for owner-occupants or investors alike.
Key facts
- Eat in kitchen
- Dining room
- Two family home
Tags
Property features AI
Finance
- Other: Operating expenses: see remarks
- Financial info: Owner pays trash collection and water; Rent includes trash collection and water; Unit 1 rent: $850; Unit 2 rent: $750; Two separate gas meters and two separate electric meters
Exterior
- Parking: Paved parking with two or more spaces
- Utilities: Public water connected; Sewer connected
- Home design: 2-story building; Existing/resale property
- Construction: Construction details: see remarks
- Exterior features: Rectangular residential lot; City street frontage; Lot dimensions approximately 51 x 43
Interior
- Kitchen: Each unit includes an eat-in kitchen
- Bedrooms: Two 3-bedroom units
- Flooring: Carpet; Hardwood; Varies
- Bathrooms: Each unit has 1 full bathroom (2 full bathrooms total)
- Heating & cooling: Gas forced-air heating
- Interior features: Full basement
- Laundry & utility: Gas water heater
Neighborhood map
What this means for you Summary
Snapshot
- This is a 2 × 3-bed/1.0-bath units multifamily listed at $119k.
Deal economics
- At list price, monthly cash flow is $2k ($19k/yr) — positive. Per door: $795/mo.
- The deal already cash-flows at list — no discount required.
- Meets the 1% rule at list price ($3k rent vs $119k).
- Cap rate 22.3% vs local median 5.0% in Geneva — top-decile yield for the area; either an underpriced asset or a hidden risk that comps aren't pricing in. Stress-test before assuming the spread holds.
Location & tenants
- Location reads 78/100 on livability (#177 in NY, #2,760 nationally) — a middle-class / working-renter tenant base. Strengths: cost of living A+, housing A+, health & safety A+; Watch: crime D+, employment D, amenities F.
- Geneva City School District (town): math 36% / reading 43% proficiency, ranked #528 of 590 in NY (top 90%) — families likely to look elsewhere, expect single-tenant / working-renter base with shorter leases.
- Zoned schools: North Street Elementary School (math 28% / reading 35%, grade F, #1,679 of 2,108 statewide, top 80%, 595 students, 75% FRL); Geneva Middle School (math 21% / reading 42%, grade F, #522 of 729 statewide, top 73%, 452 students, 68% FRL); Geneva High School (math 92% / reading 98%, grade A+, #93 of 1,100 statewide, top 10%, 613 students, 63% FRL) — zoned schools average 69% FRL vs 51% district-wide (17 pts higher); higher-poverty schools than district average — tighter screening recommended.
- Zoned-school proficiency averages 53% at this address vs 40% district-wide (+13 pts) — the actual schools serving this property are materially stronger than the Geneva City School District average implies; a family-tenant draw the district grade alone would hide.
- Market conditions: 123 active listings in the ZIP; 284 units permitted in Ontario County in 2024 (69 in 5+ unit buildings).
Forward outlook
- Local home prices are declining (-3.0%/yr); year-one equity from $823 of loan paydown is wiped out by about $4k of value loss. Plan a longer hold.
- Ontario County population projected to shrink 6% by 2050 — rents likely to lag national; underwrite the cash flow, not the appreciation.
- At projected returns (-3.0% appreciation + 3.0% rent growth), your $33k cash investment doubles in ~2 years — after that, you're playing with house money.
Negotiation context
- Only 4 days on market — expect competitive offers; lowballing is unlikely to land.
- Current owner paid $85k; 40% above their basis — modest negotiation headroom, anchor on the comps not their cost.
Risks & watch-outs
- Watch-outs: property tax is 2.9% of price; built in 1918 — expect roof / HVAC / electrical / plumbing capex.
Questions for the listing agent
- Can we see the unit-by-unit rent roll, current vacancy, and any below-market leases? What's the average tenancy length?
- What capital expenditures (roof, boiler, parking lot, exteriors) have been made in the last 5 years, and what's planned in the next 2?
- Built in 1918 — when were the roof, HVAC, electrical panel, plumbing, and water heater last replaced?
- Property tax is high relative to price — has the assessment been appealed recently, and will the sale trigger a re-assessment?
- Is there a deadline driving the sale (1031 exchange, divorce, estate, relocation)? That informs how much negotiation room exists.
- Schools are D-rated, which usually means shorter tenancies and higher turnover. Who's the typical renter profile here, and what's been the actual vacancy rate?
- Crime grade is D in this area — have there been break-ins, vandalism, or insurance claims at this property in the last 3 years? What carrier currently insures it and at what premium?
- What's the average days-on-market for RENTAL listings here right now (not sales)? A rising rental-DOM trend means longer vacancies and softer asking-rent achievability than the comps imply.
- What's the recent tenant-quality profile in this submarket — average credit score on applications, eviction rate, late-payment / NSF rate, and stable-employment percentage? A property-management company in the area should have these aggregated.
- How much new apartment / multifamily construction is in the pipeline within 1–3 miles? Heavy new supply (>2% of stock underway) typically softens rents 12–24 months out; light construction supports rent growth.
Investment metrics
- 1% rule
- 2.71% ✓
- Cap rate
- 22.34%
- Cash-on-cash
- 57.30%
- DSCR
- 3.55
- GRM
- 3.1
CMA / ARV
- ARV (median comp)
- $217,023
- List price
- $119,000
- Delta
- -45.17%
- Verdict
- UNDERPRICED
- Comps
- 20 within 1.0 mi
Show comp detail 2 sales within ~0.75 mi
| Address | Dist | Beds/Ba | Sqft | Sold | Price | $/sf | Match |
|---|---|---|---|---|---|---|---|
| 213 N Main St | 0.43mi | 6/2.0 | 2,214 (-1%) | 1mo | $149,900 | $68 | 77 |
| 159 Genesee St | 0.29mi | 5/3.0 (-1) | 2,320 (+3%) | 23mo | $163,000 | $70 | 53 |
Match score weights: distance 35% · size 25% · config 20% · recency 20%. Top-matched comps best support the ARV.
Projected returns pro-forma
-3.0% appreciation · 3.0% rent growth · sell at horizon
- IRR
- 55.8%
- Equity multiple
- 3.47×
- Total profit
- $82,178
- Equity at exit
- $17,743
- IRR
- 60.8%
- Equity multiple
- 7.08×
- Total profit
- $202,572
- Equity at exit
- $10,289
Cash invested: $33,320 (down + closing). Projections, not guarantees.
Landlord ↔ Tenant lean methodology
- Overall (STATE)
- 15 Strongly Tenant-Friendly
- State New York
- 15 Strongly Tenant-Friendly · D+10
- County
- — inherits STATE
- City
- — inherits STATE
ZIP-level market 14456
- Home prices YoY
- -15.8%
- Active inventory
- 123
- Price-to-rent
- 6.1×
Monthly cashflow live
- Estimated rent
- $3,226 medium interval (Pro) →
- Mortgage (P&I)
- −$624
- Tax from tax record
- −$284 /mo · $3,407/yr
- Insurance
- −$50
- HOA
- −$0
- Vacancy / Maint / Mgmt
- −$677
- Net cashflow
- $1,591
Break-even live
Sensitivity live
| Price | -10% $1,658 | -5% $1,625 | +0% $1,591 | +5% $1,557 | +10% $1,524 |
|---|---|---|---|---|---|
| Rent | -10% $1,336 | -5% $1,464 | +0% $1,591 | +5% $1,718 | +10% $1,846 |
| Rate | -1.0pp $1,651 | -0.5pp $1,621 | base $1,591 | +0.5pp $1,560 | +1.0pp $1,529 |
2-unit breakdown (identical units grouped — click to expand)
| Units | Beds | Baths | Est. rent |
|---|---|---|---|
| 2× units | 3 | 1 | $3,226 |
| #1 | 3 | 1 | $1,613 |
| #2 | 3 | 1 | $1,613 |
| Total (2 units) | $3,226 | ||
UW: 25.0% down · 7.5% · 30yr · 1.5% tax · 5.0% vac · 8.0% maint · 8.0% mgmt
Financing live
Cash to close
- Down payment
- $29,750
- Closing costs
- $3,570
- Reserves months
- —
- Total cash needed
- —
Loan-product check · same deal, 3 products live
Conventional
25% down · 7.5% · 30yr
- Down + closing
- —
- Monthly P&I
- —
- Monthly cashflow
- —
- DSCR
- —
- Eligible?
- —
Personal DTI + credit; lowest rate.
DSCR
20% down · 8.5% · 30yr
- Down + closing
- —
- Monthly P&I
- —
- Monthly cashflow
- —
- DSCR
- —
- Eligible?
- —
No personal income docs; deal must DSCR.
Hard money
10% down · 12.0% · 12mo
- Down + closing
- —
- Monthly P&I
- —
- Monthly cashflow
- —
- DSCR
- —
- Eligible?
- —
Short-term bridge; refi at stabilization.
Listing history 3 events
-
2026-05-15$119,000 Active 429-char remark
-
2021-03-29soldstatus $85,000
-
2010-05-27soldstatus $45,000
ⓘ Source: listings_history table (triggers on properties + properties_extension) + one-shot
backfill from property_details.listing_events for pre-trigger history.
Tax reassessment forecast NY · Partial reset (capped growth)
- Current annual tax
- $3,407 · $284/mo
- Projected year-2 tax
- $3,407 · $284/mo
- Expected delta
- $0/yr ($0/mo · 0.0%)
ⓘ Screening estimate from a state-policy table — verify with the county assessor before closing.
Climate risk First Street
- Flood 1/10 Low FEMA zone X · 0% chance over 30 yrs
- Wildfire 3/10 Moderate
- Heat 3/10 Moderate 7 d/yr ≥97°F today · 16 d/yr by 30 yrs out
- Wind 1/10 Low
- Air quality 2/10 Low 0 unhealthy d/yr today · 1 by 30 yrs out
Nearby sold comps map
Loading sold comps map…
Walkable amenities ~0.75 mi
Loading nearby amenities…
Taxation est. · year 1
- Rental income
- $38,712
- − Mortgage interest
- −$6,666
- − Property taxes
- −$3,407
- − Insurance
- −$595
- − Repairs & maintenance
- −$3,097
- − Management
- −$3,097
- − Depreciation
- −$3,462
- Taxable income
- $18,388
- Est. tax owed @ 24.0%
- −$4,413
- After-tax cash flow
- $14,678/yr
For passive investors: Depreciation is non-cash, so a rental often shows a tax loss while cash-flowing — sheltering income. Rental losses are passive: they offset passive income freely, and up to $25,000/yr can offset ordinary (W-2) income if you actively participate and your MAGI is under $100k (phasing out to $0 by $150k); unused losses carry forward. On sale, claimed depreciation is recaptured at up to 25%, and gains may owe capital-gains tax (a 1031 exchange can defer both). Figures are a year-1 estimate at your 24.0% rate — not tax advice; consult a CPA.
Schools (NCES district)
- District
- Geneva City School District
- NCES district ID
- 3611970
- Math proficiency
- 36% ▲ 3.00%
- Reading proficiency
- 43% ▲ 11.00%
- Median HH income
- $44,012
- Composite
- 33.48/100
- National rank
- #5448
- State rank
- #528 of 590 in NY
Livability — Geneva
- Score
- 78/100
- State rank
- #177
- US rank
- #2760
Category grades
Schools grade is shown separately in the Schools card above.
Census & demographics
- Census place
- Geneva, NY
- Population (ZIP)
- 19,864
Population outlook (Ontario County) Hauer SSP2
- Today (2025)
- 111,230 people
- By 2030
- 111,401 · +0.2%
- By 2040
- 109,535 · -1.5%
- By 2050
- 104,895 · -5.7%
- By 2075
- 92,999 · -16.4%
- By 2100
- 73,723 · -33.7%
Race, ethnicity, and origin ACS 2023
- Neighborhood character
- Predominantly White (75%)
- Race & ethnicity
- White 75% Hispanic / Latino 13% Two or more races 7% Black 6% Asian 2%
- Hispanic origin (detail)
- Mexican 2% Puerto Rican 9%
- Common ancestry
- Iranian 5% Slovak 3% Italian 2%
- Foreign-born
- 6% · Canada, China
- Languages at home
- 87% English-only · Spanish 7% Other Indo-European 2% German/W. Germanic 1%
Political lean MEDSL · Ontario
- 2024 margin
- Toss-up / Even · D 49.4% · R 50.6%
- 2008→2024 swing
- -1.0pp toward R · 2008: -0.1pp · 2024: -1.2pp
- All cycles
- 2024: R+1.2 2020: R+0.0 2016: R+8.6 2012: R+1.6 2008: R+0.1
Not yet ingested
- Civics
- —
Market trends
- HPI YoY
- ▼ -57.56%
- Current HPI
- 307.9168
- Rent YoY
- —
- Metro
- —
- State GDP YoY
- ▲ 2.60%
- F500 in state
- 92
Industry mix (Fortune 500 HQ in NY)
| Industry | F500 HQs | Revenue |
|---|---|---|
| Financial Services | 10 | $950B |
|
||
| Consumer Goods | 9 | $162B |
|
||
| Insurance | 4 | $225B |
|
||
| Telecommunications | 2 | $144B |
|
||
| Pharmaceuticals | 2 | $112B |
|
||
| Media / Entertainment | 2 | $69B |
|
||
Price history
+164.4% since first listed4 events — show timeline
- 2026-05-20 Pending — UNYREIS
- 2026-05-15 Listed $119,000 UNYREIS
- 2021-03-29 Sold (Public Records) $85,000 Public Records
- 2010-05-27 Sold (Public Records) $45,000 Public Records
Property tax history
+10.7%/yrLatest (2025): $3,407 · +2.7% YoY. Source: county tax records.
Cash-flow waterfall
monthlySold comps — $/sqft
last 12 mo · ≤1 miLoading sold comps…