3804 NW 14th St Unit 1/2 · Oklahoma City, OK
Flood risk 1/10 · Minimal
- FEMA flood zone
- X (unshaded)
- Chance of flooding over 30 yrs
- 0.0%
- Est. flood insurance / yr
- $507 – $1,088
Fire risk 1/10 · Minimal
- Est. fire insurance / yr
- $2,463 – $4,575
Heat risk 5/10 · Moderate
- Hot days now (above 107°F)
- 7 days/yr
- Hot days in 30 yrs
- 17 days/yr
Wind risk 2/10 · Minimal
- Chance of severe wind over 30 yrs
- 3.0%
Air-quality risk 2/10 · Minimal
- Unhealthy air days now
- 1 days/yr
- Unhealthy air days in 30 yrs
- 2 days/yr
Risk factors via First Street. Map © Google.
Why this score? — see what drove the B- grade
The composite is a weighted blend of 9 inputs, each scored 0–100. Each bar is that input's sub-score; the figure is the points it added to the 100-point composite (weight × sub-score).
- Cash flow +30.0/30.0
- 1% rule +10.0/10.0
- DSCR +10.0/10.0
- ARV discount +7.5/15.0
- Rent growth +4.3/5.0
- Livability +4.0/5.0
- Condition / age +2.5/5.0
- Schools +0.7/10.0
- Appreciation +0.0/10.0
$30,000
🖨 Deal sheet (PDF) 📄 Offer letter ✓ Due diligence
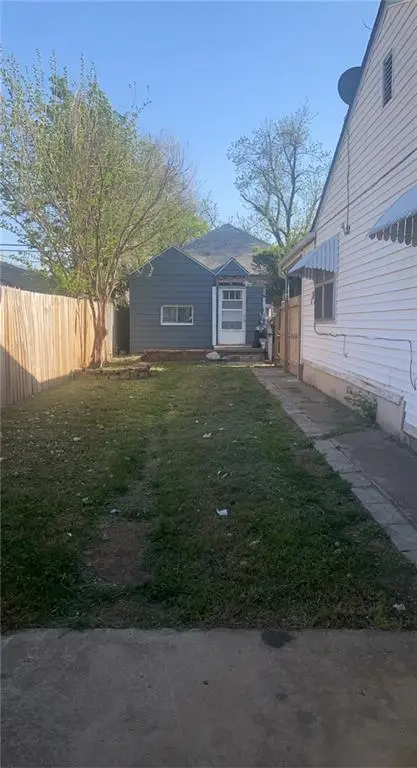
Listing remarks
Investment Fixer-Upper Property to be sold AS-IS. Property can be a 2 bedroom & home is a 1/2 house behind another house with Shared Driveways, & needs TLC work. Backyard Fence will be fixed by owner to who ever Purchases the property. Property is near Highway I-44 with easy access.
Key facts
- 2,073 sq ft lot
- Built 1936
- Listed 2 days
Neighborhood map
What this means for you Summary
Snapshot
- This is a 1-bed/1.0-bath single-family listed at $30k.
Deal economics
- At list price, monthly cash flow is $440 ($5k/yr) — positive.
- The deal already cash-flows at list — no discount required.
- Meets the 1% rule at list price ($814 rent vs $30k).
- Cap rate 23.9% vs local median 3.7% in Oklahoma City — top-decile yield for the area; either an underpriced asset or a hidden risk that comps aren't pricing in. Stress-test before assuming the spread holds.
Location & tenants
- Location reads 80/100 on livability (#3 in OK, #1,635 nationally) — a professional / high-income tenant draw. Strengths: amenities A+, commute A+, cost of living A+; Watch: crime F.
- Oklahoma City (urban): math 7% / reading 10% proficiency, ranked #254 of 270 in OK (top 94%) — low school quality limits family demand, transient renter base, plan for 1-2y turnover; 82% free/reduced lunch — lower-income household profile, screen leases tightly.
- Zoned schools: Buchanan Es (math 2% / reading 2%, grade F, #802 of 845 statewide, top 100%, 479 students, 0% FRL); Taft Ms (math 2% / reading 5%, grade F, #330 of 345 statewide, top 96%, 1,045 students, 0% FRL); Northwest Classen Hs (math 5% / reading 10%, grade F, #420 of 447 statewide, top 95%, 1,702 students, 0% FRL) — zoned schools average 0% FRL vs 82% district-wide (82 pts lower); this property's tenant base skews higher-income than the district average.
- Market conditions: Rents rising fast (+7.3%/yr); 221 active listings in the ZIP; 19 comparable units currently listed for rent nearby; rentals at typical pace (median 16d on market — plan ~3-4 weeks tenant-placement turnaround); 5,365 units permitted in Oklahoma County in 2024 (569 in 5+ unit buildings).
- This rent is only 17% of the median local income ($57k/yr) — well below the 30% rent-burden line; pricing power to push rent on renewal without tenant pushback.
Forward outlook
- Local home prices are declining (-3.0%/yr); year-one equity from $207 of loan paydown is wiped out by about $900 of value loss. Plan a longer hold.
- Oklahoma County population projected at +41% by 2050 — long-run rental-demand tailwind backs the buy-and-hold thesis.
- At projected returns (-3.0% appreciation + 7.3% rent growth), your $8k cash investment doubles in ~2 years — after that, you're playing with house money.
Negotiation context
- Only 2 days on market — expect competitive offers; lowballing is unlikely to land.
Risks & watch-outs
- Watch-outs: built in 1936 — expect roof / HVAC / electrical / plumbing capex.
- Climate carrying-cost: extreme-heat days projected 7→17/yr by 2055 (HVAC capex compounding) — expect insurance premiums to compound above CPI over the hold.
Questions for the listing agent
- Built in 1936 — when were the roof, HVAC, electrical panel, plumbing, and water heater last replaced?
- Is there a deadline driving the sale (1031 exchange, divorce, estate, relocation)? That informs how much negotiation room exists.
- Schools are F-rated, which usually means shorter tenancies and higher turnover. Who's the typical renter profile here, and what's been the actual vacancy rate?
- Crime grade is F in this area — have there been break-ins, vandalism, or insurance claims at this property in the last 3 years? What carrier currently insures it and at what premium?
- What's the average days-on-market for RENTAL listings here right now (not sales)? A rising rental-DOM trend means longer vacancies and softer asking-rent achievability than the comps imply.
- What's the recent tenant-quality profile in this submarket — average credit score on applications, eviction rate, late-payment / NSF rate, and stable-employment percentage? A property-management company in the area should have these aggregated.
- How much new for-sale + rental construction is in the pipeline within 1–3 miles? Heavy new supply typically softens prices + rents 12–24 months out; constrained supply supports both.
Investment metrics
- 1% rule
- 2.71% ✓
- Cap rate
- 23.90%
- Cash-on-cash
- 62.90%
- DSCR
- 3.80
- GRM
- 3.1
CMA / ARV
No comps found within radius.
Projected returns pro-forma
-3.0% appreciation · 7.29% rent growth · sell at horizon
- IRR
- 66.7%
- Equity multiple
- 4.20×
- Total profit
- $26,856
- Equity at exit
- $4,473
- IRR
- 72.3%
- Equity multiple
- 10.04×
- Total profit
- $75,969
- Equity at exit
- $2,594
Cash invested: $8,400 (down + closing). Projections, not guarantees.
Landlord ↔ Tenant lean methodology
- Overall (STATE)
- 83 Strongly Landlord-Friendly
- State Oklahoma
- 83 Strongly Landlord-Friendly · R+20
- County
- — inherits STATE
- City
- — inherits STATE
ZIP-level market 73107
- Rents YoY
- 7.3%
- Active inventory
- 221
- Price-to-rent
- 3.1×
Monthly cashflow live
- Estimated rent
- $814 high interval (Pro) →
- Mortgage (P&I)
- −$157
- Tax from tax record
- −$33 /mo · $397/yr
- Insurance
- −$12
- HOA
- −$0
- Vacancy / Maint / Mgmt
- −$171
- Net cashflow
- $440
Break-even live
Sensitivity live
| Price | -10% $457 | -5% $449 | +0% $440 | +5% $432 | +10% $423 |
|---|---|---|---|---|---|
| Rent | -10% $376 | -5% $408 | +0% $440 | +5% $472 | +10% $505 |
| Rate | -1.0pp $455 | -0.5pp $448 | base $440 | +0.5pp $433 | +1.0pp $425 |
UW: 25.0% down · 7.5% · 30yr · 1.5% tax · 5.0% vac · 8.0% maint · 8.0% mgmt
Financing live
Cash to close
- Down payment
- $7,500
- Closing costs
- $900
- Reserves months
- —
- Total cash needed
- —
Loan-product check · same deal, 3 products live
Conventional
25% down · 7.5% · 30yr
- Down + closing
- —
- Monthly P&I
- —
- Monthly cashflow
- —
- DSCR
- —
- Eligible?
- —
Personal DTI + credit; lowest rate.
DSCR
20% down · 8.5% · 30yr
- Down + closing
- —
- Monthly P&I
- —
- Monthly cashflow
- —
- DSCR
- —
- Eligible?
- —
No personal income docs; deal must DSCR.
Hard money
10% down · 12.0% · 12mo
- Down + closing
- —
- Monthly P&I
- —
- Monthly cashflow
- —
- DSCR
- —
- Eligible?
- —
Short-term bridge; refi at stabilization.
Rent comps 19 comps
| Address | Beds | Baths | Sqft | Rent | $/sqft | DOM | Units | Dist |
|---|---|---|---|---|---|---|---|---|
| 3403 NW 17th St Unit B Oklahoma City, OK | 1.0 | 1.0 | 572 | $1,050 | $1.84 | 45d | 1 | 0.54mi |
| 4220 NW 10th St Unit 28A Oklahoma City, OK | 1.0 | 1.0 | 680 | $715 | $1.05 | 25d | 1 | 0.67mi |
| 4220 NW 10th St Oklahoma City, OK | 1.0–2.0 | 1.0 | 730 | $710 | $0.97 | 6d | 11 | 0.67mi |
| 4220 NW 10th St Unit 15G Oklahoma City, OK | 1.0 | 1.0 | 600 | $710 | $1.18 | 25d | 1 | 0.67mi |
| 4220 NW 10th St Unit 20B Oklahoma City, OK | — | 1.0 | 450 | $615 | $1.37 | 25d | 1 | 0.67mi |
| 3224 NW 13th St Oklahoma City, OK | 2.0 | 1.0 | 640 | $900 | $1.41 | 16d | 1 | 0.71mi |
| 3205 NW 14th St Unit b Oklahoma City, OK | 1.0 | 1.0 | 613 | $850 | $1.39 | 5d | 1 | 0.75mi |
| 3114 NW 12th St Unit 1 Oklahoma City, OK | 1.0 | 1.0 | 567 | $795 | $1.40 | 5d | 1 | 0.89mi |
| 1309 N Meridian Ave Oklahoma City, OK | 1.0–2.0 | 1.0–1.5 | 925 | $630 | $0.68 | 4d | 4 | 0.92mi |
| 800 N Meridian Ave Oklahoma City, OK | 1.0–3.0 | 1.0–2.0 | 912 | $659 | $0.72 | 25d | 1 | 1.01mi |
| 800 N Meridian Ave Oklahoma City, OK | 1.0 | 1.0 | 525 | $749 | $1.43 | 6d | 1 | 1.01mi |
| 2946 NW 13th St Oklahoma City, OK | 1.0 | 1.0 | 624 | $725 | $1.16 | 13d | 1 | 1.03mi |
| 2832 N Woodward Ave Oklahoma City, OK | — | 1.0 | 400 | $995 | $2.49 | 45d | 1 | 1.11mi |
| 3033 N Grand Blvd Oklahoma City, OK | 1.0 | 1.0 | 672 | $675 | $1.00 | 3d | 1 | 1.16mi |
| 3175 N Portland Ave Oklahoma City, OK | 1.0–2.0 | 1.0–2.0 | 809 | $834 | $1.03 | 17d | 3 | 1.21mi |
| 3175 N Portland Ave Oklahoma City, OK | 1.0 | 1.0 | 700 | $834 | $1.19 | 16d | 1 | 1.21mi |
| 4746 NW 23rd St Oklahoma City, OK | 1.0 | 1.0 | 740 | $635 | $0.86 | 5d | 1 | 1.27mi |
| 2943 Pioneer Ave Unit 2943 Oklahoma City, OK | 1.0 | 1.0 | 643 | $895 | $1.39 | 4d | 1 | 1.41mi |
| 2645 NW 13th St Unit A Oklahoma City, OK | 1.0 | 1.0 | 700 | $600 | $0.86 | 23d | 1 | 1.42mi |
Listing history 3 events
-
2022-09-20status Pending
-
2022-04-23status Pending
-
2022-04-21$30,000 Active
ⓘ Source: listings_history table (triggers on properties + properties_extension) + one-shot
backfill from property_details.listing_events for pre-trigger history.
Tax reassessment forecast OK · Resets to sale price
- Current annual tax
- $397 · $33/mo
- Projected year-2 tax
- $397 · $33/mo
- Expected delta
- $0/yr ($0/mo · 0.0%)
ⓘ Screening estimate from a state-policy table — verify with the county assessor before closing.
Climate risk First Street
- Flood 1/10 Low FEMA zone X (unshaded) · 0% chance over 30 yrs
- Wildfire 1/10 Low
- Heat 5/10 Major 7 d/yr ≥107°F today · 17 d/yr by 30 yrs out
- Wind 2/10 Low 3% chance of damaging wind over 30 yrs
- Air quality 2/10 Low 1 unhealthy d/yr today · 2 by 30 yrs out
Nearby sold comps map
Loading sold comps map…
Walkable amenities ~0.75 mi
Loading nearby amenities…
Taxation est. · year 1
- Rental income
- $9,770
- − Mortgage interest
- −$1,680
- − Property taxes
- −$397
- − Insurance
- −$150
- − Repairs & maintenance
- −$782
- − Management
- −$782
- − Depreciation
- −$873
- Taxable income
- $5,107
- Est. tax owed @ 24.0%
- −$1,226
- After-tax cash flow
- $4,058/yr
For passive investors: Depreciation is non-cash, so a rental often shows a tax loss while cash-flowing — sheltering income. Rental losses are passive: they offset passive income freely, and up to $25,000/yr can offset ordinary (W-2) income if you actively participate and your MAGI is under $100k (phasing out to $0 by $150k); unused losses carry forward. On sale, claimed depreciation is recaptured at up to 25%, and gains may owe capital-gains tax (a 1031 exchange can defer both). Figures are a year-1 estimate at your 24.0% rate — not tax advice; consult a CPA.
Schools (NCES district)
- District
- Oklahoma City
- NCES district ID
- 4022770
- Math proficiency
- 7% ▼ -5.00%
- Reading proficiency
- 10% ▼ -6.00%
- Median HH income
- $35,606
- Composite
- 7.0/100
- National rank
- #9970
- State rank
- #254 of 270 in OK
Livability — Oklahoma City
- Score
- 80/100
- State rank
- #3
- US rank
- #1635
Category grades
Schools grade is shown separately in the Schools card above.
Census & demographics
- Census place
- Oklahoma City, OK
- County
- Oklahoma County · 771,644 people
- City population
- 498,656
- Metro
- Oklahoma City, OK
- Population (ZIP)
- 25,791
- Household income
- $56,873
- Rent vs Own
- Severe rent burden
- 1210.0
Population outlook (Oklahoma County) Hauer SSP2
- Today (2025)
- 911,875 people
- By 2030
- 982,413 · +7.7%
- By 2040
- 1,130,468 · +24.0%
- By 2050
- 1,288,422 · +41.3%
- By 2075
- 1,711,482 · +87.7%
- By 2100
- 2,088,448 · +129.0%
Race, ethnicity, and origin ACS 2023
- Neighborhood character
- Diverse neighborhood (Simpson 0.64)
- Race & ethnicity
- White 47% Hispanic / Latino 37% Two or more races 13% Native American 6% Black 5% Asian 2%
- Hispanic origin (detail)
- Mexican 22%
- Common ancestry
- Lithuanian 1% Italian 1% Slovak 1%
- Foreign-born
- 19% · Canada, Vietnam
- Languages at home
- 67% English-only · Spanish 30% Vietnamese 1%
Political lean MEDSL · Oklahoma
- 2024 margin
- Toss-up / Even · D 48.0% · R 49.7% · Other 2.3%
- 2008→2024 swing
- +15.1pp toward D · 2008: -16.8pp · 2024: -1.7pp
- All cycles
- 2024: R+1.7 2020: R+1.1 2016: R+10.5 2012: R+16.7 2008: R+16.8
Not yet ingested
- Civics
- —
Market trends
- HPI YoY
- ▼ -245.03%
- Current HPI
- 274.7844
- Rent YoY
- ▲ 7.29%
- Metro
- Oklahoma City, OK
- State GDP YoY
- ▲ 1.55%
- F500 in state
- 6
Industry mix (Fortune 500 HQ in OK)
| Industry | F500 HQs | Revenue |
|---|---|---|
| Energy | 3 | $48B |
|
||
Price history
3 events — show timeline
- 2022-09-20 Pending — MLSOK
- 2022-04-23 Pending — MLSOK
- 2022-04-21 Listed $30,000 MLSOK
Property tax history
+3.5%/yrLatest (2025): $397 · +4.2% YoY. Source: county tax records.
Cash-flow waterfall
monthlySold comps — $/sqft
last 12 mo · ≤1 miLoading sold comps…