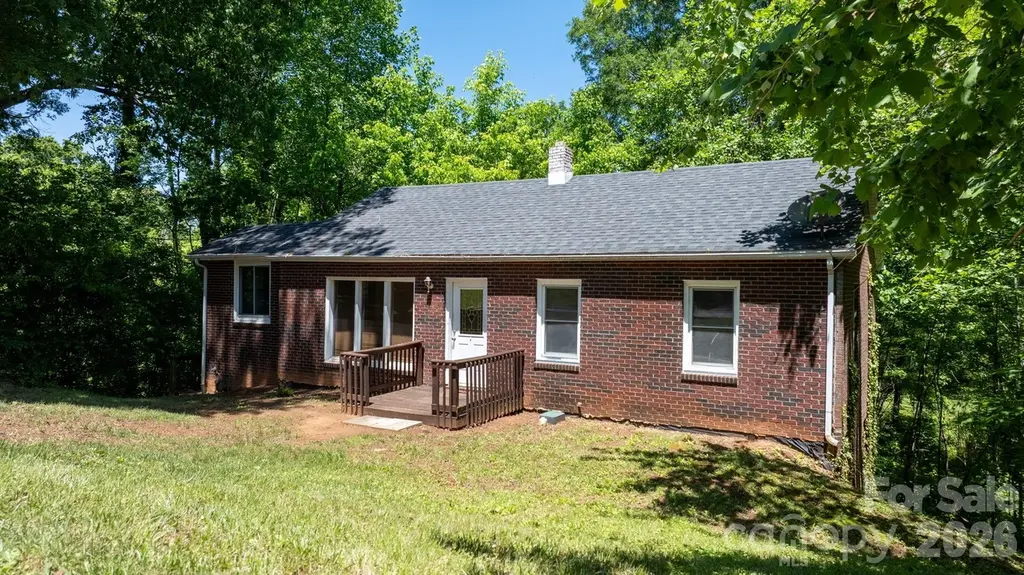
722 E F St · Newton, NC
Flood risk 8/10 · Major
- FEMA flood zone
- X (unshaded)
- Chance of flooding over 30 yrs
- 0.99%
- Est. flood insurance / yr
- $473 – $860
Fire risk 2/10 · Minimal
- Est. fire insurance / yr
- $906 – $1,684
Heat risk 5/10 · Moderate
- Hot days now (above 103°F)
- 7 days/yr
- Hot days in 30 yrs
- 17 days/yr
Wind risk 3/10 · Minor
- Chance of severe wind over 30 yrs
- 4.0%
Air-quality risk 3/10 · Minor
- Unhealthy air days now
- 2 days/yr
- Unhealthy air days in 30 yrs
- 3 days/yr
Risk factors via First Street. Map © Google.
Why this score? — see what drove the B+ grade
The composite is a weighted blend of 9 inputs, each scored 0–100. Each bar is that input's sub-score; the figure is the points it added to the 100-point composite (weight × sub-score).
- Cash flow +30.0/30.0
- ARV discount +15.0/15.0
- DSCR +10.0/10.0
- 1% rule +8.7/10.0
- Schools +4.0/10.0
- Livability +3.7/5.0
- Rent growth +2.5/5.0
- Condition / age +2.5/5.0
- Appreciation +0.0/10.0
$115,000
🖨 Deal sheet 📄 Offer letter ✓ Due diligence
Listing remarks
Investor opportunity with serious upside in the heart of Newton! Located at 722 E F St this complete fixer upper is a blank canvas ready for your vision and creativity. Whether you are looking to renovate flip or build long term value this property offers the kind of potential that is getting harder to find. Situated on approximately 0.28 acres and being sold together with the adjoining 0.33 acre lot you get added space, flexibility and future possibilities for expansion redevelopment or even a second build. Opportunities with this much land and versatility are rare at this price point in this location. The home does need significant repairs and is being sold AS IS, the price has been set a
Key facts
- 0.33 acre lot
- 0.61 acre lot
- Built 1960
Tags
Property features AI
Finance
- HOA & community: No HOA
Exterior
- Parking: Other parking — front yard or street parking
- Utilities: City water; Public sewer
- Home design: Single-family residential property; Site-built construction; One story; Basement entry level; Zoned R-20; Has additional parcels
- Construction: Partial brick and block construction; Composition roof; Basement foundation; Built on site
- Exterior features: Cleared lot; Located in a flood fringe area; Sloped lot; Road surface includes dirt and paved; Publicly maintained road; Front yard or street parking available
Interior
- Kitchen: No appliances listed
- Bedrooms: 3 bedrooms on the main level
- Flooring: Carpet; Tile; Wood
- Bathrooms: 1 full bathroom on the main level
- Heating & cooling: Heat pump heating; Central air conditioning
- Interior features: 6 total rooms; Basement with interior and exterior entry; No built-in appliances listed
- Laundry & utility: Laundry located in the basement
Neighborhood map
What this means for you Summary
Snapshot
- This is a 3-bed/1.0-bath single-family listed at $115k.
Deal economics
- At list price, monthly cash flow is $434 ($5k/yr) — positive.
- The deal already cash-flows at list — no discount required.
- Meets the 1% rule at list price ($2k rent vs $115k).
- Recommended offer: $112k (3.0% below list) — sets the bar for market timing.
- Cap rate 11.4% vs local median 2.9% in Newton — top-decile yield for the area; either an underpriced asset or a hidden risk that comps aren't pricing in. Stress-test before assuming the spread holds.
Location & tenants
- Location reads 73/100 on livability (#77 in NC) — a middle-class / working-renter tenant base. Strengths: cost of living A+, housing A+, health & safety A+; Watch: employment C-, crime D+, amenities F.
- Newton Conover City Schools (suburban): math 49% / reading 47% proficiency, ranked #74 of 178 in NC (top 42%) — families likely to look elsewhere, expect single-tenant / working-renter base with shorter leases.
- Zoned schools: South Newton Elementary (math 37% / reading 32%, grade F, #835 of 1,410 statewide, top 62%, 350 students, 75% FRL); Newton-Conover High (math 57% / reading 52%, grade C-, #270 of 535 statewide, top 52%, 758 students, 59% FRL).
- Market conditions: 224 active listings in the ZIP; 1 comparable units currently listed for rent nearby; 2,016 units permitted in Catawba County in 2024 (255 in 5+ unit buildings).
Forward outlook
- Local home prices are declining (-3.0%/yr); year-one equity from $795 of loan paydown is wiped out by about $3k of value loss. Plan a longer hold.
- Catawba County population projected to shrink 7% by 2050 — rents likely to lag national; underwrite the cash flow, not the appreciation.
- At projected returns (-3.0% appreciation + 3.0% rent growth), your $32k cash investment doubles in ~8 years — after that, you're playing with house money.
Negotiation context
- It's been on market 38 days — a 3% lower offer ($112k) is reasonable based on typical stale-listing flexibility.
- Current owner paid $66k; list at $115k implies a 76% gain — meaningful room to come down on a strong offer.
Risks & watch-outs
- Watch-outs: flood insurance adds $56/mo.
- Climate carrying-cost: severe flood risk; extreme-heat days projected 7→17/yr by 2055 (HVAC capex compounding) — expect insurance premiums to compound above CPI over the hold.
Questions for the listing agent
- It's been on market 38 days. Have you received any prior offers? Is the seller open to a 3% concession, seller financing, or rate buy-down credit?
- Built in 1960 — when were the roof, HVAC, electrical panel, plumbing, and water heater last replaced?
- What's the actual annual flood-insurance premium (NFIP or private), and is the property in a SFHA with mandatory coverage?
- Is there a deadline driving the sale (1031 exchange, divorce, estate, relocation)? That informs how much negotiation room exists.
- Schools are D-rated, which usually means shorter tenancies and higher turnover. Who's the typical renter profile here, and what's been the actual vacancy rate?
- Crime grade is D in this area — have there been break-ins, vandalism, or insurance claims at this property in the last 3 years? What carrier currently insures it and at what premium?
- What's the average days-on-market for RENTAL listings here right now (not sales)? A rising rental-DOM trend means longer vacancies and softer asking-rent achievability than the comps imply.
- What's the recent tenant-quality profile in this submarket — average credit score on applications, eviction rate, late-payment / NSF rate, and stable-employment percentage? A property-management company in the area should have these aggregated.
- How much new for-sale + rental construction is in the pipeline within 1–3 miles? Heavy new supply typically softens prices + rents 12–24 months out; constrained supply supports both.
Investment metrics
- 1% rule
- 1.37% ✓
- Cap rate
- 11.40%
- Cash-on-cash
- 18.25%
- DSCR
- 1.81
- GRM
- 6.1
CMA / ARV
- ARV (on-the-fly)
- $196,224
- Comps found
- 12
Show comp detail 12 sales within ~0.75 mi
| Address | Dist | Beds/Ba | Sqft | Sold | Price | $/sf | Match |
|---|---|---|---|---|---|---|---|
| 624 Overlook Dr | 0.11mi | 2/1.0 (-1) | 1,000 (-2%) | 5mo | $207,000 | $207 | 83 |
| 608 E E St | 0.24mi | 3/2.0 | 1,018 (-0%) | 10mo | $195,000 | $192 | 76 |
| 400 S Forney Ave | 0.35mi | 3/1.0 | 1,021 (-0%) | 15mo | $135,000 | $132 | 71 |
| 127 S Caldwell Ave | 0.46mi | 3/1.0 | 1,000 (-2%) | 11mo | $102,000 | $102 | 66 |
| 306 E Herman St | 0.40mi | 3/1.0 | 955 (-7%) | 17mo | $107,000 | $112 | 56 |
| 614 S Ashe Ave | 0.68mi | 2/1.0 (-1) | 984 (-4%) | 1mo | $167,500 | $170 | 56 |
| 1242 E I St #27 | 0.37mi | 3/2.0 | 1,128 (+10%) | 15mo | $220,000 | $195 | 48 |
| 215 E K St | 0.46mi | 3/1.5 | 1,148 (+12%) | 13mo | $220,000 | $192 | 45 |
| 18 S Coulter Ave | 0.56mi | 2/2.0 (-1) | 952 (-7%) | 11mo | $190,000 | $200 | 44 |
| 415 E D St | 0.39mi | 2/1.0 (-1) | 1,140 (+12%) | 16mo | $95,000 | $83 | 44 |
| 1051 S Brady Ave | 0.54mi | 2/1.5 (-1) | 930 (-9%) | 12mo | $205,000 | $220 | 43 |
| 306 S Main Ave | 0.69mi | 3/1.0 | 1,130 (+11%) | 16mo | $174,000 | $154 | 37 |
Match score weights: distance 35% · size 25% · config 20% · recency 20%. Top-matched comps best support the ARV.
Projected returns pro-forma
-3.0% appreciation · 3.0% rent growth · sell at horizon
- IRR
- 7.2%
- Equity multiple
- 1.28×
- Total profit
- $9,053
- Equity at exit
- $17,147
- IRR
- 16.5%
- Equity multiple
- 2.35×
- Total profit
- $43,628
- Equity at exit
- $9,943
Cash invested: $32,200 (down + closing). Projections, not guarantees.
Landlord ↔ Tenant lean methodology
- Overall (STATE)
- 85 Strongly Landlord-Friendly
- State North Carolina
- 85 Strongly Landlord-Friendly · R+3
- County
- — inherits STATE
- City
- — inherits STATE
ZIP-level market 28658
- Home prices YoY
- -23.3%
- Active inventory
- 224
- Price-to-rent
- 6.1×
Monthly cashflow live
- Estimated rent
- $1,575 medium interval (Pro) →
- Mortgage (P&I)
- −$603
- Tax from tax record
- −$104 /mo · $1,242/yr
- Insurance
- −$48
- Flood insurance flood zone
- −$56 /mo · $666/yr
- HOA
- −$0
- Vacancy / Maint / Mgmt
- −$331
- Net cashflow
- $434
Break-even live
UW: 25.0% down · 7.5% · 30yr · 1.5% tax · 5.0% vac · 8.0% maint · 8.0% mgmt
Financing live
Cash to close
- Down payment
- $28,750
- Closing costs
- $3,450
- Reserves months
- —
- Total cash needed
- —
Loan-product check · same deal, 3 products live
Conventional
25% down · 7.5% · 30yr
- Down + closing
- —
- Monthly P&I
- —
- Monthly cashflow
- —
- DSCR
- —
- Eligible?
- —
Personal DTI + credit; lowest rate.
DSCR
20% down · 8.5% · 30yr
- Down + closing
- —
- Monthly P&I
- —
- Monthly cashflow
- —
- DSCR
- —
- Eligible?
- —
No personal income docs; deal must DSCR.
Hard money
10% down · 12.0% · 12mo
- Down + closing
- —
- Monthly P&I
- —
- Monthly cashflow
- —
- DSCR
- —
- Eligible?
- —
Short-term bridge; refi at stabilization.
Rent comps 1 comps
| Address | Beds | Baths | Sqft | Rent | $/sqft | DOM | Units | Dist |
|---|---|---|---|---|---|---|---|---|
| 244 S Caldwell Ave Newton, NC | 2.0 | 1.5 | 918 | $1,575 | $1.72 | 5d | 1 | 0.27mi |
Listing history 20 events
-
2026-06-19days on market $115,000 Active 38 DOM
-
2026-06-18days on market $115,000 Active 37 DOM
-
2026-06-17days on market $115,000 Active 36 DOM
-
2026-06-16days on market $115,000 Active 35 DOM
-
2026-06-15days on market $115,000 Active 34 DOM
-
2026-06-14days on market $115,000 Active 32 DOM
-
2026-06-13days on market $115,000 Active 31 DOM
-
2026-06-10days on market $115,000 Active 29 DOM
-
2026-06-09days on market $115,000 Active 28 DOM
-
2026-06-08days on market $115,000 Active 27 DOM
-
2026-06-07days on market $115,000 Active 26 DOM
-
2026-06-05days on market $115,000 Active 23 DOM
-
2026-06-02days on market $115,000 Active 21 DOM
-
2026-06-01days on market $115,000 Active 20 DOM
-
2026-05-31days on market $115,000 Active 19 DOM
-
2026-05-30days on market $115,000 Active 18 DOM
-
2026-05-12$115,000 Active
-
2008-06-27soldstatus $65,500
-
2008-05-19soldstatus $20,100
-
2008-05-19soldstatus $20,500
ⓘ Source: listings_history table (triggers on properties + properties_extension) + one-shot
backfill from property_details.listing_events for pre-trigger history.
Tax reassessment forecast NC · Resets to sale price
- Current annual tax
- $1,242 · $104/mo
- Projected year-2 tax
- $1,242 · $104/mo
- Expected delta
- $0/yr ($0/mo · 0.0%)
ⓘ Screening estimate from a state-policy table — verify with the county assessor before closing.
Climate risk First Street
- Flood 8/10 Severe FEMA zone X (unshaded) · 99% chance over 30 yrs
- Wildfire 2/10 Low
- Heat 5/10 Major 7 d/yr ≥103°F today · 17 d/yr by 30 yrs out
- Wind 3/10 Moderate 4% chance of damaging wind over 30 yrs
- Air quality 3/10 Moderate 2 unhealthy d/yr today · 3 by 30 yrs out
Nearby sold comps map
Loading sold comps map…
Walkable amenities ~0.75 mi
Loading nearby amenities…
Taxation est. · year 1
- Rental income
- $18,900
- − Mortgage interest
- −$6,442
- − Property taxes
- −$1,242
- − Insurance
- −$1,242
- − Repairs & maintenance
- −$1,512
- − Management
- −$1,512
- − Depreciation
- −$3,345
- Taxable income
- $3,605
- Est. tax owed @ 24.0%
- −$865
- After-tax cash flow
- $4,345/yr
For passive investors: Depreciation is non-cash, so a rental often shows a tax loss while cash-flowing — sheltering income. Rental losses are passive: they offset passive income freely, and up to $25,000/yr can offset ordinary (W-2) income if you actively participate and your MAGI is under $100k (phasing out to $0 by $150k); unused losses carry forward. On sale, claimed depreciation is recaptured at up to 25%, and gains may owe capital-gains tax (a 1031 exchange can defer both). Figures are a year-1 estimate at your 24.0% rate — not tax advice; consult a CPA.
Schools (NCES district)
- District
- Newton Conover City Schools
- NCES district ID
- 3703360
- Math proficiency
- 49% ▲ 11.00%
- Reading proficiency
- 47% ▲ 3.00%
- Median HH income
- $39,491
- Composite
- 40.13/100
- National rank
- #3797
- State rank
- #74 of 178 in NC
Livability — Newton
- Score
- 73/100
- State rank
- #77
- US rank
- #5536
Category grades
Schools grade is shown separately in the Schools card above.
Census & demographics
- Census place
- Newton, NC
- Population (ZIP)
- 25,681
Population outlook (Catawba County) Hauer SSP2
- Today (2025)
- 156,513 people
- By 2030
- 155,267 · -0.8%
- By 2040
- 151,110 · -3.5%
- By 2050
- 145,524 · -7.0%
- By 2075
- 134,047 · -14.4%
- By 2100
- 119,424 · -23.7%
Race, ethnicity, and origin ACS 2023
- Neighborhood character
- Predominantly White (69%)
- Race & ethnicity
- White 69% Hispanic / Latino 12% Black 8% Two or more races 8% Asian 5%
- Hispanic origin (detail)
- Mexican 9%
- Common ancestry
- Slovak 2% Serbian 2% Italian 2%
- Foreign-born
- 8% · Canada, Jamaica, Vietnam
- Languages at home
- 84% English-only · Spanish 11% Other Asian/Pacific 3% Tagalog/Filipino 1%
Political lean MEDSL · Catawba
- 2024 margin
- Solid R (+38.0) · D 30.6% · R 68.6%
- 2008→2024 swing
- -13.0pp toward R · 2008: -25.0pp · 2024: -38.0pp
- All cycles
- 2024: R+38.0 2020: R+37.0 2016: R+38.0 2012: R+29.6 2008: R+25.0
Not yet ingested
- Civics
- —
Market trends
- HPI YoY
- ▼ -79.85%
- Current HPI
- 262.8541
- Rent YoY
- —
- Metro
- —
- State GDP YoY
- ▲ 3.28%
- F500 in state
- 26
Industry mix (Fortune 500 HQ in NC)
| Industry | F500 HQs | Revenue |
|---|---|---|
| Financial Services | 2 | $213B |
|
||
| Retail | 2 | $95B |
|
||
| Industrial Conglomerate | 1 | $38B |
|
||
| Metals / Steel | 1 | $35B |
|
||
| Utilities | 1 | $30B |
|
||
| Industrial Machinery | 1 | $19B |
|
||
Price history
+472.1% since first listed4 events — show timeline
- 2026-05-12 Listed $115,000 CANOPYMLS as Distributed by MLS Grid
- 2008-06-27 Sold (Public Records) $65,500 Public Records
- 2008-05-19 Sold (Public Records) $20,500 Public Records
- 2008-05-19 Sold (Public Records) $20,100 Public Records
Property tax history
+7.6%/yrLatest (2024): $1,242 · +0.0% YoY. Source: county tax records.
Cash-flow waterfall
monthlySold comps — $/sqft
last 12 mo · ≤1 miLoading sold comps…