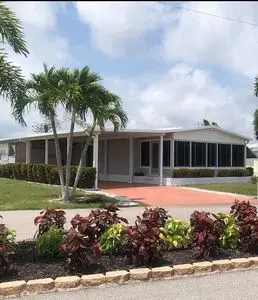
4700 Gulfgate Ln · St. James City, FL
Flood risk 8/10 · Major
- FEMA flood zone
- AE
- Chance of flooding over 30 yrs
- 0.99%
- Est. flood insurance / yr
- $1,737 – $8,500
Fire risk 3/10 · Minor
- Est. fire insurance / yr
- $947 – $1,759
Heat risk 10/10 · Severe
- Hot days now (above 107°F)
- 7 days/yr
- Hot days in 30 yrs
- 27 days/yr
Wind risk 10/10 · Severe
- Chance of severe wind over 30 yrs
- 99.0%
Air-quality risk 2/10 · Minimal
- Unhealthy air days now
- 1 days/yr
- Unhealthy air days in 30 yrs
- 1 days/yr
Risk factors via First Street. Map © Google.
Why this score? — see what drove the C+ grade
The composite is a weighted blend of 9 inputs, each scored 0–100. Each bar is that input's sub-score; the figure is the points it added to the 100-point composite (weight × sub-score).
- Cash flow +28.3/30.0
- DSCR +10.0/10.0
- ARV discount +7.5/15.0
- 1% rule +7.3/10.0
- Schools +4.1/10.0
- Rent growth +2.5/5.0
- Livability +2.5/5.0
- Condition / age +2.5/5.0
- Appreciation +0.0/10.0
$212,000
🖨 Deal sheet (PDF) 📄 Offer letter ✓ Due diligence
Listing remarks MLS
This home has NEVER flooded. Completely renovated 2024. Is move in ready, furnished. New Florida room and carport. Large outside shed. Large corner lot with two driveways. Have access to new Pool and Hot Tub as well as daily activities including courts. Clubhouse includes library and exercise room and is available for parties. Private boat landing and storage. Five minutes to the Gulf fishing. New flooring throughout (no thresholds)
Key facts
- Two driveways
- Large corner lot
- New florida room
Tags
Neighborhood map
What this means for you Summary
Snapshot
- This is a 2-bed/2.0-bath manufactured listed at $212k.
Deal economics
- At list price, monthly cash flow is $255 ($3k/yr) — positive.
- The deal already cash-flows at list — no discount required.
- Meets the 1% rule at list price ($3k rent vs $212k).
- Recommended offer: $199k (6.0% below list) — sets the bar for market timing.
- Cap rate 10.1% vs local median 4.9% in St. James City — top-decile yield for the area; either an underpriced asset or a hidden risk that comps aren't pricing in. Stress-test before assuming the spread holds.
Location & tenants
- Location reads: area grade C — affects rentability + tenant quality, not the cash-flow math above.
- Lee (suburban): math 47% / reading 50% proficiency, ranked #42 of 73 in FL (top 58%) — families likely to look elsewhere, expect single-tenant / working-renter base with shorter leases.
- Zoned schools: Pine Island Elementary School (math 57% / reading 57%, grade C+, #781 of 2,144 statewide, top 38%, 236 students, 45% FRL); Challenger Middle School (math 59% / reading 56%, grade B, #157 of 571 statewide, top 28%, 1,124 students, 50% FRL); Ida S. Baker High School (math 44% / reading 47%, grade D-, #223 of 667 statewide, top 34%, 1,933 students, 39% FRL).
- Market conditions: 289 active listings in the ZIP; 3 comparable units currently listed for rent nearby; rentals at typical pace (median 25d on market — plan ~3-4 weeks tenant-placement turnaround); 15,411 units permitted in Lee County in 2024 (4,686 in 5+ unit buildings).
Forward outlook
- Local home prices are declining (-3.0%/yr); year-one equity from $1k of loan paydown is wiped out by about $6k of value loss. Plan a longer hold.
- Lee County population projected at +44% by 2050 — long-run rental-demand tailwind backs the buy-and-hold thesis.
Negotiation context
- It's been on market 74 days — a 6% lower offer ($199k) is reasonable based on typical stale-listing flexibility.
- 8 sale attempts since 2y ago; this cycle's ask is 7% above the opening price — seller raised mid-cycle; expect resistance to lowballs.
- Current owner paid $85k; list at $212k implies a 149% gain — meaningful room to come down on a strong offer.
Risks & watch-outs
- Watch-outs: flood insurance adds $427/mo.
- Climate carrying-cost: in FEMA flood zone AE (mandatory federal flood insurance); severe wind risk, 99% chance of damaging wind over 30y; extreme-heat days projected 7→27/yr by 2055 (HVAC capex compounding) — expect insurance premiums to compound above CPI over the hold.
Questions for the listing agent
- It's been on market 74 days. Have you received any prior offers? Is the seller open to a 6% concession, seller financing, or rate buy-down credit?
- What's the actual annual flood-insurance premium (NFIP or private), and is the property in a SFHA with mandatory coverage?
- Why hasn't it sold? Are there any deal-killer items the seller is aware of (foundation, flood, title, zoning, code violations)?
- Is there a deadline driving the sale (1031 exchange, divorce, estate, relocation)? That informs how much negotiation room exists.
- What's the average days-on-market for RENTAL listings here right now (not sales)? A rising rental-DOM trend means longer vacancies and softer asking-rent achievability than the comps imply.
- What's the recent tenant-quality profile in this submarket — average credit score on applications, eviction rate, late-payment / NSF rate, and stable-employment percentage? A property-management company in the area should have these aggregated.
- How much new for-sale + rental construction is in the pipeline within 1–3 miles? Heavy new supply typically softens prices + rents 12–24 months out; constrained supply supports both.
Investment metrics
- 1% rule
- 1.23% ✓
- Cap rate
- 10.15%
- Cash-on-cash
- 13.77%
- DSCR
- 1.61
- GRM
- 6.8
CMA / ARV
- ARV (on-the-fly)
- $136,224
- Comps found
- 3
Show comp detail 3 sales within ~0.75 mi
| Address | Dist | Beds/Ba | Sqft | Sold | Price | $/sf | Match |
|---|---|---|---|---|---|---|---|
| 4777 Sandpiper Dr | 0.06mi | 2/2.0 | 960 (-9%) | 4mo | $112,500 | $117 | 79 |
| 4770 Gulfgate Ln | 0.07mi | 2/2.0 | 972 (-8%) | 21mo | $125,000 | $129 | 66 |
| 5017 Gulfgate Ln | 0.38mi | 2/2.0 | 941 (-11%) | 14mo | $124,000 | $132 | 53 |
Match score weights: distance 35% · size 25% · config 20% · recency 20%. Top-matched comps best support the ARV.
Projected returns pro-forma
-3.0% appreciation · 3.0% rent growth · sell at horizon
- IRR
- -8.2%
- Equity multiple
- 0.70×
- Total profit
- $-17,888
- Equity at exit
- $31,610
- IRR
- 1.5%
- Equity multiple
- 1.11×
- Total profit
- $6,323
- Equity at exit
- $18,330
Cash invested: $59,360 (down + closing). Projections, not guarantees.
Landlord ↔ Tenant lean methodology
- Overall (STATE)
- 87 Strongly Landlord-Friendly
- State Florida
- 87 Strongly Landlord-Friendly · R+3
- County
- — inherits STATE
- City
- — inherits STATE
ZIP-level market 33956
- Home prices YoY
- -16.3%
- Active inventory
- 289
- Price-to-rent
- 6.8×
Monthly cashflow live
- Estimated rent
- $2,614 medium interval (Pro) →
- Mortgage (P&I)
- −$1,112
- Tax from tax record
- −$184 /mo · $2,208/yr
- Insurance
- −$88
- Flood insurance flood zone
- −$427 /mo · $5,118/yr
- HOA
- −$0
- Vacancy / Maint / Mgmt
- −$549
- Net cashflow
- $255
Break-even live
Sensitivity live
| Price | -10% $375 | -5% $315 | +0% $255 | +5% $195 | +10% $135 |
|---|---|---|---|---|---|
| Rent | -10% $48 | -5% $151 | +0% $255 | +5% $358 | +10% $461 |
| Rate | -1.0pp $361 | -0.5pp $308 | base $255 | +0.5pp $200 | +1.0pp $144 |
UW: 25.0% down · 7.5% · 30yr · 1.5% tax · 5.0% vac · 8.0% maint · 8.0% mgmt
Financing live
Cash to close
- Down payment
- $53,000
- Closing costs
- $6,360
- Reserves months
- —
- Total cash needed
- —
Loan-product check · same deal, 3 products live
Conventional
25% down · 7.5% · 30yr
- Down + closing
- —
- Monthly P&I
- —
- Monthly cashflow
- —
- DSCR
- —
- Eligible?
- —
Personal DTI + credit; lowest rate.
DSCR
20% down · 8.5% · 30yr
- Down + closing
- —
- Monthly P&I
- —
- Monthly cashflow
- —
- DSCR
- —
- Eligible?
- —
No personal income docs; deal must DSCR.
Hard money
10% down · 12.0% · 12mo
- Down + closing
- —
- Monthly P&I
- —
- Monthly cashflow
- —
- DSCR
- —
- Eligible?
- —
Short-term bridge; refi at stabilization.
Rent comps 3 comps
| Address | Beds | Baths | Sqft | Rent | $/sqft | DOM | Units | Dist |
|---|---|---|---|---|---|---|---|---|
| 4807 Flamingo Dr Saint James City, FL | 3.0 | 2.0 | 1404 | $3,500 | $2.49 | 3d | 1 | 0.16mi |
| 4944 Porky Ln Saint James City, FL | 2.0 | 2.0 | 831 | $1,600 | $1.93 | 25d | 1 | 0.27mi |
| 7150 Cobiac Dr Saint James City, FL | 2.0 | 2.0 | 826 | $1,950 | $2.36 | 25d | 1 | 0.42mi |
Listing history 31 events
-
2026-06-22days on market $212,000 Active 74 DOM
-
2026-06-17days on market $212,000 Active 70 DOM
-
2026-06-16days on market $212,000 Active 69 DOM
-
2026-06-16days on market $212,000 Active 68 DOM
-
2026-06-13days on market $212,000 Active 66 DOM
-
2026-06-09days on market $212,000 Active 62 DOM
-
2026-06-07days on market $212,000 Active 60 DOM
-
2026-06-01days on market $212,000 Active 54 DOM
-
2026-06-01days on market $212,000 Active 53 DOM
-
2026-05-26$199,000 Active 437-char remark
Show marketing remark (437 chars)
This home has NEVER flooded. Completely renovated 2024. Is move in ready, furnished. New Florida room and carport. Large outside shed. Large corner lot with two driveways. Have access to new Pool and Hot Tub as well as daily activities including courts. Clubhouse includes library and exercise room and is available for parties. Private boat landing and storage. Five minutes to the Gulf fishing. New flooring throughout (no thresholds)
-
2026-04-07$212,000 Active
-
2026-03-24historical
-
2026-03-05price $210,000
-
2026-03-03status Active
-
2026-02-22status Pending
-
2026-01-23price $215,000
-
2025-11-20$219,500 Active
-
2025-06-20historical
-
2025-06-16status Active
-
2025-06-16price $124,900
-
2025-04-29historical
-
2025-02-21$249,900 Active
-
2025-02-10historical
-
2025-01-23price $259,000
-
2024-12-13status Active
-
2024-12-12historical
-
2024-11-26$249,000 Active
-
2014-02-04soldstatus $85,000
-
1996-12-17soldstatus $58,000
-
1994-12-30soldstatus $29,000
-
1994-12-30soldstatus $29,000
ⓘ Source: listings_history table (triggers on properties + properties_extension) + one-shot
backfill from property_details.listing_events for pre-trigger history.
Tax reassessment forecast FL · Resets to sale price
- Current annual tax
- $2,208 · $184/mo
- Projected year-2 tax
- $2,208 · $184/mo
- Expected delta
- $0/yr ($0/mo · 0.0%)
ⓘ Screening estimate from a state-policy table — verify with the county assessor before closing.
Climate risk First Street
- Flood 8/10 Severe FEMA zone AE · 99% chance over 30 yrs
- Wildfire 3/10 Moderate
- Heat 10/10 Extreme 7 d/yr ≥107°F today · 27 d/yr by 30 yrs out
- Wind 10/10 Extreme 99% chance of damaging wind over 30 yrs
- Air quality 2/10 Low 1 unhealthy d/yr today · 1 by 30 yrs out
Nearby sold comps map
Loading sold comps map…
Walkable amenities ~0.75 mi
Loading nearby amenities…
Taxation est. · year 1
- Rental income
- $31,370
- − Mortgage interest
- −$11,875
- − Property taxes
- −$2,208
- − Insurance
- −$6,178
- − Repairs & maintenance
- −$2,510
- − Management
- −$2,510
- − Depreciation
- −$6,167
- Taxable loss
- −$78
- Est. tax savings @ 24.0%
- +$19
- After-tax cash flow
- $3,073/yr
For passive investors: Depreciation is non-cash, so a rental often shows a tax loss while cash-flowing — sheltering income. Rental losses are passive: they offset passive income freely, and up to $25,000/yr can offset ordinary (W-2) income if you actively participate and your MAGI is under $100k (phasing out to $0 by $150k); unused losses carry forward. On sale, claimed depreciation is recaptured at up to 25%, and gains may owe capital-gains tax (a 1031 exchange can defer both). Figures are a year-1 estimate at your 24.0% rate — not tax advice; consult a CPA.
Schools (NCES district)
- District
- Lee
- NCES district ID
- 1201080
- Math proficiency
- 47% ▼ -11.00%
- Reading proficiency
- 50% ▼ -4.00%
- Median HH income
- $49,518
- Composite
- 41.49/100
- National rank
- #3458
- State rank
- #42 of 73 in FL
Livability — St. James City
No livability data for this city. (Only ~50 U.S. cities are tracked.)
Census & demographics
- Census place
- St. James City, FL
- Population (ZIP)
- 3,846
Population outlook (Lee County) Hauer SSP2
- Today (2025)
- 871,946 people
- By 2030
- 955,468 · +9.6%
- By 2040
- 1,113,587 · +27.7%
- By 2050
- 1,256,891 · +44.1%
- By 2075
- 1,560,270 · +78.9%
- By 2100
- 1,726,848 · +98.0%
Race, ethnicity, and origin ACS 2023
- Neighborhood character
- Predominantly White (94%)
- Race & ethnicity
- White 94% Two or more races 3% Pacific Islander 2% Hispanic / Latino 1%
- Common ancestry
- Romanian 6% Slovak 4% Iranian 3%
- Foreign-born
- 5% · Canada
- Languages at home
- 95% English-only · French/Haitian/Cajun 2% German/W. Germanic 2% Russian/Polish/Slavic 1%
Political lean MEDSL · Lee
- 2024 margin
- Strong R (+28.4) · D 35.5% · R 63.9%
- 2008→2024 swing
- -18.0pp toward R · 2008: -10.4pp · 2024: -28.4pp
- All cycles
- 2024: R+28.4 2020: R+19.2 2016: R+20.4 2012: R+16.6 2008: R+10.4
Not yet ingested
- Civics
- —
Market trends
- HPI YoY
- ▼ -58.47%
- Current HPI
- 300.1416
- Rent YoY
- —
- Metro
- —
- State GDP YoY
- ▲ 3.28%
- F500 in state
- 36
Industry mix (Fortune 500 HQ in FL)
| Industry | F500 HQs | Revenue |
|---|---|---|
| Industrial Technology | 2 | $29B |
|
||
| Insurance | 2 | $17B |
|
||
| Retail | 1 | $60B |
|
||
| Technology Distribution | 1 | $58B |
|
||
| Homebuilding | 1 | $35B |
|
||
| Technology Manufacturing | 1 | $35B |
|
||
Price history
+586.2% since first listed22 events — show timeline
- 2026-05-26 Listed $199,000 FSBO.com
- 2026-04-07 Listed $212,000 Fizber.com
- 2026-03-24 Listing Removed — FORTMLS
- 2026-03-05 Price Changed $210,000 FORTMLS
- 2026-03-03 Relisted — FORTMLS
- 2026-02-22 Pending — FORTMLS
- 2026-01-23 Price Changed $215,000 FORTMLS
- 2025-11-20 Listed $219,500 FORTMLS
- 2025-06-20 Listing Removed — FORTMLS
- 2025-06-16 Relisted — FORTMLS
- 2025-06-16 Price Changed $124,900 FORTMLS
- 2025-04-29 Listing Removed — FORTMLS
- 2025-02-21 Listed $249,900 FORTMLS
- 2025-02-10 Listing Removed — FORTMLS
- 2025-01-23 Price Changed $259,000 FORTMLS
- 2024-12-13 Relisted — FORTMLS
- 2024-12-12 Listing Removed — FORTMLS
- 2024-11-26 Listed $249,000 FORTMLS
- 2014-02-04 Sold (Public Records) $85,000 Public Records
- 1996-12-17 Sold (Public Records) $58,000 Public Records
- 1994-12-30 Sold (Public Records) $29,000 Public Records
- 1994-12-30 Sold (Public Records) $29,000 Public Records
Property tax history
+12.0%/yrLatest (2025): $2,208 · +14.8% YoY. Source: county tax records.
Cash-flow waterfall
monthlySold comps — $/sqft
last 12 mo · ≤1 miLoading sold comps…