55 Barcelona Rd Unit 226-A · Hilton Head Island, SC
Flood risk 7/10 · Major
- FEMA flood zone
- AE
- Chance of flooding over 30 yrs
- 0.77%
- Est. flood insurance / yr
- $1,737 – $8,500
Fire risk 3/10 · Minor
- Est. fire insurance / yr
- $783 – $1,453
Heat risk 10/10 · Severe
- Hot days now (above 105°F)
- 7 days/yr
- Hot days in 30 yrs
- 19 days/yr
Wind risk 9/10 · Severe
- Chance of severe wind over 30 yrs
- 99.0%
Air-quality risk 3/10 · Minor
- Unhealthy air days now
- 3 days/yr
- Unhealthy air days in 30 yrs
- 3 days/yr
Risk factors via First Street. Map © Google.
Why this score? — see what drove the C- grade
The composite is a weighted blend of 9 inputs, each scored 0–100. Each bar is that input's sub-score; the figure is the points it added to the 100-point composite (weight × sub-score).
- Cash flow +15.0/30.0
- ARV discount +7.5/15.0
- Appreciation +6.6/10.0
- 1% rule +5.0/10.0
- DSCR +5.0/10.0
- Schools +4.1/10.0
- Rent growth +3.3/5.0
- Livability +3.2/5.0
- Condition / age +2.5/5.0
$40,000
🖨 Deal sheet (PDF) 📄 Offer letter ✓ Due diligence
Listing remarks MLS
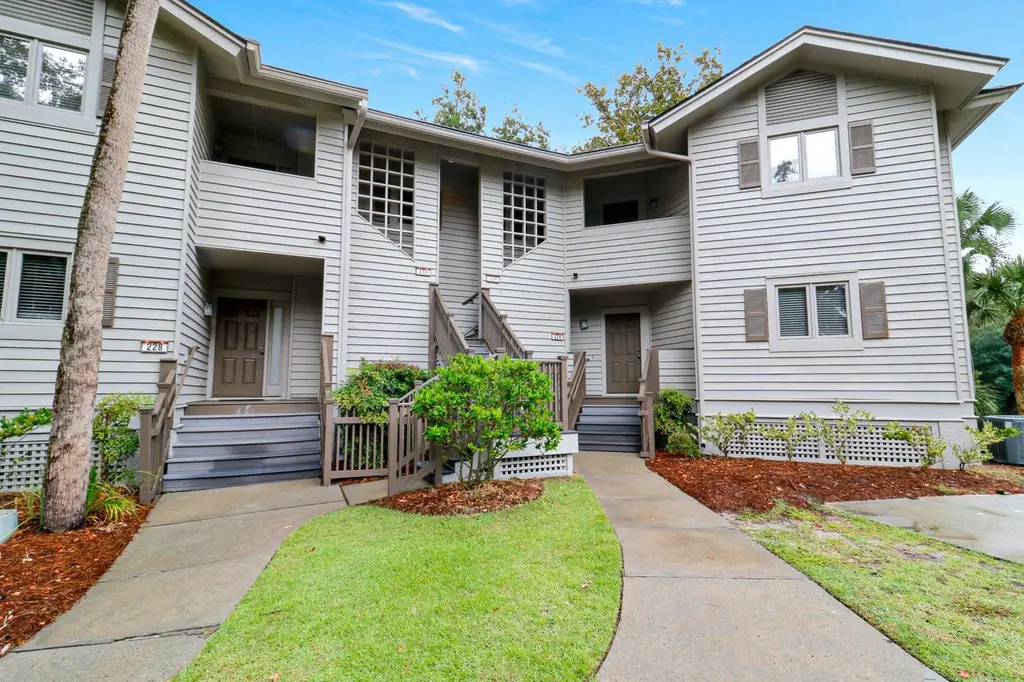
Welcome to your coastal getaway! Own a deeded 2BR, 2BA quartershare at Brigantine Quarters in Shipyard. Enjoy 13 rotating weeks a year in this beautifully designed residence with vaulted ceilings and a large balcony. This mini-resort includes tennis, pickleball, pools, playground, and private beach gate for BQ owners and guests. Maintenance charge covers appliances, furniture, maintenance upkeep, taxes, Shipyard HOA, and more, ensuring a stress-free experience, ideal for personal use or rentals.
Key facts
- Tennis
- Pickleball
- Large balcony
Tags
Neighborhood map
What this means for you Summary
Snapshot
- This is a 2-bed/2.0-bath timeshare listed at $40k.
Deal economics
- At list price, monthly cash flow is $2k ($21k/yr) — positive.
- The deal already cash-flows at list — no discount required.
- Meets the 1% rule at list price ($4k rent vs $40k).
- Recommended offer: $35k (12.0% below list) — sets the bar for market timing.
- Cap rate 70.8% vs local median 2.9% in Hilton Head Island — top-decile yield for the area; either an underpriced asset or a hidden risk that comps aren't pricing in. Stress-test before assuming the spread holds.
Location & tenants
- Location reads 64/100 on livability (#157 in SC) — a middle-class / working-renter tenant base. Strengths: employment A+, crime A-; Watch: amenities F, commute F, cost of living F.
- Beaufort 01 (town): math 42% / reading 51% proficiency, ranked #17 of 80 in SC (top 21%) — families likely to look elsewhere, expect single-tenant / working-renter base with shorter leases.
- Zoned schools: Hilton Head Island Elementary (math 50% / reading 49%, grade D, #168 of 597 statewide, top 31%, 709 students, 56% FRL); Hilton Head Island Middle (math 33% / reading 42%, grade F, #90 of 229 statewide, top 42%, 856 students, 52% FRL); Hilton Head Island High (math 70% / reading 82%, grade A-, #34 of 196 statewide, top 17%, 1,345 students, 40% FRL) — zoned schools at 49% FRL track the district average.
- Market conditions: Rents rising (+3.2%/yr); 846 active listings in the ZIP; 7 comparable units currently listed for rent nearby; rentals at typical pace (median 15d on market — plan ~3-4 weeks tenant-placement turnaround); solid renter incomes; 1,824 units permitted in Beaufort County in 2024 (618 in 5+ unit buildings).
- At $3,968/mo this rent would consume 49% of the median local household income ($98k/yr) (locally 216% of renters already pay >50% of income on rent) — very limited rent-growth headroom before tenants either downsize or default.
Forward outlook
- In year one you build about $2k of equity ($277 loan paydown + $1k appreciation (3.2% local appreciation)).
- Beaufort County population projected at +30% by 2050 — long-run rental-demand tailwind backs the buy-and-hold thesis.
- At projected returns (3.2% appreciation + 3.2% rent growth), your $11k cash investment doubles in ~1 year — after that, you're playing with house money.
Negotiation context
- It's been on market 263 days — a 12% lower offer ($35k) is reasonable based on typical stale-listing flexibility.
- 3 sale attempts since 8y ago with the ask held roughly flat each time — persistent listings suggest the price (not the market) is what's stuck; bring a comps-based counter.
Risks & watch-outs
- Watch-outs: flood insurance adds $427/mo.
- Climate carrying-cost: in FEMA flood zone AE (mandatory federal flood insurance); severe wind risk, 99% chance of damaging wind over 30y; extreme-heat days projected 7→19/yr by 2055 (HVAC capex compounding) — expect insurance premiums to compound above CPI over the hold.
Questions for the listing agent
- It's been on market 263 days. Have you received any prior offers? Is the seller open to a 12% concession, seller financing, or rate buy-down credit?
- What's the actual annual flood-insurance premium (NFIP or private), and is the property in a SFHA with mandatory coverage?
- What does the HOA fee cover, when was the last increase, and are there any pending special assessments or reserve-fund shortfalls?
- Why hasn't it sold? Are there any deal-killer items the seller is aware of (foundation, flood, title, zoning, code violations)?
- Is there a deadline driving the sale (1031 exchange, divorce, estate, relocation)? That informs how much negotiation room exists.
- Schools are B-rated — typically a magnet for longer-tenancy family renters. What's the average tenant stay here, and is there a school-zone premium baked into asking?
- What's the average days-on-market for RENTAL listings here right now (not sales)? A rising rental-DOM trend means longer vacancies and softer asking-rent achievability than the comps imply.
- What's the recent tenant-quality profile in this submarket — average credit score on applications, eviction rate, late-payment / NSF rate, and stable-employment percentage? A property-management company in the area should have these aggregated.
- How much new for-sale + rental construction is in the pipeline within 1–3 miles? Heavy new supply typically softens prices + rents 12–24 months out; constrained supply supports both.
Investment metrics
- 1% rule
- 9.92% ✓
- Cap rate
- 70.84%
- Cash-on-cash
- 230.52%
- DSCR
- 11.26
- GRM
- 0.8
CMA / ARV
- ARV (median comp)
- $89,000
- List price
- $40,000
- Delta
- -55.06%
- Verdict
- UNDERPRICED
- Comps
- 20 within 1.0 mi
Show comp detail 1 sale within ~0.75 mi
| Address | Dist | Beds/Ba | Sqft | Sold | Price | $/sf | Match |
|---|---|---|---|---|---|---|---|
| 55 Barcelona Rd Unit 248-1 | 0.00mi | 2/2.0 | 1,247 (+3%) | 22mo | $36,900 | $30 | 77 |
Match score weights: distance 35% · size 25% · config 20% · recency 20%. Top-matched comps best support the ARV.
Projected returns pro-forma
3.21% appreciation · 3.23% rent growth · sell at horizon
- IRR
- —
- Equity multiple
- 11.43×
- Total profit
- $116,800
- Equity at exit
- $18,455
- IRR
- —
- Equity multiple
- 24.54×
- Total profit
- $263,649
- Equity at exit
- $28,811
Cash invested: $11,200 (down + closing). Projections, not guarantees.
Landlord ↔ Tenant lean methodology
- Overall (STATE)
- 90 Strongly Landlord-Friendly
- State South Carolina
- 90 Strongly Landlord-Friendly · R+6
- County
- — inherits STATE
- City
- — inherits STATE
ZIP-level market 29928
- Home prices YoY
- 1.3%
- Rents YoY
- 3.2%
- Active inventory
- 846
- Price-to-rent
- 0.8×
Monthly cashflow live
- Estimated rent
- $3,968 high interval (Pro) →
- Mortgage (P&I)
- −$210
- Tax est. 1.5%
- −$50 /mo · $600/yr
- Insurance
- −$17
- Flood insurance flood zone
- −$427 /mo · $5,118/yr
- HOA
- −$707
- Vacancy / Maint / Mgmt
- −$833
- Net cashflow
- $1,725
Break-even live
Sensitivity live
| Price | -10% $1,753 | -5% $1,739 | +0% $1,725 | +5% $1,711 | +10% $1,697 |
|---|---|---|---|---|---|
| Rent | -10% $1,411 | -5% $1,568 | +0% $1,725 | +5% $1,882 | +10% $2,038 |
| Rate | -1.0pp $1,745 | -0.5pp $1,735 | base $1,725 | +0.5pp $1,715 | +1.0pp $1,704 |
UW: 25.0% down · 7.5% · 30yr · 1.5% tax · 5.0% vac · 8.0% maint · 8.0% mgmt
Financing live
Cash to close
- Down payment
- $10,000
- Closing costs
- $1,200
- Reserves months
- —
- Total cash needed
- —
Loan-product check · same deal, 3 products live
Conventional
25% down · 7.5% · 30yr
- Down + closing
- —
- Monthly P&I
- —
- Monthly cashflow
- —
- DSCR
- —
- Eligible?
- —
Personal DTI + credit; lowest rate.
DSCR
20% down · 8.5% · 30yr
- Down + closing
- —
- Monthly P&I
- —
- Monthly cashflow
- —
- DSCR
- —
- Eligible?
- —
No personal income docs; deal must DSCR.
Hard money
10% down · 12.0% · 12mo
- Down + closing
- —
- Monthly P&I
- —
- Monthly cashflow
- —
- DSCR
- —
- Eligible?
- —
Short-term bridge; refi at stabilization.
Rent comps 7 comps
| Address | Beds | Baths | Sqft | Rent | $/sqft | DOM | Units | Dist |
|---|---|---|---|---|---|---|---|---|
| 21 Lagoon Rd Unit 1508866P Hilton Head Island, SC | 2.0 | 2.0 | 742 | $2,687 | $3.62 | 15d | 1 | 0.41mi |
| 10 N Forest Beach Dr Unit 1470517P Hilton Head Island, SC | 2.0 | 2.0 | 1323 | $5,684 | $4.30 | 22d | 1 | 0.52mi |
| 125 Shipyard Dr #148 Hilton Head Island, SC | 3.0 | 3.0 | 1400 | $3,200 | $2.29 | 45d | 1 | 0.78mi |
| 36 Deallyon Ave Unit 1498585P Hilton Head Island, SC | 2.0 | 2.5 | 990 | $2,706 | $2.73 | 15d | 1 | 0.86mi |
| 10 Lemoyne Ave Unit 1322533P Hilton Head Island, SC | 2.0 | 2.0 | 839 | $4,267 | $5.09 | 15d | 1 | 1.12mi |
| 19 Lemoyne Ave Unit 1470518P Hilton Head Island, SC | 2.0 | 2.5 | 1033 | $2,673 | $2.59 | 15d | 1 | 1.13mi |
| 77 Ocean Ln Unit 1316255P Hilton Head Island, SC | 2.0 | 2.0 | 1162 | $6,002 | $5.17 | 15d | 1 | 1.15mi |
HOA detail
- Monthly dues
- $707 · $8,484/yr
- Likely covers
- pool
Listing history 19 events
-
2026-06-21days on market $40,000 Active 263 DOM
-
2026-06-18days on market $40,000 Active 260 DOM
-
2026-06-17days on market $40,000 Active 259 DOM
-
2026-06-16days on market $40,000 Active 258 DOM
-
2026-06-15days on market $40,000 Active 257 DOM
-
2026-06-14days on market $40,000 Active 255 DOM
-
2026-06-13days on market $40,000 Active 254 DOM
-
2026-06-10days on market $40,000 Active 252 DOM
-
2026-06-09days on market $40,000 Active 251 DOM
-
2026-06-08days on market $40,000 Active 250 DOM
-
2026-06-07days on market $40,000 Active 249 DOM
-
2026-06-05days on market $40,000 Active 246 DOM
-
2026-06-03days on market $40,000 Active 245 DOM
-
2026-06-02days on market $40,000 Active 244 DOM
-
2026-06-01days on market $40,000 Active 243 DOM
-
2026-05-31days on market $40,000 Active 242 DOM
-
2025-09-30$40,000 Active 500-char remark
Show marketing remark (500 chars)
Welcome to your coastal getaway! Own a deeded 2BR, 2BA quartershare at Brigantine Quarters in Shipyard. Enjoy 13 rotating weeks a year in this beautifully designed residence with vaulted ceilings and a large balcony. This mini-resort includes tennis, pickleball, pools, playground, and private beach gate for BQ owners and guests. Maintenance charge covers appliances, furniture, maintenance upkeep, taxes, Shipyard HOA, and more, ensuring a stress-free experience, ideal for personal use or rentals.
-
2022-09-29$32,000 Active
-
2018-01-22$19,500
ⓘ Source: listings_history table (triggers on properties + properties_extension) + one-shot
backfill from property_details.listing_events for pre-trigger history.
Climate risk First Street
- Flood 7/10 Severe FEMA zone AE · 77% chance over 30 yrs
- Wildfire 3/10 Moderate
- Heat 10/10 Extreme 7 d/yr ≥105°F today · 19 d/yr by 30 yrs out
- Wind 9/10 Extreme 99% chance of damaging wind over 30 yrs
- Air quality 3/10 Moderate 3 unhealthy d/yr today · 3 by 30 yrs out
Nearby sold comps map
Loading sold comps map…
Walkable amenities ~0.75 mi
Loading nearby amenities…
Taxation est. · year 1
- Rental income
- $47,619
- − Mortgage interest
- −$2,241
- − Property taxes
- −$600
- − Insurance
- −$5,318
- − Repairs & maintenance
- −$3,810
- − Management
- −$3,810
- − HOA
- −$8,484
- − Depreciation
- −$1,164
- Taxable income
- $22,193
- Est. tax owed @ 24.0%
- −$5,326
- After-tax cash flow
- $15,373/yr
For passive investors: Depreciation is non-cash, so a rental often shows a tax loss while cash-flowing — sheltering income. Rental losses are passive: they offset passive income freely, and up to $25,000/yr can offset ordinary (W-2) income if you actively participate and your MAGI is under $100k (phasing out to $0 by $150k); unused losses carry forward. On sale, claimed depreciation is recaptured at up to 25%, and gains may owe capital-gains tax (a 1031 exchange can defer both). Figures are a year-1 estimate at your 24.0% rate — not tax advice; consult a CPA.
Schools (NCES district)
- District
- Beaufort 01
- NCES district ID
- 4501110
- Math proficiency
- 42% ▼ -8.00%
- Reading proficiency
- 51% ▲ 2.00%
- Median HH income
- $57,430
- Composite
- 40.56/100
- National rank
- #3699
- State rank
- #17 of 80 in SC
Livability — Hilton Head Island
- Score
- 64/100
- State rank
- #157
- US rank
- #14648
Category grades
Schools grade is shown separately in the Schools card above.
Census & demographics
- Census place
- Hilton Head Island, SC
- County
- Beaufort County · 163,770 people
- City population
- 40,243
- Metro
- Hilton Head Island-Bluffton, SC
- Population (ZIP)
- 15,785
- Household income
- $97,576
- Rent vs Own
- Severe rent burden
- 216.0
Population outlook (Beaufort County) Hauer SSP2
- Today (2025)
- 211,915 people
- By 2030
- 227,272 · +7.2%
- By 2040
- 253,861 · +19.8%
- By 2050
- 275,126 · +29.8%
- By 2075
- 311,022 · +46.8%
- By 2100
- 321,286 · +51.6%
Race, ethnicity, and origin ACS 2023
- Neighborhood character
- Predominantly White (87%)
- Race & ethnicity
- White 87% Hispanic / Latino 6% Two or more races 2% Black 2% Asian 1%
- Hispanic origin (detail)
- Mexican 3%
- Common ancestry
- Lithuanian 4% Slovak 4% Romanian 4%
- Foreign-born
- 9% · Canada, China
- Languages at home
- 91% English-only · Spanish 5% French/Haitian/Cajun 1% Chinese 1%
Political lean MEDSL · Beaufort
- 2024 margin
- R (+14.5) · D 42.1% · R 56.6% · Other 1.2%
- 2008→2024 swing
- -3.7pp toward R · 2008: -10.8pp · 2024: -14.5pp
- All cycles
- 2024: R+14.5 2020: R+10.0 2016: R+14.3 2012: R+17.5 2008: R+10.8
Not yet ingested
- Civics
- —
Market trends
- HPI YoY
- ▲ 3.21%
- Current HPI
- 243.4136
- Rent YoY
- ▲ 3.23%
- Metro
- Hilton Head Island-Bluffton, SC
- State GDP YoY
- ▲ 4.51%
- F500 in state
- 2
Industry mix (Fortune 500 HQ in SC)
| Industry | F500 HQs | Revenue |
|---|---|---|
| Packaging | 1 | $7B |
|
||
Price history
+105.1% since first listed3 events — show timeline
- 2025-09-30 Listed $40,000 Charleston Trident MLS
- 2022-09-29 Listed $32,000 RSMLS
- 2018-01-22 Listed $19,500 RSMLS
Cash-flow waterfall
monthlySold comps — $/sqft
last 12 mo · ≤1 miLoading sold comps…