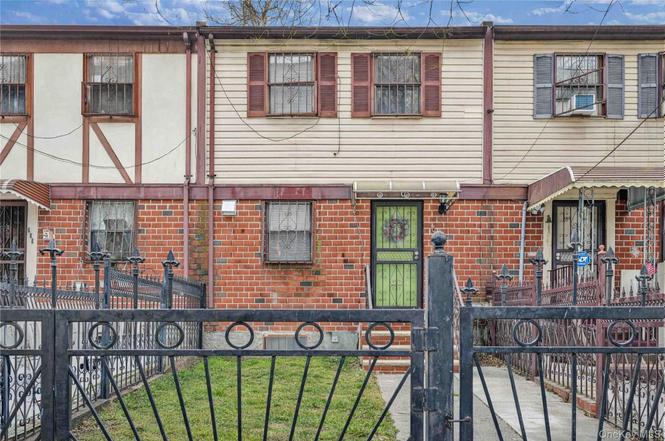
686 Saint Anns Ave · New York, NY
Flood risk 6/10 · Moderate
- FEMA flood zone
- X (unshaded)
- Chance of flooding over 30 yrs
- 0.57%
- Est. flood insurance / yr
- $507 – $1,088
Fire risk 1/10 · Minimal
- Est. fire insurance / yr
- $691 – $1,283
Heat risk 6/10 · Moderate
- Hot days now (above 99°F)
- 7 days/yr
- Hot days in 30 yrs
- 15 days/yr
Wind risk 6/10 · Moderate
- Chance of severe wind over 30 yrs
- 27.0%
Air-quality risk 4/10 · Minor
- Unhealthy air days now
- 5 days/yr
- Unhealthy air days in 30 yrs
- 6 days/yr
Risk factors via First Street. Map © Google.
Why this score? — see what drove the C+ grade
The composite is a weighted blend of 9 inputs, each scored 0–100. Each bar is that input's sub-score; the figure is the points it added to the 100-point composite (weight × sub-score).
- Cash flow +23.1/30.0
- DSCR +7.4/10.0
- ARV discount +6.4/15.0
- Appreciation +6.1/10.0
- 1% rule +5.1/10.0
- Schools +5.0/10.0
- Livability +3.8/5.0
- Rent growth +2.5/5.0
- Condition / age +2.5/5.0
$625,000
🖨 Deal sheet 📄 Offer letter ✓ Due diligence
Listing remarks MLS
Beautiful single family in the Mott Haven/ Melrose Neighborhood young house built in 1993 features 3 bedrooms duplex, 2.5 baths with renovated kitchen and bathroom, large living/dinning, full finished basement and a backyard, driveway and low taxes complete this home. Close to the 2/5 Subway lines the 149th St Hub, schools, parks and highway. Call Today!
Key facts
- 1,620 sq ft lot
- Parking
- Built 1993
Neighborhood map
What this means for you Summary
Snapshot
- This is a 3-bed/2.5-bath single-family listed at $625k.
Deal economics
- At list price, monthly cash flow is $1k ($13k/yr) — positive.
- The deal already cash-flows at list — no discount required.
- Meets the 1% rule at list price ($6k rent vs $625k).
- Recommended offer: $606k (3.0% below list) — sets the bar for market timing.
- Cap rate 8.4% vs local median 2.6% in New York — top-decile yield for the area; either an underpriced asset or a hidden risk that comps aren't pricing in. Stress-test before assuming the spread holds.
Location & tenants
- Location reads 75/100 on livability (#268 in NY, #4,188 nationally) — a middle-class / working-renter tenant base. Strengths: amenities A+, commute A+, health & safety A; Watch: crime F, cost of living F.
- Market conditions: 26 active listings in the ZIP; 2 comparable units currently listed for rent nearby; 6,929 units permitted in Bronx County in 2024 (6,829 in 5+ unit buildings).
Forward outlook
- In year one you build about $18k of equity ($4k loan paydown + $13k appreciation (2.1% local appreciation)).
- Bronx County population projected at +21% by 2050 — long-run rental-demand tailwind backs the buy-and-hold thesis.
- At projected returns (2.1% appreciation + 3.0% rent growth), your $175k cash investment doubles in ~5 years — after that, you're playing with house money.
- By year 3, paydown + projected appreciation supports a ~$45k cash-out refi (75% LTV) — recoverable capital for the next deal without selling this one.
Negotiation context
- It's been on market 37 days — a 3% lower offer ($606k) is reasonable based on typical stale-listing flexibility.
- 2 sale attempts since 7y ago with the ask held roughly flat each time — persistent listings suggest the price (not the market) is what's stuck; bring a comps-based counter.
- Current owner paid $450k; 39% above their basis — modest negotiation headroom, anchor on the comps not their cost.
Risks & watch-outs
- Climate carrying-cost: major flood risk; major wind risk, 27% chance of damaging wind over 30y; extreme-heat days projected 7→15/yr by 2055 (HVAC capex compounding) — expect insurance premiums to compound above CPI over the hold.
Questions for the listing agent
- It's been on market 37 days. Have you received any prior offers? Is the seller open to a 3% concession, seller financing, or rate buy-down credit?
- Is there a deadline driving the sale (1031 exchange, divorce, estate, relocation)? That informs how much negotiation room exists.
- Schools are B-rated — typically a magnet for longer-tenancy family renters. What's the average tenant stay here, and is there a school-zone premium baked into asking?
- Crime grade is F in this area — have there been break-ins, vandalism, or insurance claims at this property in the last 3 years? What carrier currently insures it and at what premium?
- What's the average days-on-market for RENTAL listings here right now (not sales)? A rising rental-DOM trend means longer vacancies and softer asking-rent achievability than the comps imply.
- What's the recent tenant-quality profile in this submarket — average credit score on applications, eviction rate, late-payment / NSF rate, and stable-employment percentage? A property-management company in the area should have these aggregated.
- How much new for-sale + rental construction is in the pipeline within 1–3 miles? Heavy new supply typically softens prices + rents 12–24 months out; constrained supply supports both.
Investment metrics
- 1% rule
- 1.01% ✓
- Cap rate
- 8.44%
- Cash-on-cash
- 7.68%
- DSCR
- 1.34
- GRM
- 8.3
CMA / ARV
- ARV (on-the-fly)
- $610,560
- Comps found
- 5
Show comp detail 5 sales within ~0.75 mi
| Address | Dist | Beds/Ba | Sqft | Sold | Price | $/sf | Match |
|---|---|---|---|---|---|---|---|
| 686 Saint Anns Ave | 0.00mi | 3/2.5 | 1,152 (0%) | 1mo | $612,500 | $532 | 99 |
| 716 St Ann's Ave | 0.05mi | 3/1.5 | 1,152 (0%) | 2mo | $610,000 | $530 | 92 |
| 690 Saint Anns Ave | 0.01mi | 3/1.5 | 1,200 (+4%) | 8mo | $650,000 | $542 | 82 |
| 644 Eagle Ave | 0.07mi | 3/1.5 | 1,250 (+8%) | 19mo | $500,000 | $400 | 63 |
| 738 Brook Ave #1 | 0.14mi | 2/1.0 (-1) | 1,284 (+12%) | 22mo | $380,000 | $296 | 45 |
Match score weights: distance 35% · size 25% · config 20% · recency 20%. Top-matched comps best support the ARV.
Projected returns pro-forma
2.14% appreciation · 3.0% rent growth · sell at horizon
- IRR
- 12.4%
- Equity multiple
- 1.68×
- Total profit
- $118,366
- Equity at exit
- $251,174
- IRR
- 15.1%
- Equity multiple
- 3.04×
- Total profit
- $357,424
- Equity at exit
- $365,308
Cash invested: $175,000 (down + closing). Projections, not guarantees.
Landlord ↔ Tenant lean methodology
- Overall (CITY)
- 0 Strongly Tenant-Friendly
- State New York
- 15 Strongly Tenant-Friendly · D+10
- County
- — inherits STATE
- City New York
- 0 Strongly Tenant-Friendly · D+34
ZIP-level market 10455
- Home prices YoY
- 1.5%
- Active inventory
- 26
- Price-to-rent
- 8.3×
Monthly cashflow live
- Estimated rent
- $6,300 medium interval (Pro) →
- Mortgage (P&I)
- −$3,278
- Tax from tax record
- −$319 /mo · $3,826/yr
- Insurance
- −$260
- HOA
- −$0
- Vacancy / Maint / Mgmt
- −$1,323
- Net cashflow
- $1,120
Break-even live
UW: 25.0% down · 7.5% · 30yr · 1.5% tax · 5.0% vac · 8.0% maint · 8.0% mgmt
Financing live
Cash to close
- Down payment
- $156,250
- Closing costs
- $18,750
- Reserves months
- —
- Total cash needed
- —
Loan-product check · same deal, 3 products live
Conventional
25% down · 7.5% · 30yr
- Down + closing
- —
- Monthly P&I
- —
- Monthly cashflow
- —
- DSCR
- —
- Eligible?
- —
Personal DTI + credit; lowest rate.
DSCR
20% down · 8.5% · 30yr
- Down + closing
- —
- Monthly P&I
- —
- Monthly cashflow
- —
- DSCR
- —
- Eligible?
- —
No personal income docs; deal must DSCR.
Hard money
10% down · 12.0% · 12mo
- Down + closing
- —
- Monthly P&I
- —
- Monthly cashflow
- —
- DSCR
- —
- Eligible?
- —
Short-term bridge; refi at stabilization.
Rent comps 2 comps
| Address | Beds | Baths | Sqft | Rent | $/sqft | DOM | Units | Dist |
|---|---|---|---|---|---|---|---|---|
| 2413 3rd Ave Bronx, NY | 1.0–3.0 | 1.0–2.0 | 857 | $4,997 | $5.83 | 11d | 23 | 1.26mi |
| 5 Lincoln Ave Bronx, NY | 1.0–3.0 | 1.0–2.5 | 1011 | $7,411 | $7.33 | 1d | 183 | 1.26mi |
Listing history 9 events
-
2026-04-09status Pending
-
2026-03-04$625,000 Active
-
2026-02-19historical $625,000
-
2019-07-15soldstatus $450,000
-
2019-07-03soldstatus $475,000 Sold 356-char remark
Show marketing remark (356 chars)
Beautiful single family in the Mott Haven/ Melrose Neighborhood young house built in 1993 features 3 bedrooms duplex, 2.5 baths with renovated kitchen and bathroom, large living/dinning, full finished basement and a backyard, driveway and low taxes complete this home. Close to the 2/5 Subway lines the 149th St Hub, schools, parks and highway. Call Today!
-
2019-03-27status Pending 356-char remark
Show marketing remark (356 chars)
Beautiful single family in the Mott Haven/ Melrose Neighborhood young house built in 1993 features 3 bedrooms duplex, 2.5 baths with renovated kitchen and bathroom, large living/dinning, full finished basement and a backyard, driveway and low taxes complete this home. Close to the 2/5 Subway lines the 149th St Hub, schools, parks and highway. Call Today!
-
2019-02-19$499,000 Active 356-char remark
Show marketing remark (356 chars)
Beautiful single family in the Mott Haven/ Melrose Neighborhood young house built in 1993 features 3 bedrooms duplex, 2.5 baths with renovated kitchen and bathroom, large living/dinning, full finished basement and a backyard, driveway and low taxes complete this home. Close to the 2/5 Subway lines the 149th St Hub, schools, parks and highway. Call Today!
-
1993-11-26soldstatus $71,000
-
1993-11-26soldstatus $71,000
ⓘ Source: listings_history table (triggers on properties + properties_extension) + one-shot
backfill from property_details.listing_events for pre-trigger history.
Tax reassessment forecast NY · Partial reset (capped growth)
- Current annual tax
- $3,826 · $319/mo
- Projected year-2 tax
- $7,194 · $600/mo
- Expected delta
- +$3,368/yr (+$281/mo · 88.0%)
ⓘ Screening estimate from a state-policy table — verify with the county assessor before closing.
Climate risk First Street
- Flood 6/10 Major FEMA zone X (unshaded) · 57% chance over 30 yrs
- Wildfire 1/10 Low
- Heat 6/10 Major 7 d/yr ≥99°F today · 15 d/yr by 30 yrs out
- Wind 6/10 Major 27% chance of damaging wind over 30 yrs
- Air quality 4/10 Moderate 5 unhealthy d/yr today · 6 by 30 yrs out
Nearby sold comps map
Loading sold comps map…
Walkable amenities ~0.75 mi
Loading nearby amenities…
Taxation est. · year 1
- Rental income
- $75,596
- − Mortgage interest
- −$35,010
- − Property taxes
- −$3,826
- − Insurance
- −$3,125
- − Repairs & maintenance
- −$6,048
- − Management
- −$6,048
- − Depreciation
- −$18,182
- Taxable income
- $3,358
- Est. tax owed @ 24.0%
- −$806
- After-tax cash flow
- $12,633/yr
For passive investors: Depreciation is non-cash, so a rental often shows a tax loss while cash-flowing — sheltering income. Rental losses are passive: they offset passive income freely, and up to $25,000/yr can offset ordinary (W-2) income if you actively participate and your MAGI is under $100k (phasing out to $0 by $150k); unused losses carry forward. On sale, claimed depreciation is recaptured at up to 25%, and gains may owe capital-gains tax (a 1031 exchange can defer both). Figures are a year-1 estimate at your 24.0% rate — not tax advice; consult a CPA.
Schools (NCES district)
No district data.
Livability — New York
- Score
- 75/100
- State rank
- #268
- US rank
- #4188
Category grades
Schools grade is shown separately in the Schools card above.
Census & demographics
- Census place
- New York, NY
- City population
- 7,731,280
- Population (ZIP)
- 42,940
Population outlook (Bronx County) Hauer SSP2
- Today (2025)
- 1,607,353 people
- By 2030
- 1,681,852 · +4.6%
- By 2040
- 1,824,421 · +13.5%
- By 2050
- 1,945,470 · +21.0%
- By 2075
- 2,187,887 · +36.1%
- By 2100
- 2,244,136 · +39.6%
Race, ethnicity, and origin ACS 2023
- Neighborhood character
- Predominantly Hispanic (71%)
- Race & ethnicity
- Hispanic / Latino 71% Black 24% Two or more races 17% White 1% Native American 1%
- Hispanic origin (detail)
- Mexican 15% Puerto Rican 27% Dominican 17%
- Foreign-born
- 24% · Canada
- Languages at home
- 35% English-only · Spanish 60% French/Haitian/Cajun 1%
Political lean MEDSL · Bronx
- 2024 margin
- Solid D (+45.4) · D 72.7% · R 27.3%
- 2008→2024 swing
- -32.3pp toward R · 2008: 77.8pp · 2024: 45.4pp
- All cycles
- 2024: D+45.4 2020: D+67.6 2016: D+79.1 2012: D+82.9 2008: D+77.8
Not yet ingested
- Civics
- —
Market trends
- HPI YoY
- ▲ 2.14%
- Current HPI
- 145.3911
- Rent YoY
- —
- Metro
- —
- State GDP YoY
- ▲ 2.60%
- F500 in state
- 92
Industry mix (Fortune 500 HQ in NY)
| Industry | F500 HQs | Revenue |
|---|---|---|
| Financial Services | 10 | $950B |
|
||
| Consumer Goods | 9 | $162B |
|
||
| Insurance | 4 | $225B |
|
||
| Telecommunications | 2 | $144B |
|
||
| Pharmaceuticals | 2 | $112B |
|
||
| Media / Entertainment | 2 | $69B |
|
||
Price history
+780.3% since first listed9 events — show timeline
- 2026-04-09 Pending — OneKey® MLS as Distributed by MLS Grid
- 2026-03-04 Listed $625,000 OneKey® MLS as Distributed by MLS Grid
- 2026-02-19 Coming Soon $625,000 OneKey® MLS as Distributed by MLS Grid
- 2019-07-15 Sold (Public Records) $450,000 Public Records
- 2019-07-03 Sold (MLS) $475,000 OneKey® MLS as Distributed by MLS Grid
- 2019-03-27 Pending — OneKey® MLS as Distributed by MLS Grid
- 2019-02-19 Listed $499,000 OneKey® MLS as Distributed by MLS Grid
- 1993-11-26 Sold (Public Records) $71,000 Public Records
- 1993-11-26 Sold (Public Records) $71,000 Public Records
Property tax history
+9.3%/yrLatest (2025): $3,826 · +4.0% YoY. Source: county tax records.
Cash-flow waterfall
monthlySold comps — $/sqft
last 12 mo · ≤1 miLoading sold comps…