 🏷️ Likely Rental
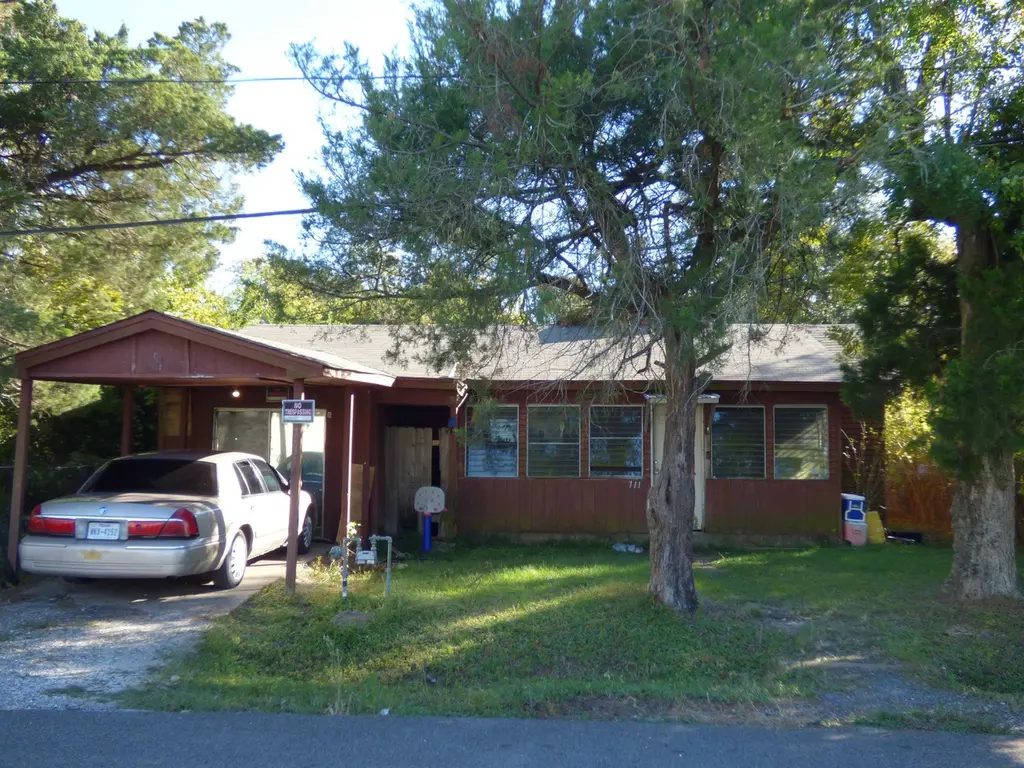
711 Rein · Orange, TX
Flood risk 8/10 · Major
- FEMA flood zone
- AE
- Chance of flooding over 30 yrs
- 0.96%
- Est. flood insurance / yr
- $1,737 – $8,500
Fire risk 2/10 · Minimal
- Est. fire insurance / yr
- $1,222 – $2,270
Heat risk 9/10 · Severe
- Hot days now (above 109°F)
- 7 days/yr
- Hot days in 30 yrs
- 24 days/yr
Wind risk 9/10 · Severe
- Chance of severe wind over 30 yrs
- 99.0%
Air-quality risk 3/10 · Minor
- Unhealthy air days now
- 2 days/yr
- Unhealthy air days in 30 yrs
- 3 days/yr
Risk factors via First Street. Map © Google.
Why this score? — see what drove the D+ grade
The composite is a weighted blend of 9 inputs, each scored 0–100. Each bar is that input's sub-score; the figure is the points it added to the 100-point composite (weight × sub-score).
- Cash flow +15.0/30.0
- ARV discount +7.5/15.0
- Appreciation +5.5/10.0
- 1% rule +5.0/10.0
- DSCR +5.0/10.0
- Rent growth +3.9/5.0
- Livability +3.6/5.0
- Condition / age +2.5/5.0
- Schools +1.6/10.0
$37,000
🖨 Deal sheet 📄 Offer letter ✓ Due diligence
Listing remarks
This is the opportunity investors have been waiting for! Income-producing potential with over 1,600 sq ft ready for your vision. Reimagine the layout, renovate to maximize value, or move in while updating over time. The kitchen opens to the main living area with a spacious den located just beyond, offering flexible living or rental possibilities. Whether you're looking for your next flip, rental property, or affordable project home, this property offers strong upside potential at the right price. * Tenant is month to month Home rents for $850 per month
Key facts
- 7,405 sq ft lot
- Parking
- Listed 41 days
Property features AI
Finance
- Other: Located in the Out Of Town subdivision
Exterior
- Parking: Attached carport; 1 carport space
- Utilities: Public water; Public sewer
- Home design: Single-family residence; Residential property
- Construction: Frame construction; Composition roof
- Exterior features: Chain link fencing; Public-maintained road access
Interior
- Kitchen: Gas cooktop
- Flooring: Carpet
- Bathrooms: 1 full bathroom
- Heating & cooling: Ceiling fan(s); Window unit(s)
- Interior features: Ceiling fan(s); Window unit(s)
Neighborhood map
What this means for you Summary
Snapshot
- This is a 4-bed/1.0-bath single-family listed at $37k.
Deal economics
- At list price, monthly cash flow is $588 ($7k/yr) — positive.
- The deal already cash-flows at list — no discount required.
- Meets the 1% rule at list price ($2k rent vs $37k).
- Recommended offer: $36k (3.0% below list) — sets the bar for market timing.
- Cap rate 39.2% vs local median 3.9% in Orange — top-decile yield for the area; either an underpriced asset or a hidden risk that comps aren't pricing in. Stress-test before assuming the spread holds.
Location & tenants
- Location reads 71/100 on livability (#286 in TX) — a middle-class / working-renter tenant base. Strengths: cost of living A+, housing A+, health & safety A+; Watch: crime D+, employment D+, schools D-.
- West Orange-Cove CISD (suburban): math 17% / reading 21% proficiency, ranked #784 of 826 in TX (top 95%) — low school quality limits family demand, transient renter base, plan for 1-2y turnover; 79% free/reduced lunch — lower-income household profile, screen leases tightly.
- Market conditions: Rents rising fast (+5.7%/yr); 337 active listings in the ZIP; 9 comparable units currently listed for rent nearby; rentals at typical pace (median 22d on market — plan ~3-4 weeks tenant-placement turnaround); 44% of comp listings sitting > 30 days — soft ceiling on asking rent; 235 units permitted in Orange County in 2024 (50 in 5+ unit buildings).
Forward outlook
- In year one you build about $630 of equity ($256 loan paydown + $374 appreciation (1.0% local appreciation)).
- Orange County population projected at +6% by 2050 — modest demand growth; plan on rents tracking national, not racing it.
- At projected returns (1.0% appreciation + 5.7% rent growth), your $10k cash investment doubles in ~2 years — after that, you're playing with house money.
Negotiation context
- It's been on market 41 days — a 3% lower offer ($36k) is reasonable based on typical stale-listing flexibility.
- 4 sale attempts since 7y ago with the ask held roughly flat each time — persistent listings suggest the price (not the market) is what's stuck; bring a comps-based counter.
Risks & watch-outs
- Watch-outs: flood insurance adds $427/mo; built in 1930 — expect roof / HVAC / electrical / plumbing capex.
- Climate carrying-cost: in FEMA flood zone AE (mandatory federal flood insurance); severe wind risk, 99% chance of damaging wind over 30y; extreme-heat days projected 7→24/yr by 2055 (HVAC capex compounding) — expect insurance premiums to compound above CPI over the hold.
Questions for the listing agent
- It's been on market 41 days. Have you received any prior offers? Is the seller open to a 3% concession, seller financing, or rate buy-down credit?
- Built in 1930 — when were the roof, HVAC, electrical panel, plumbing, and water heater last replaced?
- What's the actual annual flood-insurance premium (NFIP or private), and is the property in a SFHA with mandatory coverage?
- Is there a deadline driving the sale (1031 exchange, divorce, estate, relocation)? That informs how much negotiation room exists.
- Schools are D-rated, which usually means shorter tenancies and higher turnover. Who's the typical renter profile here, and what's been the actual vacancy rate?
- Crime grade is D in this area — have there been break-ins, vandalism, or insurance claims at this property in the last 3 years? What carrier currently insures it and at what premium?
- The area grade is low — what's the realistic commute time and amenity access for the typical tenant pool here? Any planned neighborhood developments (good or bad) we should know about?
- What's the average days-on-market for RENTAL listings here right now (not sales)? A rising rental-DOM trend means longer vacancies and softer asking-rent achievability than the comps imply.
- What's the recent tenant-quality profile in this submarket — average credit score on applications, eviction rate, late-payment / NSF rate, and stable-employment percentage? A property-management company in the area should have these aggregated.
- How much new for-sale + rental construction is in the pipeline within 1–3 miles? Heavy new supply typically softens prices + rents 12–24 months out; constrained supply supports both.
Investment metrics
- 1% rule
- 4.35% ✓
- Cap rate
- 39.19%
- Cash-on-cash
- 117.51%
- DSCR
- 6.23
- GRM
- 1.9
CMA / ARV
- ARV (median comp)
- $106,463
- List price
- $37,000
- Delta
- -65.25%
- Verdict
- UNDERPRICED
- Comps
- 20 within 1.0 mi
Show comp detail 2 sales within ~0.75 mi
| Address | Dist | Beds/Ba | Sqft | Sold | Price | $/sf | Match |
|---|---|---|---|---|---|---|---|
| 2241 Cross Ln | 0.59mi | 3/2.0 (-1) | 1,571 (-4%) | 1mo | $28,999 | $18 | 56 |
| 1210 17th St | 0.71mi | 3/2.0 (-1) | 1,877 (+15%) | 15mo | $45,000 | $24 | 21 |
Match score weights: distance 35% · size 25% · config 20% · recency 20%. Top-matched comps best support the ARV.
Projected returns pro-forma
1.01% appreciation · 5.71% rent growth · sell at horizon
- IRR
- 75.4%
- Equity multiple
- 5.15×
- Total profit
- $42,944
- Equity at exit
- $12,650
- IRR
- 77.7%
- Equity multiple
- 11.93×
- Total profit
- $113,279
- Equity at exit
- $16,826
Cash invested: $10,360 (down + closing). Projections, not guarantees.
Landlord ↔ Tenant lean methodology
- Overall (STATE)
- 87 Strongly Landlord-Friendly
- State Texas
- 87 Strongly Landlord-Friendly · R+5
- County
- — inherits STATE
- City
- — inherits STATE
ZIP-level market 77630
- Home prices YoY
- 0.4%
- Rents YoY
- 5.7%
- Active inventory
- 337
- Price-to-rent
- 1.9×
Monthly cashflow live
- Estimated rent
- $1,608 high interval (Pro) →
- Mortgage (P&I)
- −$194
- Tax est. 1.5%
- −$46 /mo · $555/yr
- Insurance
- −$15
- Flood insurance flood zone
- −$427 /mo · $5,118/yr
- HOA
- −$0
- Vacancy / Maint / Mgmt
- −$338
- Net cashflow
- $588
Break-even live
UW: 25.0% down · 7.5% · 30yr · 1.5% tax · 5.0% vac · 8.0% maint · 8.0% mgmt
Financing live
Cash to close
- Down payment
- $9,250
- Closing costs
- $1,110
- Reserves months
- —
- Total cash needed
- —
Loan-product check · same deal, 3 products live
Conventional
25% down · 7.5% · 30yr
- Down + closing
- —
- Monthly P&I
- —
- Monthly cashflow
- —
- DSCR
- —
- Eligible?
- —
Personal DTI + credit; lowest rate.
DSCR
20% down · 8.5% · 30yr
- Down + closing
- —
- Monthly P&I
- —
- Monthly cashflow
- —
- DSCR
- —
- Eligible?
- —
No personal income docs; deal must DSCR.
Hard money
10% down · 12.0% · 12mo
- Down + closing
- —
- Monthly P&I
- —
- Monthly cashflow
- —
- DSCR
- —
- Eligible?
- —
Short-term bridge; refi at stabilization.
Rent comps 9 comps
| Address | Beds | Baths | Sqft | Rent | $/sqft | DOM | Units | Dist |
|---|---|---|---|---|---|---|---|---|
| 1205 Wrenway Orange, TX | 4.0 | 2.0 | 1551 | $1,775 | $1.14 | 14d | 1 | 0.41mi |
| 1885 E Farragut Ave Orange, TX | 1.0–3.0 | 1.0–2.5 | 1023 | $1,049 | $1.02 | 13d | 9 | 0.58mi |
| 3 Pacific Cir Orange, TX | 4.0 | 1.0 | 1361 | $1,500 | $1.10 | 21d | 1 | 0.71mi |
| 1030 Clairmont Dr Orange, TX | 3.0 | 2.0 | 1372 | $1,850 | $1.35 | 21d | 1 | 0.73mi |
| 1010 N 16th St Orange, TX | 3.0 | 1.5 | 1100 | $1,500 | $1.36 | 44d | 1 | 0.74mi |
| 1117 18th St Orange, TX | 4.0 | 2.0 | 1716 | $1,500 | $0.87 | 44d | 1 | 0.79mi |
| 9 W Eads Ave Orange, TX | 3.0 | 2.0 | 1255 | $1,400 | $1.12 | 44d | 1 | 0.80mi |
| 2208 Monterrey Dr Orange, TX | 3.0 | 1.0 | 1132 | $1,200 | $1.06 | 44d | 1 | 1.13mi |
| 2801 W Sunset Dr Orange, TX | 1.0–3.0 | 1.0–2.0 | 1113 | $1,400 | $1.26 | 13d | 27 | 1.45mi |
Listing history 28 events
-
2026-06-18days on market $37,000 Active 41 DOM
-
2026-06-17days on market $37,000 Active 40 DOM
-
2026-06-16days on market $37,000 Active 39 DOM
-
2026-06-15days on market $37,000 Active 38 DOM
-
2026-06-14days on market $37,000 Active 36 DOM
-
2026-06-13days on market $37,000 Active 35 DOM
-
2026-06-10days on market $37,000 Active 33 DOM
-
2026-06-09days on market $37,000 Active 32 DOM
-
2026-06-08days on market $37,000 Active 31 DOM
-
2026-06-07days on market $37,000 Active 30 DOM
-
2026-06-03days on market $37,000 Active 26 DOM
-
2026-06-02days on market $37,000 Active 25 DOM
-
2026-06-01days on market $37,000 Active 24 DOM
-
2026-05-31days on market $37,000 Active 23 DOM
-
2026-05-30days on market $37,000 Active 22 DOM
-
2026-05-08$37,000 Active 558-char remark
-
2026-05-06historical
-
2026-02-25price $37,000
-
2026-02-25price $37,000
-
2026-02-05status Active
-
2026-01-31status Pending
-
2026-01-06price $41,000
-
2026-01-06$41,000 Active
-
2025-12-17price $45,000
-
2025-12-05price $59,000
-
2019-06-13soldstatus
-
2019-06-13soldstatus
-
2019-05-17$30,000
ⓘ Source: listings_history table (triggers on properties + properties_extension) + one-shot
backfill from property_details.listing_events for pre-trigger history.
Climate risk First Street
- Flood 8/10 Severe FEMA zone AE · 96% chance over 30 yrs
- Wildfire 2/10 Low
- Heat 9/10 Extreme 7 d/yr ≥109°F today · 24 d/yr by 30 yrs out
- Wind 9/10 Extreme 99% chance of damaging wind over 30 yrs
- Air quality 3/10 Moderate 2 unhealthy d/yr today · 3 by 30 yrs out
Nearby sold comps map
Loading sold comps map…
Walkable amenities ~0.75 mi
Loading nearby amenities…
Taxation est. · year 1
- Rental income
- $19,294
- − Mortgage interest
- −$2,073
- − Property taxes
- −$555
- − Insurance
- −$5,304
- − Repairs & maintenance
- −$1,543
- − Management
- −$1,543
- − Depreciation
- −$1,076
- Taxable income
- $7,199
- Est. tax owed @ 24.0%
- −$1,728
- After-tax cash flow
- $5,327/yr
For passive investors: Depreciation is non-cash, so a rental often shows a tax loss while cash-flowing — sheltering income. Rental losses are passive: they offset passive income freely, and up to $25,000/yr can offset ordinary (W-2) income if you actively participate and your MAGI is under $100k (phasing out to $0 by $150k); unused losses carry forward. On sale, claimed depreciation is recaptured at up to 25%, and gains may owe capital-gains tax (a 1031 exchange can defer both). Figures are a year-1 estimate at your 24.0% rate — not tax advice; consult a CPA.
Schools (NCES district)
- District
- West Orange-Cove CISD
- NCES district ID
- 4845090
- Math proficiency
- 17% ▼ -7.00%
- Reading proficiency
- 21% ▼ -2.00%
- Median HH income
- $37,329
- Composite
- 15.86/100
- National rank
- #9260
- State rank
- #784 of 826 in TX
Livability — Orange
- Score
- 71/100
- State rank
- #286
- US rank
- #6456
Category grades
Schools grade is shown separately in the Schools card above.
Census & demographics
- Census place
- Orange, TX
- County
- Orange County · 87,112 people
- City population
- 22,976
- Metro
- Beaumont-Port Arthur, TX
- Population (ZIP)
- 28,983
- Household income
- $64,373
- Rent vs Own
- Severe rent burden
- 1018.0
Population outlook (Orange County) Hauer SSP2
- Today (2025)
- 88,065 people
- By 2030
- 89,591 · +1.7%
- By 2040
- 91,982 · +4.4%
- By 2050
- 93,023 · +5.6%
- By 2075
- 94,871 · +7.7%
- By 2100
- 88,155 · +0.1%
Race, ethnicity, and origin ACS 2023
- Neighborhood character
- Majority White (64%)
- Race & ethnicity
- White 64% Black 21% Hispanic / Latino 11% Two or more races 9%
- Hispanic origin (detail)
- Mexican 7%
- Common ancestry
- Lithuanian 13% Italian 1% Slovak 1%
- Foreign-born
- 5% · Canada
- Languages at home
- 91% English-only · Spanish 7% French/Haitian/Cajun 1% Other Asian/Pacific 1%
Political lean MEDSL · Orange
- 2024 margin
- Solid R (+66.8) · D 16.4% · R 83.1%
- 2008→2024 swing
- -19.6pp toward R · 2008: -47.1pp · 2024: -66.8pp
- All cycles
- 2024: R+66.8 2020: R+63.4 2016: R+61.9 2012: R+54.3 2008: R+47.1
Not yet ingested
- Civics
- —
Market trends
- HPI YoY
- ▲ 1.01%
- Current HPI
- 264.14
- Rent YoY
- ▲ 5.71%
- Metro
- Beaumont-Port Arthur, TX
- State GDP YoY
- ▲ 3.95%
- F500 in state
- 110
Industry mix (Fortune 500 HQ in TX)
| Industry | F500 HQs | Revenue |
|---|---|---|
| Energy | 16 | $1,198B |
|
||
| Technology | 5 | $198B |
|
||
| Engineering / Construction | 4 | $72B |
|
||
| Energy Services | 3 | $60B |
|
||
| Utilities | 3 | $41B |
|
||
| Healthcare | 2 | $330B |
|
||
Price history
+23.3% since first listed13 events — show timeline
- 2026-05-08 Listed $37,000 BBOR
- 2026-05-06 Listing Removed — HARMLS
- 2026-02-25 Price Changed $37,000 BBOR
- 2026-02-25 Price Changed $37,000 HARMLS
- 2026-02-05 Relisted — HARMLS
- 2026-01-31 Pending — HARMLS
- 2026-01-06 Price Changed $41,000 BBOR
- 2026-01-06 Listed $41,000 HARMLS
- 2025-12-17 Price Changed $45,000 BBOR
- 2025-12-05 Price Changed $59,000 BBOR
- 2019-06-13 Sold (Public Records) — Public Records
- 2019-06-13 Sold (MLS) — BBOR
- 2019-05-17 Listed $30,000 BBOR
Property tax history
+6.9%/yrLatest (2025): $2,488 · +6.1% YoY. Source: county tax records.
Cash-flow waterfall
monthlySold comps — $/sqft
last 12 mo · ≤1 miLoading sold comps…