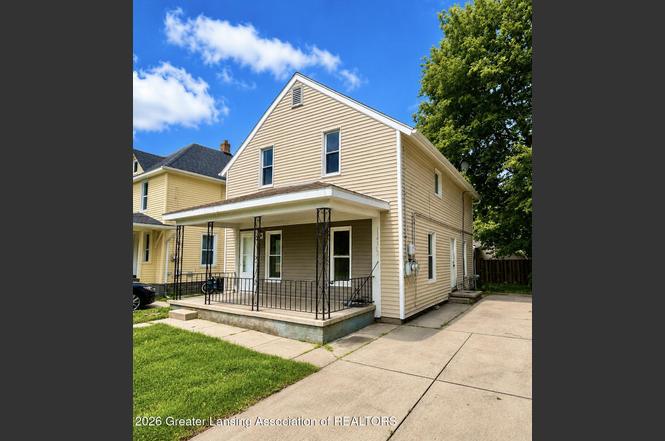
1143 Farrand St · Lansing, MI
Flood risk 1/10 · Minimal
- FEMA flood zone
- X (unshaded)
- Chance of flooding over 30 yrs
- 0.0%
- Est. flood insurance / yr
- $507 – $1,088
Fire risk 1/10 · Minimal
- Est. fire insurance / yr
- $784 – $1,456
Heat risk 2/10 · Minimal
- Hot days now (above 97°F)
- 7 days/yr
- Hot days in 30 yrs
- 16 days/yr
Wind risk 2/10 · Minimal
- Chance of severe wind over 30 yrs
- —
Air-quality risk 2/10 · Minimal
- Unhealthy air days now
- 1 days/yr
- Unhealthy air days in 30 yrs
- 2 days/yr
Risk factors via First Street. Map © Google.
Why this score? — see what drove the D+ grade
The composite is a weighted blend of 9 inputs, each scored 0–100. Each bar is that input's sub-score; the figure is the points it added to the 100-point composite (weight × sub-score).
- Cash flow +16.8/30.0
- 1% rule +5.7/10.0
- DSCR +5.2/10.0
- Rent growth +5.0/5.0
- ARV discount +4.5/15.0
- Livability +4.0/5.0
- Condition / age +2.5/5.0
- Schools +1.9/10.0
- Appreciation +0.0/10.0
$130,000
🖨 Deal sheet 📄 Offer letter ✓ Due diligence
Listing remarks MLS
INVESTMENT OPPORTUNITY DUPLEX in the heart of Lansing's Northtown district: - Close to schools, shopping, the downtown stadium/hospital/groesbeck golf course & MSU Campus. (2) 2 bdrm/1bath units - interiors are clean and neat - Ready to cash flow. Small yard, easy to maintain. Both units are vacant - fantastic owner-occupied or pick your new tenants opportunity. Now is the time to be investing and building equity/monthly cash flows. Enjoy your tour!
Key facts
- Close to hospital
- Close to schools
- Northtown district
Tags
Property features AI
Finance
- Other: Two-unit property
Exterior
- Parking: Driveway; Total of 2 parking spaces; No attached garage
- Security: Security lights
- Utilities: Public sewer
- Home design: Multi-story (Two levels); Built in 1908; City street frontage
- Construction: Vinyl and aluminum siding; Shingle roof; Block foundation
- Exterior features: Covered front porch; Lighting; Back yard; Front yard; Level, rectangular city lot
Interior
- Flooring: Ceramic tile; Hardwood; Combination flooring
- Heating & cooling: Forced air heating; No central air / no cooling
- Interior features: Gas water heater; Private entrance; Security lights; Insulated windows
- Laundry & utility: Laundry located in basement; Circuit breaker electrical panel
Neighborhood map
What this means for you Summary
Snapshot
- This is a ?-bed/2.0-bath single-family listed at $130k.
Deal economics
- At list price, monthly cash flow is $83 ($995/yr) — positive.
- The deal already cash-flows at list — no discount required.
- Meets the 1% rule at list price ($1k rent vs $130k).
Location & tenants
- Location reads 79/100 on livability (#94 in MI, #2,182 nationally) — a middle-class / working-renter tenant base. Strengths: amenities A+, commute A+, cost of living A+; Watch: employment D, schools F, crime F.
- Lansing Public School District (urban): math 14% / reading 23% proficiency, ranked #650 of 760 in MI (top 86%) — low school quality limits family demand, transient renter base, plan for 1-2y turnover; 68% free/reduced lunch — lower-income household profile, screen leases tightly.
- Market conditions: Rents rising fast (+10.5%/yr); 138 active listings in the ZIP; 30 comparable units currently listed for rent nearby; rentals lingering (median 44d on market — plan ~5-8 weeks vacancy on turnover, expect pricing pressure); 67% of comp listings sitting > 30 days — soft ceiling on asking rent; 350 units permitted in Ingham County in 2024 (186 in 5+ unit buildings).
Forward outlook
- Local home prices are declining (-3.0%/yr); year-one equity from $899 of loan paydown is wiped out by about $4k of value loss. Plan a longer hold.
- Ingham County population projected at +11% by 2050 — modest demand growth; plan on rents tracking national, not racing it.
- At projected returns (-3.0% appreciation + 8.0% rent growth), your $36k cash investment doubles in ~10 years — after that, you're playing with house money.
Negotiation context
- Only 1 days on market — expect competitive offers; lowballing is unlikely to land.
- 9 sale attempts since 18y ago with the ask held roughly flat each time — persistent listings suggest the price (not the market) is what's stuck; bring a comps-based counter.
- Current owner paid $84k; list at $130k implies a 56% gain — meaningful room to come down on a strong offer.
Risks & watch-outs
- Watch-outs: property tax is 2.6% of price; built in 1908 — expect roof / HVAC / electrical / plumbing capex.
Questions for the listing agent
- Built in 1908 — when were the roof, HVAC, electrical panel, plumbing, and water heater last replaced?
- Property tax is high relative to price — has the assessment been appealed recently, and will the sale trigger a re-assessment?
- Is there a deadline driving the sale (1031 exchange, divorce, estate, relocation)? That informs how much negotiation room exists.
- Schools are F-rated, which usually means shorter tenancies and higher turnover. Who's the typical renter profile here, and what's been the actual vacancy rate?
- Crime grade is F in this area — have there been break-ins, vandalism, or insurance claims at this property in the last 3 years? What carrier currently insures it and at what premium?
- The area grade is low — what's the realistic commute time and amenity access for the typical tenant pool here? Any planned neighborhood developments (good or bad) we should know about?
- What's the average days-on-market for RENTAL listings here right now (not sales)? A rising rental-DOM trend means longer vacancies and softer asking-rent achievability than the comps imply.
- What's the recent tenant-quality profile in this submarket — average credit score on applications, eviction rate, late-payment / NSF rate, and stable-employment percentage? A property-management company in the area should have these aggregated.
- How much new for-sale + rental construction is in the pipeline within 1–3 miles? Heavy new supply typically softens prices + rents 12–24 months out; constrained supply supports both.
Investment metrics
- 1% rule
- 1.07% ✓
- Cap rate
- 7.06%
- Cash-on-cash
- 2.73%
- DSCR
- 1.12
- GRM
- 7.8
CMA / ARV
- ARV (on-the-fly)
- $121,800
- Comps found
- 12
Show comp detail 12 sales within ~0.75 mi
| Address | Dist | Beds/Ba | Sqft | Sold | Price | $/sf | Match |
|---|---|---|---|---|---|---|---|
| 1141 Farrand St | 0.01mi | 4/1.5 | 1,343 (-4%) | 4mo | $125,000 | $93 | 87 |
| 1115 Porter St | 0.10mi | 3/1.5 | 1,296 (-7%) | 1mo | $66,500 | $51 | 80 |
| 1415 New York Ave | 0.21mi | 3/1.0 | 1,455 (+4%) | 0mo | $106,000 | $73 | 79 |
| 925 May St | 0.35mi | 3/1.5 | 1,414 (+1%) | 2mo | $205,000 | $145 | 78 |
| 1508 Ohio Ave | 0.30mi | 3/2.0 | 1,320 (-6%) | 1mo | $156,900 | $119 | 76 |
| 901 E César E. Chávez Ave | 0.24mi | 4/1.5 | 1,498 (+7%) | 1mo | $140,000 | $93 | 74 |
| 838 May St | 0.40mi | 4/2.0 | 1,378 (-2%) | 5mo | $112,000 | $81 | 74 |
| 1430 Massachusetts Ave | 0.21mi | 4/1.0 | 1,325 (-5%) | 6mo | $121,000 | $91 | 72 |
| 1017 Whyte St | 0.50mi | 5/2.0 | 1,444 (+3%) | 4mo | $90,000 | $62 | 68 |
| 1613 Massachusetts Ave | 0.37mi | 3/2.0 | 1,500 (+7%) | 4mo | $129,900 | $87 | 68 |
| 2112 N High St | 0.67mi | 4/1.0 | 1,217 (-13%) | 1mo | $15,000 | $12 | 42 |
| 430 Pearl St | 0.62mi | 3/2.5 | 1,608 (+15%) | 5mo | $90,000 | $56 | 40 |
Match score weights: distance 35% · size 25% · config 20% · recency 20%. Top-matched comps best support the ARV.
Projected returns pro-forma
-3.0% appreciation · 8.0% rent growth · sell at horizon
- IRR
- -5.8%
- Equity multiple
- 0.77×
- Total profit
- $-8,336
- Equity at exit
- $19,383
- IRR
- 9.5%
- Equity multiple
- 1.92×
- Total profit
- $33,398
- Equity at exit
- $11,240
Cash invested: $36,400 (down + closing). Projections, not guarantees.
Landlord ↔ Tenant lean methodology
- Overall (STATE)
- 62 Landlord-Friendly
- State Michigan
- 62 Landlord-Friendly · EVEN
- County
- — inherits STATE
- City
- — inherits STATE
ZIP-level market 48906
- Rents YoY
- 10.5%
- Active inventory
- 138
- Price-to-rent
- 7.8×
Monthly cashflow live
- Estimated rent
- $1,392 high interval (Pro) →
- Mortgage (P&I)
- −$682
- Tax from tax record
- −$281 /mo · $3,367/yr
- Insurance
- −$54
- HOA
- −$0
- Vacancy / Maint / Mgmt
- −$292
- Net cashflow
- $83
Break-even live
UW: 25.0% down · 7.5% · 30yr · 1.5% tax · 5.0% vac · 8.0% maint · 8.0% mgmt
Financing live
Cash to close
- Down payment
- $32,500
- Closing costs
- $3,900
- Reserves months
- —
- Total cash needed
- —
Loan-product check · same deal, 3 products live
Conventional
25% down · 7.5% · 30yr
- Down + closing
- —
- Monthly P&I
- —
- Monthly cashflow
- —
- DSCR
- —
- Eligible?
- —
Personal DTI + credit; lowest rate.
DSCR
20% down · 8.5% · 30yr
- Down + closing
- —
- Monthly P&I
- —
- Monthly cashflow
- —
- DSCR
- —
- Eligible?
- —
No personal income docs; deal must DSCR.
Hard money
10% down · 12.0% · 12mo
- Down + closing
- —
- Monthly P&I
- —
- Monthly cashflow
- —
- DSCR
- —
- Eligible?
- —
Short-term bridge; refi at stabilization.
Rent comps 30 comps
| Address | Beds | Baths | Sqft | Rent | $/sqft | DOM | Units | Dist |
|---|---|---|---|---|---|---|---|---|
| 1102 Clark St Lansing, MI | 3.0 | 1.0 | 1232 | $1,550 | $1.26 | 21d | 1 | 0.18mi |
| 1561 Massachusetts Ave Lansing, MI | 3.0 | 2.0 | 1100 | $1,400 | $1.27 | 44d | 1 | 0.32mi |
| 832 N Larch St Apt 3 Lansing, MI | 2.0 | 1.0 | 890 | $1,095 | $1.23 | 44d | 1 | 0.54mi |
| 620 May St Lansing, MI | 1.0–2.0 | 1.0–2.0 | 1126 | $1,578 | $1.40 | 14d | 12 | 0.55mi |
| 921 Linden Grove Ave Lansing, MI | 3.0 | 1.0 | 1694 | $1,499 | $0.88 | 44d | 1 | 0.56mi |
| 1228 N Fairview Ave Lansing, MI | 3.0 | 2.0 | 1100 | $1,700 | $1.55 | 44d | 1 | 0.72mi |
| 936 N Fairview Ave Lansing, MI | 1.0–2.0 | 1.0 | 825 | $1,245 | $1.51 | 44d | 2 | 0.78mi |
| 1715 Peppertree Ln Lansing, MI | 2.0–3.0 | 1.5 | 1120 | $1,495 | $1.33 | 44d | 2 | 0.85mi |
| 113 Pere Marquette Dr Lansing, MI | 1.0–2.0 | 1.0–2.0 | 1065 | $2,250 | $2.11 | 14d | 9 | 0.99mi |
| 1629 E Michigan Ave Unit 306 Lansing, MI | 2.0 | 1.0 | 901 | $1,550 | $1.72 | 44d | 1 | 1.01mi |
| 414 N Hayford Ave Lansing, MI | 3.0 | 1.0 | 990 | $1,425 | $1.44 | 44d | 1 | 1.05mi |
| 2620 Senate Dr Lansing, MI | 1.0–2.0 | 1.0–2.0 | 950 | $1,800 | $1.89 | 44d | 1 | 1.07mi |
| 323 W Saginaw St Unit 1 Lansing, MI | 1.0 | 1.0 | 1000 | $1,000 | $1.00 | 44d | 1 | 1.18mi |
| 1115 Chester Rd Unit Two Bedroom Lansing, MI | 2.0 | 1.5 | 1100 | $1,200 | $1.09 | 44d | 1 | 1.19mi |
| 433 Seymour Ave Unit 3 Lansing, MI | 3.0 | 1.0 | 1250 | $1,395 | $1.12 | 44d | 1 | 1.21mi |
| 524 N Walnut St Lansing, MI | 2.0 | 1.0 | 1000 | $1,150 | $1.15 | 44d | 1 | 1.22mi |
| 2222 E Michigan Ave Unit 411 Lansing, MI | 2.0 | 2.0 | 900 | $1,700 | $1.89 | 21d | 1 | 1.24mi |
| 2222 E Michigan Ave Unit 206 Lansing, MI | 2.0 | 2.0 | 900 | $1,700 | $1.89 | 44d | 1 | 1.24mi |
| 409 Lathrop St Lansing, MI | 2.0 | 1.0 | 1342 | $1,500 | $1.12 | 21d | 1 | 1.25mi |
| 2937 Kenwick Cir Unit 2928 2931 2936 Lansing, MI | 2.0 | 1.0 | 922 | $999 | $1.08 | 21d | 1 | 1.29mi |
| 507 S Hosmer St Lansing, MI | 2.0 | 1.0 | 1120 | $1,075 | $0.96 | 44d | 1 | 1.31mi |
| 805 Bement St Unit Hosmer 507 Lansing, MI | 2.0 | 1.0 | 1120 | $1,075 | $0.96 | 44d | 1 | 1.33mi |
| 329 S Clemens Ave Lansing, MI | 3.0 | 1.0 | 1194 | $1,400 | $1.17 | 21d | 1 | 1.34mi |
| 2520 Lake Lansing Rd Lansing, MI | 2.0 | 2.0 | 1049 | $1,668 | $1.59 | 14d | 13 | 1.35mi |
| 2417 Kerry St Unit 11 Lansing, MI | 2.0 | 1.0 | 900 | $1,000 | $1.11 | 44d | 1 | 1.39mi |
| 712 N Sycamore St Lansing, MI | 3.0 | 1.0 | 1100 | $1,650 | $1.50 | 21d | 1 | 1.40mi |
| 610 N Sycamore St Unit 1 Lansing, MI | 1.0 | 1.0 | 900 | $875 | $0.97 | 14d | 1 | 1.41mi |
| 731 N Sycamore St Unit 1 Lansing, MI | 2.0 | 1.0 | 950 | $945 | $0.99 | 44d | 1 | 1.42mi |
| 401 S Washington Sq Unit 205 Lansing, MI | 2.0 | 1.0 | 968 | $1,355 | $1.40 | 44d | 1 | 1.47mi |
| 401 S Washington Sq Unit 201 Lansing, MI | 3.0 | 1.0 | 1254 | $1,560 | $1.24 | 44d | 1 | 1.47mi |
Listing history 2 events
-
2026-06-19remarks 457-char remark
-
2026-06-19$130,000 Active 1 DOM
ⓘ Source: listings_history table (triggers on properties + properties_extension) + one-shot
backfill from property_details.listing_events for pre-trigger history.
Tax reassessment forecast MI · Partial reset (capped growth)
- Current annual tax
- $3,367 · $281/mo
- Projected year-2 tax
- $3,367 · $281/mo
- Expected delta
- $0/yr ($0/mo · 0.0%)
ⓘ Screening estimate from a state-policy table — verify with the county assessor before closing.
Climate risk First Street
- Flood 1/10 Low FEMA zone X (unshaded) · 0% chance over 30 yrs
- Wildfire 1/10 Low
- Heat 2/10 Low 7 d/yr ≥97°F today · 16 d/yr by 30 yrs out
- Wind 2/10 Low
- Air quality 2/10 Low 1 unhealthy d/yr today · 2 by 30 yrs out
Nearby sold comps map
Loading sold comps map…
Walkable amenities ~0.75 mi
Loading nearby amenities…
Taxation est. · year 1
- Rental income
- $16,700
- − Mortgage interest
- −$7,282
- − Property taxes
- −$3,367
- − Insurance
- −$650
- − Repairs & maintenance
- −$1,336
- − Management
- −$1,336
- − Depreciation
- −$3,782
- Taxable loss
- −$1,053
- Est. tax savings @ 24.0%
- +$253
- After-tax cash flow
- $1,248/yr
For passive investors: Depreciation is non-cash, so a rental often shows a tax loss while cash-flowing — sheltering income. Rental losses are passive: they offset passive income freely, and up to $25,000/yr can offset ordinary (W-2) income if you actively participate and your MAGI is under $100k (phasing out to $0 by $150k); unused losses carry forward. On sale, claimed depreciation is recaptured at up to 25%, and gains may owe capital-gains tax (a 1031 exchange can defer both). Figures are a year-1 estimate at your 24.0% rate — not tax advice; consult a CPA.
Schools (NCES district)
- District
- Lansing Public School District
- NCES district ID
- 2621150
- Math proficiency
- 14% ▲ 1.00%
- Reading proficiency
- 23% ▲ 3.00%
- Median HH income
- $37,453
- Composite
- 18.76/100
- National rank
- #14002
- State rank
- #650 of 760 in MI
Livability — Lansing
- Score
- 79/100
- State rank
- #94
- US rank
- #2182
Category grades
Schools grade is shown separately in the Schools card above.
Census & demographics
- Census place
- Lansing, MI
- County
- Ingham County · 237,052 people
- City population
- 161,269
- Metro
- Lansing-East Lansing, MI
- Population (ZIP)
- 25,901
- Household income
- $64,315
- Rent vs Own
- Severe rent burden
- 851.0
Population outlook (Ingham County) Hauer SSP2
- Today (2025)
- 300,362 people
- By 2030
- 307,808 · +2.5%
- By 2040
- 320,492 · +6.7%
- By 2050
- 333,223 · +10.9%
- By 2075
- 373,693 · +24.4%
- By 2100
- 392,021 · +30.5%
Race, ethnicity, and origin ACS 2023
- Neighborhood character
- Diverse neighborhood (Simpson 0.56)
- Race & ethnicity
- White 64% Black 15% Two or more races 12% Hispanic / Latino 12% Asian 2%
- Hispanic origin (detail)
- Mexican 9%
- Common ancestry
- Romanian 3% Lithuanian 2% Iranian 2%
- Foreign-born
- 6% · Canada, China
- Languages at home
- 88% English-only · Spanish 5% Other Asian/Pacific 1% French/Haitian/Cajun 1%
Political lean MEDSL · Ingham
- 2024 margin
- Strong D (+29.7) · D 63.9% · R 34.2% · Other 2.0%
- 2008→2024 swing
- -3.6pp toward R · 2008: 33.3pp · 2024: 29.7pp
- All cycles
- 2024: D+29.7 2020: D+32.2 2016: D+27.6 2012: D+27.9 2008: D+33.3
Not yet ingested
- Civics
- —
Market trends
- HPI YoY
- ▼ -135.54%
- Current HPI
- 228.7023
- Rent YoY
- ▲ 10.50%
- Metro
- Lansing-East Lansing, MI
- State GDP YoY
- ▲ 1.37%
- F500 in state
- 28
Industry mix (Fortune 500 HQ in MI)
| Industry | F500 HQs | Revenue |
|---|---|---|
| Automotive Parts | 3 | $48B |
|
||
| Automotive | 2 | $372B |
|
||
| Chemicals | 1 | $45B |
|
||
| Automotive Retail | 1 | $29B |
|
||
| Healthcare / Medical Devices | 1 | $23B |
|
||
| Automotive Technology | 1 | $20B |
|
||
Price history
+68.2% since first listed20 events — show timeline
- 2026-06-18 Listed $130,000 REALCOMP
- 2026-06-18 Listed $130,000 Greater Lansing AoR
- 2022-10-14 Sold (Public Records) $83,500 Public Records
- 2022-10-07 Sold (MLS) $83,500 Greater Lansing AoR
- 2022-10-07 Sold (MLS) $83,500 REALCOMP
- 2022-09-02 Listed $89,900 Greater Lansing AoR
- 2022-09-02 Listed $89,900 REALCOMP
- 2022-05-19 Listing Removed — REALCOMP
- 2022-05-19 Listing Removed — Greater Lansing AoR
- 2022-04-26 Price Changed $89,900 Greater Lansing AoR
- 2022-04-26 Relisted — Greater Lansing AoR
- 2022-04-25 Listing Removed — Greater Lansing AoR
- 2022-01-17 Price Changed $115,400 Greater Lansing AoR
- 2022-01-04 Listed $89,900 REALCOMP
- 2022-01-04 Listed $99,900 Greater Lansing AoR
- 2009-12-03 Listing Removed — Greater Lansing AoR
- 2009-06-03 Listed $49,000 Greater Lansing AoR
- 2009-02-25 Sold (MLS) $15,000 Greater Lansing AoR
- 2008-09-04 Listed $17,000 Greater Lansing AoR
- 2006-04-06 Sold (Public Records) $77,300 Public Records
Property tax history
+6.2%/yrLatest (2025): $3,367 · +2.9% YoY. Source: county tax records.
Cash-flow waterfall
monthlySold comps — $/sqft
last 12 mo · ≤1 miLoading sold comps…