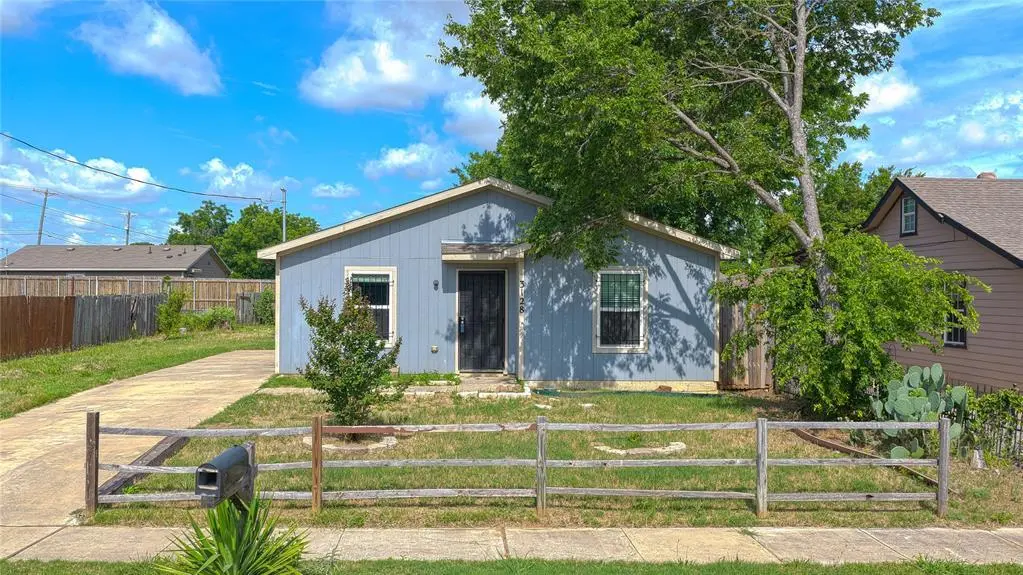
3128 Bright St · Fort Worth, TX
Flood risk 1/10 · Minimal
- FEMA flood zone
- X (unshaded)
- Chance of flooding over 30 yrs
- 0.0%
- Est. flood insurance / yr
- $507 – $1,088
Fire risk 1/10 · Minimal
- Est. fire insurance / yr
- $1,222 – $2,270
Heat risk 7/10 · Major
- Hot days now (above 109°F)
- 7 days/yr
- Hot days in 30 yrs
- 23 days/yr
Wind risk 5/10 · Moderate
- Chance of severe wind over 30 yrs
- 26.0%
Air-quality risk 3/10 · Minor
- Unhealthy air days now
- 3 days/yr
- Unhealthy air days in 30 yrs
- 4 days/yr
Risk factors via First Street. Map © Google.
Why this score? — see what drove the C grade
The composite is a weighted blend of 9 inputs, each scored 0–100. Each bar is that input's sub-score; the figure is the points it added to the 100-point composite (weight × sub-score).
- Cash flow +15.4/30.0
- ARV discount +13.9/15.0
- Appreciation +10.0/10.0
- 1% rule +5.0/10.0
- DSCR +4.7/10.0
- Livability +4.0/5.0
- Rent growth +2.5/5.0
- Condition / age +2.5/5.0
- Schools +2.0/10.0
$159,900
🖨 Deal sheet (PDF) 📄 Offer letter ✓ Due diligence
Listing remarks
Not every opportunity comes wrapped in granite countertops and fresh paint. Some arrive as a blank canvas with a great address, solid bones, and endless possibilities. Located in the shadow of Downtown Fort Worth, this home has already been stripped back to the starting line, eliminating much of the guesswork that often comes with older renovation projects. Literally. The vandalism is unfortunate, but for the right buyer it creates something surprisingly valuable—a clean slate ready for your vision, design choices, and investment strategy. Built in 2020, this 3-bedroom, 2-bath home offers a modern floor plan and the advantage of newer construction compared to many surrounding properti
Key facts
- Modern floor plan
- Newer construction
- 8,320 sq ft lot
Tags
Property features AI
Finance
- Financial info: No second mortgage reported; Loan type: Treat as clear
- HOA & community: No homeowners association
Exterior
- Parking: Driveway parking
- Utilities: City water; City sewer; No municipal utility district
- Home design: Single-family residence; Residential property; Built in 2020; One story
- Construction: Siding and wood construction; Slab foundation
- Exterior features: Lot under 0.5 acre (approx. 0.191 acre); Subdivision: Englewood Heights Add
Interior
- Kitchen: Kitchen (10 x 8); Other appliances
- Bedrooms: Primary bedroom (12 x 14) — on main level; Bedroom (12 x 10) — on main level; Bedroom (12 x 10) — on main level
- Bathrooms: 2 full bathrooms
- Heating & cooling: Central heating (electric); Central air conditioning (electric)
- Interior features: One-level layout; 6 total rooms; 1 living area; 1 dining area; Other interior features
- Laundry & utility: No specific laundry details provided
Neighborhood map
What this means for you Summary
Snapshot
- This is a 3-bed/2.0-bath single-family listed at $160k.
Deal economics
- At list price, monthly cash flow is $61 ($733/yr) — positive.
- The deal already cash-flows at list — no discount required.
- To meet the 1% rule (rent ≥ 1% of price), the offer needs to be $159k (0.5% below list).
- Recommended offer: $159k (0.5% below list) — sets the bar for 1% rule.
- Cap rate 6.8% vs local median 3.9% in Fort Worth — top-decile yield for the area; either an underpriced asset or a hidden risk that comps aren't pricing in. Stress-test before assuming the spread holds.
Location & tenants
- Location reads 80/100 on livability (#49 in TX, #1,954 nationally) — a professional / high-income tenant draw. Strengths: amenities A+, cost of living A+, housing A+; Watch: crime F.
- Fort Worth ISD (urban): math 18% / reading 28% proficiency, ranked #742 of 826 in TX (top 90%) — low school quality limits family demand, transient renter base, plan for 1-2y turnover; 73% free/reduced lunch — lower-income household profile, screen leases tightly.
- Zoned schools: T A Sims El (math 13% / reading 21%, grade F, #3,836 of 4,322 statewide, top 91%, 574 students, 98% FRL) — zoned schools average 98% FRL vs 73% district-wide (25 pts higher); higher-poverty schools than district average — tighter screening recommended.
- Market conditions: 100 active listings in the ZIP; 34 comparable units currently listed for rent nearby; rentals at typical pace (median 25d on market — plan ~3-4 weeks tenant-placement turnaround); 44% of comp listings sitting > 30 days — soft ceiling on asking rent; 18,938 units permitted in Tarrant County in 2024 (8,336 in 5+ unit buildings).
Forward outlook
- In year one you build about $17k of equity ($1k loan paydown + $16k appreciation (10.0% local appreciation)).
- Tarrant County population projected at +41% by 2050 — long-run rental-demand tailwind backs the buy-and-hold thesis.
- At projected returns (10.0% appreciation + 3.0% rent growth), your $45k cash investment doubles in ~3 years — after that, you're playing with house money.
- By year 3, paydown + projected appreciation supports a ~$43k cash-out refi (75% LTV) — recoverable capital for the next deal without selling this one.
Negotiation context
- Only 9 days on market — expect competitive offers; lowballing is unlikely to land.
- 3 sale attempts since 6y ago with the ask held roughly flat each time — persistent listings suggest the price (not the market) is what's stuck; bring a comps-based counter.
- Current owner paid $22k; list at $160k implies a 611% gain — meaningful room to come down on a strong offer.
Risks & watch-outs
- Climate carrying-cost: moderate wind risk, 26% chance of damaging wind over 30y; extreme-heat days projected 7→23/yr by 2055 (HVAC capex compounding) — expect insurance premiums to compound above CPI over the hold.
Questions for the listing agent
- Is there a deadline driving the sale (1031 exchange, divorce, estate, relocation)? That informs how much negotiation room exists.
- Schools are D-rated, which usually means shorter tenancies and higher turnover. Who's the typical renter profile here, and what's been the actual vacancy rate?
- Crime grade is F in this area — have there been break-ins, vandalism, or insurance claims at this property in the last 3 years? What carrier currently insures it and at what premium?
- What's the average days-on-market for RENTAL listings here right now (not sales)? A rising rental-DOM trend means longer vacancies and softer asking-rent achievability than the comps imply.
- What's the recent tenant-quality profile in this submarket — average credit score on applications, eviction rate, late-payment / NSF rate, and stable-employment percentage? A property-management company in the area should have these aggregated.
- How much new for-sale + rental construction is in the pipeline within 1–3 miles? Heavy new supply typically softens prices + rents 12–24 months out; constrained supply supports both.
Investment metrics
- 1% rule
- 1.00% ✗
- Cap rate
- 6.75%
- Cash-on-cash
- 1.64%
- DSCR
- 1.07
- GRM
- 8.4
CMA / ARV
- ARV (on-the-fly)
- $186,480
- Comps found
- 12
Show comp detail 12 sales within ~0.75 mi
| Address | Dist | Beds/Ba | Sqft | Sold | Price | $/sf | Match |
|---|---|---|---|---|---|---|---|
| 3671 Forbes St | 0.13mi | 3/1.0 | 1,100 (-1%) | 4mo | $189,000 | $172 | 86 |
| 3919 E Berry St | 0.24mi | 3/1.5 | 1,147 (+3%) | 2mo | $89,989 | $78 | 79 |
| 3420 Thannisch Ave | 0.23mi | 3/1.0 | 1,148 (+3%) | 3mo | $207,000 | $180 | 77 |
| 3775 Castleman St | 0.58mi | 3/2.0 | 1,140 (+3%) | 2mo | $214,900 | $189 | 67 |
| 3750 Sydney St | 0.45mi | 3/1.0 | 1,170 (+5%) | 3mo | $190,000 | $162 | 64 |
| 3222 Grayson St | 0.71mi | 3/2.0 | 1,160 (+4%) | 1mo | $218,000 | $188 | 58 |
| 3624 Baylor St | 0.75mi | 3/1.0 | 1,139 (+3%) | 1mo | $219,000 | $192 | 56 |
| 3000 Burchill Rd S | 0.68mi | 3/2.0 | 1,182 (+6%) | 3mo | $190,000 | $161 | 55 |
| 3617 Bright St | 0.34mi | 3/1.0 | 1,256 (+13%) | 5mo | $125,000 | $100 | 54 |
| 2312 Dillow St | 0.60mi | 3/2.0 | 1,221 (+10%) | 2mo | $205,000 | $168 | 54 |
| 3841 Avenue M | 0.74mi | 3/1.0 | 971 (-12%) | 1mo | $155,000 | $160 | 40 |
| 4248 Bertha Ave | 0.70mi | 3/1.0 | 1,260 (+14%) | 2mo | $140,000 | $111 | 40 |
Match score weights: distance 35% · size 25% · config 20% · recency 20%. Top-matched comps best support the ARV.
Projected returns pro-forma
10.0% appreciation · 3.0% rent growth · sell at horizon
- IRR
- 25.5%
- Equity multiple
- 3.03×
- Total profit
- $91,057
- Equity at exit
- $144,051
- IRR
- 22.4%
- Equity multiple
- 6.92×
- Total profit
- $265,248
- Equity at exit
- $310,651
Cash invested: $44,772 (down + closing). Projections, not guarantees.
Landlord ↔ Tenant lean methodology
- Overall (STATE)
- 87 Strongly Landlord-Friendly
- State Texas
- 87 Strongly Landlord-Friendly · R+5
- County
- — inherits STATE
- City
- — inherits STATE
ZIP-level market 76105
- Home prices YoY
- 14.2%
- Active inventory
- 100
- Price-to-rent
- 8.4×
Monthly cashflow live
- Estimated rent
- $1,591 high interval (Pro) →
- Mortgage (P&I)
- −$839
- Tax from tax record
- −$291 /mo · $3,492/yr
- Insurance
- −$67
- HOA
- −$0
- Vacancy / Maint / Mgmt
- −$334
- Net cashflow
- $61
Break-even live
Sensitivity live
| Price | -10% $152 | -5% $106 | +0% $61 | +5% $16 | +10% $-29 |
|---|---|---|---|---|---|
| Rent | -10% $-65 | -5% $-2 | +0% $61 | +5% $124 | +10% $187 |
| Rate | -1.0pp $142 | -0.5pp $102 | base $61 | +0.5pp $20 | +1.0pp $-22 |
UW: 25.0% down · 7.5% · 30yr · 1.5% tax · 5.0% vac · 8.0% maint · 8.0% mgmt
Financing live
Cash to close
- Down payment
- $39,975
- Closing costs
- $4,797
- Reserves months
- —
- Total cash needed
- —
Loan-product check · same deal, 3 products live
Conventional
25% down · 7.5% · 30yr
- Down + closing
- —
- Monthly P&I
- —
- Monthly cashflow
- —
- DSCR
- —
- Eligible?
- —
Personal DTI + credit; lowest rate.
DSCR
20% down · 8.5% · 30yr
- Down + closing
- —
- Monthly P&I
- —
- Monthly cashflow
- —
- DSCR
- —
- Eligible?
- —
No personal income docs; deal must DSCR.
Hard money
10% down · 12.0% · 12mo
- Down + closing
- —
- Monthly P&I
- —
- Monthly cashflow
- —
- DSCR
- —
- Eligible?
- —
Short-term bridge; refi at stabilization.
Rent comps 34 comps
| Address | Beds | Baths | Sqft | Rent | $/sqft | DOM | Units | Dist |
|---|---|---|---|---|---|---|---|---|
| 3421 Bright St Unit 3421 Fort Worth, TX | 3.0 | 1.0 | 900 | $1,375 | $1.53 | 44d | 1 | 0.17mi |
| 3536 S Littlejohn Ave Unit B Fort Worth, TX | 2.0 | 1.0 | 762 | $1,050 | $1.38 | 44d | 1 | 0.37mi |
| 2701 Vogt St Fort Worth, TX | 3.0 | 2.0 | 1090 | $1,475 | $1.35 | 14d | 1 | 0.46mi |
| 3758 Donalee St Fort Worth, TX | 3.0 | 1.0 | 720 | $1,395 | $1.94 | 44d | 1 | 0.48mi |
| 3211 Bideker Ave Fort Worth, TX | 2.0 | 1.0 | 844 | $1,649 | $1.95 | 44d | 1 | 0.57mi |
| 3816 Avenue N Fort Worth, TX | 3.0 | 1.0 | 1108 | $1,550 | $1.40 | 6d | 1 | 0.66mi |
| 3211 Montague St Fort Worth, TX | 3.0 | 2.0 | 1460 | $1,999 | $1.37 | 44d | 1 | 0.74mi |
| 3731 Avenue M Unit M Fort Worth, TX | 3.0 | 2.0 | 1425 | $1,900 | $1.33 | 23d | 1 | 0.74mi |
| 4220 Ramey Ave Fort Worth, TX | 2.0 | 1.0 | 832 | $1,680 | $2.02 | 6d | 1 | 0.77mi |
| 2825 Bideker Ave Fort Worth, TX | 3.0 | 1.0 | 900 | $1,500 | $1.67 | 25d | 1 | 0.81mi |
| 3155 N Glen Garden Dr Fort Worth, TX | 3.0 | 2.0 | 1254 | $1,995 | $1.59 | 5d | 1 | 0.87mi |
| 4312 Lorin Ave Fort Worth, TX | 4.0 | 2.0 | 1230 | $2,000 | $1.63 | 44d | 1 | 0.88mi |
| 3114 Avenue L Unit 3114 Fort Worth, TX | 3.0 | 1.5 | 860 | $1,350 | $1.57 | 44d | 1 | 0.91mi |
| 4508 Wiman Dr Fort Worth, TX | 3.0 | 2.0 | 1045 | $1,580 | $1.51 | 7d | 1 | 0.93mi |
| 2500 S Edgewood Ter Fort Worth, TX | 1.0–3.0 | 1.0–2.5 | 1123 | $1,895 | $1.69 | 2d | 34 | 1.02mi |
| 2912 Avenue K Fort Worth, TX | 3.0 | 1.5 | 1200 | $1,600 | $1.33 | 44d | 1 | 1.04mi |
| 3921 Avenue H Unit H Fort Worth, TX | 3.0 | 2.0 | 1064 | $1,550 | $1.46 | 7d | 1 | 1.07mi |
| 2909 Avenue K Fort Worth, TX | 3.0 | 2.0 | 1490 | $700 | $0.47 | 44d | 1 | 1.07mi |
| 3300 Avenue H Fort Worth, TX | 2.0 | 1.0 | 1050 | $1,150 | $1.10 | 44d | 1 | 1.07mi |
| 3302 Avenue H Unit 3300 Fort Worth, TX | 2.0 | 1.0 | 1050 | $1,150 | $1.10 | 44d | 1 | 1.08mi |
| 4336 Jana Dr Fort Worth, TX | 3.0 | 1.0 | 1070 | $1,650 | $1.54 | 5d | 1 | 1.09mi |
| 2509 Spiller St Fort Worth, TX | 2.0 | 2.0 | 720 | $1,300 | $1.81 | 15d | 1 | 1.09mi |
| 2509 Spiller St Fort Worth, TX | 2.0 | 1.0 | 720 | $1,400 | $1.94 | 44d | 1 | 1.09mi |
| 2839 Avenue J Unit J Fort Worth, TX | 3.0 | 1.5 | 1000 | $1,455 | $1.46 | 25d | 1 | 1.15mi |
| 2837 Avenue J Unit J Fort Worth, TX | 3.0 | 1.5 | 1000 | $1,455 | $1.46 | 25d | 1 | 1.15mi |
| 2640 Berryhill Dr Fort Worth, TX | 2.0 | 1.0 | 1478 | $1,299 | $0.88 | 25d | 1 | 1.16mi |
| 2645 Canberra Ct Fort Worth, TX | 2.0 | 1.0 | 750 | $1,150 | $1.53 | 44d | 1 | 1.18mi |
| 3100 Avenue G Unit G Fort Worth, TX | 2.0 | 1.0 | 1000 | $850 | $0.85 | 13d | 1 | 1.19mi |
| 3100 Avenue G Unit 200 Fort Worth, TX | 2.0 | 1.0 | 1000 | $750 | $0.75 | 13d | 1 | 1.20mi |
| 4217 Wilhelm St Fort Worth, TX | 3.0 | 2.0 | 1380 | $1,650 | $1.20 | 44d | 1 | 1.33mi |
| 3229 Denman St Fort Worth, TX | 3.0 | 1.0 | 1236 | $1,550 | $1.25 | 11d | 1 | 1.46mi |
| 912 Clairemont Ave Fort Worth, TX | 2.0 | 1.0 | 936 | $1,300 | $1.39 | 44d | 1 | 1.49mi |
| 5011 Sunshine Dr Fort Worth, TX | 2.0 | 1.0 | 813 | $1,515 | $1.86 | 25d | 1 | 1.49mi |
| 5055 Virgil St Fort Worth, TX | 3.0 | 2.0 | 1089 | $1,650 | $1.52 | 25d | 1 | 1.50mi |
Listing history 7 events
-
2026-06-21days on market $159,900 Active 9 DOM
-
2026-06-18days on market $159,900 Active 6 DOM
-
2026-06-17days on market $159,900 Active 5 DOM
-
2026-06-16days on market $159,900 Active 4 DOM
-
2026-06-15days on market $159,900 Active 3 DOM
-
2026-06-13remarks 693-char remark
-
2026-06-13$159,900 Active 1 DOM
ⓘ Source: listings_history table (triggers on properties + properties_extension) + one-shot
backfill from property_details.listing_events for pre-trigger history.
Tax reassessment forecast TX · Resets to sale price
- Current annual tax
- $3,492 · $291/mo
- Projected year-2 tax
- $3,492 · $291/mo
- Expected delta
- $0/yr ($0/mo · -0.0%)
ⓘ Screening estimate from a state-policy table — verify with the county assessor before closing.
Climate risk First Street
- Flood 1/10 Low FEMA zone X (unshaded) · 0% chance over 30 yrs
- Wildfire 1/10 Low
- Heat 7/10 Severe 7 d/yr ≥109°F today · 23 d/yr by 30 yrs out
- Wind 5/10 Major 26% chance of damaging wind over 30 yrs
- Air quality 3/10 Moderate 3 unhealthy d/yr today · 4 by 30 yrs out
Nearby sold comps map
Loading sold comps map…
Walkable amenities ~0.75 mi
Loading nearby amenities…
Taxation est. · year 1
- Rental income
- $19,098
- − Mortgage interest
- −$8,957
- − Property taxes
- −$3,492
- − Insurance
- −$800
- − Repairs & maintenance
- −$1,528
- − Management
- −$1,528
- − Depreciation
- −$4,652
- Taxable loss
- −$1,858
- Est. tax savings @ 24.0%
- +$446
- After-tax cash flow
- $1,179/yr
For passive investors: Depreciation is non-cash, so a rental often shows a tax loss while cash-flowing — sheltering income. Rental losses are passive: they offset passive income freely, and up to $25,000/yr can offset ordinary (W-2) income if you actively participate and your MAGI is under $100k (phasing out to $0 by $150k); unused losses carry forward. On sale, claimed depreciation is recaptured at up to 25%, and gains may owe capital-gains tax (a 1031 exchange can defer both). Figures are a year-1 estimate at your 24.0% rate — not tax advice; consult a CPA.
Schools (NCES district)
- District
- Fort Worth ISD
- NCES district ID
- 4819700
- Math proficiency
- 18% ▼ -16.00%
- Reading proficiency
- 28% ▼ -6.00%
- Median HH income
- $42,109
- Composite
- 19.61/100
- National rank
- #8753
- State rank
- #742 of 826 in TX
Livability — Fort Worth
- Score
- 80/100
- State rank
- #49
- US rank
- #1954
Category grades
Schools grade is shown separately in the Schools card above.
Census & demographics
- Census place
- Fort Worth, TX
- County
- Tarrant County · 2,033,669 people
- City population
- 911,619
- Metro
- Dallas-Fort Worth-Arlington, TX
- Population (ZIP)
- 22,228
- Household income
- $45,770
- Rent vs Own
- Severe rent burden
- 884.0
Population outlook (Tarrant County) Hauer SSP2
- Today (2025)
- 2,380,417 people
- By 2030
- 2,578,900 · +8.3%
- By 2040
- 2,974,995 · +25.0%
- By 2050
- 3,350,489 · +40.8%
- By 2075
- 4,216,909 · +77.2%
- By 2100
- 4,741,527 · +99.2%
Race, ethnicity, and origin ACS 2023
- Neighborhood character
- Majority Hispanic (63%)
- Race & ethnicity
- Hispanic / Latino 63% Black 29% Two or more races 24% White 6%
- Hispanic origin (detail)
- Mexican 57%
- Foreign-born
- 28% · Canada
- Languages at home
- 44% English-only · Spanish 55% Other Indo-European 1%
Political lean MEDSL · Tarrant
- 2024 margin
- Lean R (+5.1) · D 46.7% · R 51.9% · Other 1.4%
- 2008→2024 swing
- +6.6pp toward D · 2008: -11.7pp · 2024: -5.1pp
- All cycles
- 2024: R+5.1 2020: D+0.2 2016: R+8.7 2012: R+15.7 2008: R+11.7
Not yet ingested
- Civics
- —
Market trends
- HPI YoY
- ▲ 27.33%
- Current HPI
- 219.2657
- Rent YoY
- —
- Metro
- Dallas-Fort Worth-Arlington, TX
- State GDP YoY
- ▲ 3.95%
- F500 in state
- 110
Industry mix (Fortune 500 HQ in TX)
| Industry | F500 HQs | Revenue |
|---|---|---|
| Energy | 16 | $1,198B |
|
||
| Technology | 5 | $198B |
|
||
| Engineering / Construction | 4 | $72B |
|
||
| Energy Services | 3 | $60B |
|
||
| Utilities | 3 | $41B |
|
||
| Healthcare | 2 | $330B |
|
||
Price history
+611.2% since first listed6 events — show timeline
- 2026-06-12 Listed $159,900 NTREIS
- 2025-01-31 Rental Removed $1,650 ZUMPER1
- 2025-01-29 Listed for Rent $1,650 ZUMPER1
- 2020-08-16 Listing Removed — NTREIS
- 2020-08-12 Listed $164,990 NTREIS
- 2008-11-04 Sold (Public Records) $22,483 Public Records
Property tax history
+40.2%/yrLatest (2025): $3,492 · -20.0% YoY. Source: county tax records.
Cash-flow waterfall
monthlySold comps — $/sqft
last 12 mo · ≤1 miLoading sold comps…