410 Washington St · Bessemer, AL
Flood risk 1/10 · Minimal
- FEMA flood zone
- X (unshaded)
- Chance of flooding over 30 yrs
- 0.0%
- Est. flood insurance / yr
- $507 – $1,088
Fire risk 4/10 · Minor
- Est. fire insurance / yr
- $916 – $1,700
Heat risk 6/10 · Moderate
- Hot days now (above 108°F)
- 6 days/yr
- Hot days in 30 yrs
- 16 days/yr
Wind risk 6/10 · Moderate
- Chance of severe wind over 30 yrs
- 46.0%
Air-quality risk 3/10 · Minor
- Unhealthy air days now
- 2 days/yr
- Unhealthy air days in 30 yrs
- 5 days/yr
Risk factors via First Street. Map © Google.
Why this score? — see what drove the D grade
The composite is a weighted blend of 9 inputs, each scored 0–100. Each bar is that input's sub-score; the figure is the points it added to the 100-point composite (weight × sub-score).
- Cash flow +15.0/30.0
- ARV discount +7.5/15.0
- 1% rule +5.0/10.0
- DSCR +5.0/10.0
- Livability +3.0/5.0
- Condition / age +2.5/5.0
- Rent growth +1.7/5.0
- Schools +0.8/10.0
- Appreciation +0.0/10.0
$15,000
🖨 Deal sheet 📄 Offer letter ✓ Due diligence
Listing remarks MLS
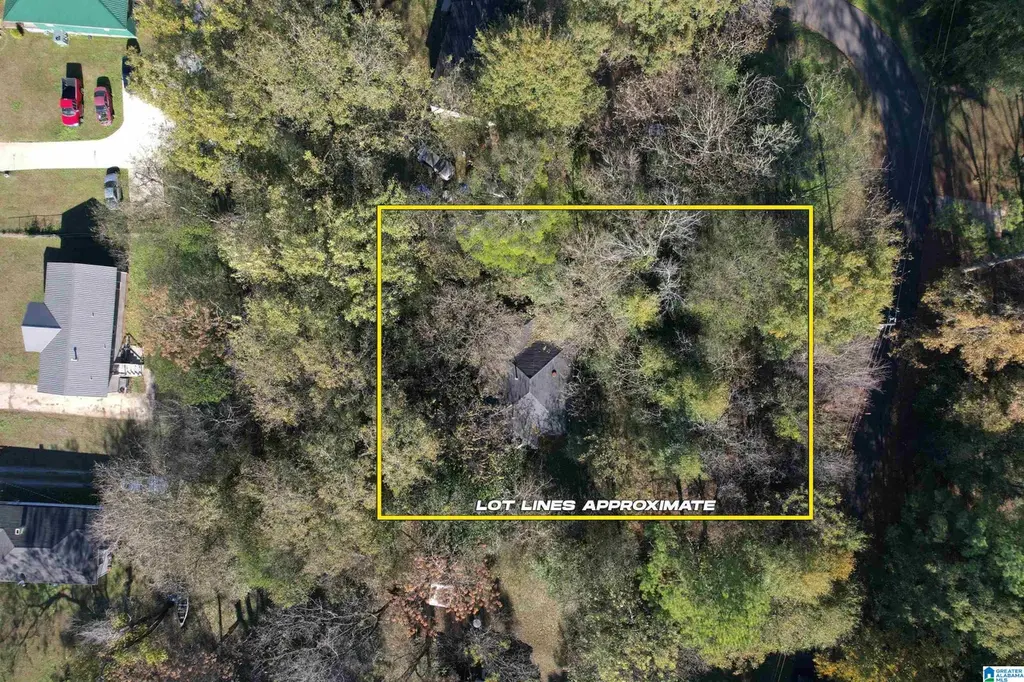
Half-acre lot with an existing home being sold as is. Ideal for investors, builders, or anyone seeking a spacious lot with potential. Convenient access to Hwy 150 and Morgan Road and nearby schools, parks, and shops. No repairs or improvements will be made by the seller.
Key facts
- Nearby shops
- Half-acre lot
- Convenient access
Tags
Neighborhood map
What this means for you Summary
Snapshot
- This is a 3-bed/1.0-bath single-family listed at $15k.
Deal economics
- At list price, monthly cash flow is $818 ($10k/yr) — positive.
- The deal already cash-flows at list — no discount required.
- Meets the 1% rule at list price ($1k rent vs $15k).
- Recommended offer: $14k (9.0% below list) — sets the bar for market timing.
- Cap rate 71.8% vs local median 5.9% in Bessemer — top-decile yield for the area; either an underpriced asset or a hidden risk that comps aren't pricing in. Stress-test before assuming the spread holds.
Location & tenants
- Location reads 59/100 on livability (#331 in AL) — a working-class tenant base; expect higher turnover. Strengths: commute A+, cost of living A+, housing A; Watch: schools D-, crime F, amenities F.
- Bessemer City (suburban): math 3% / reading 19% proficiency, ranked #120 of 129 in AL (top 93%) — low school quality limits family demand, transient renter base, plan for 1-2y turnover; 87% free/reduced lunch — lower-income household profile, screen leases tightly.
- Market conditions: Rents falling (-3.1%/yr); 115 active listings in the ZIP; 17 comparable units currently listed for rent nearby; rentals at typical pace (median 24d on market — plan ~3-4 weeks tenant-placement turnaround); lower-income renter base — watch delinquency; 2,114 units permitted in Jefferson County in 2024 (556 in 5+ unit buildings).
- This rent runs 40% of the median local income ($35k/yr) — at the standard rent-burdened threshold; future hikes will face affordability resistance.
Forward outlook
- Local home prices are declining (-3.0%/yr); year-one equity from $104 of loan paydown is wiped out by about $450 of value loss. Plan a longer hold.
- Jefferson County population projected to shrink 4% by 2050 — rents likely to lag national; underwrite the cash flow, not the appreciation.
- At projected returns (-3.0% appreciation + 0.0% rent growth), your $4k cash investment doubles in ~1 year — after that, you're playing with house money.
Negotiation context
- It's been on market 106 days — a 9% lower offer ($14k) is reasonable based on typical stale-listing flexibility.
- 2 sale attempts with the ask held roughly flat each time — persistent listings suggest the price (not the market) is what's stuck; bring a comps-based counter.
Risks & watch-outs
- Watch-outs: built in 1944 — expect roof / HVAC / electrical / plumbing capex.
- Climate carrying-cost: major wind risk, 46% chance of damaging wind over 30y; extreme-heat days projected 6→16/yr by 2055 (HVAC capex compounding) — expect insurance premiums to compound above CPI over the hold.
Questions for the listing agent
- It's been on market 106 days. Have you received any prior offers? Is the seller open to a 9% concession, seller financing, or rate buy-down credit?
- Built in 1944 — when were the roof, HVAC, electrical panel, plumbing, and water heater last replaced?
- Why hasn't it sold? Are there any deal-killer items the seller is aware of (foundation, flood, title, zoning, code violations)?
- Is there a deadline driving the sale (1031 exchange, divorce, estate, relocation)? That informs how much negotiation room exists.
- Schools are D-rated, which usually means shorter tenancies and higher turnover. Who's the typical renter profile here, and what's been the actual vacancy rate?
- Crime grade is F in this area — have there been break-ins, vandalism, or insurance claims at this property in the last 3 years? What carrier currently insures it and at what premium?
- The area grade is low — what's the realistic commute time and amenity access for the typical tenant pool here? Any planned neighborhood developments (good or bad) we should know about?
- What's the average days-on-market for RENTAL listings here right now (not sales)? A rising rental-DOM trend means longer vacancies and softer asking-rent achievability than the comps imply.
- What's the recent tenant-quality profile in this submarket — average credit score on applications, eviction rate, late-payment / NSF rate, and stable-employment percentage? A property-management company in the area should have these aggregated.
- How much new for-sale + rental construction is in the pipeline within 1–3 miles? Heavy new supply typically softens prices + rents 12–24 months out; constrained supply supports both.
Investment metrics
- 1% rule
- 7.78% ✓
- Cap rate
- 71.76%
- Cash-on-cash
- 233.79%
- DSCR
- 11.40
- GRM
- 1.1
CMA / ARV
- ARV (median comp)
- $81,854
- List price
- $15,000
- Delta
- -81.67%
- Verdict
- UNDERPRICED
- Comps
- 20 within 1.0 mi
Show comp detail 12 sales within ~0.75 mi
| Address | Dist | Beds/Ba | Sqft | Sold | Price | $/sf | Match |
|---|---|---|---|---|---|---|---|
| 412 Raimund Ave | 0.07mi | 2/1.0 (-1) | 1,212 (+1%) | 20mo | $47,800 | $39 | 74 |
| 8 Owen Ave | 0.44mi | 3/1.0 | 1,114 (-7%) | 2mo | $55,000 | $49 | 66 |
| 137 Elrie Blvd | 0.30mi | 2/2.0 (-1) | 1,288 (+7%) | 3mo | $129,000 | $100 | 63 |
| 424 Joseph St | 0.22mi | 3/2.0 | 1,072 (-11%) | 10mo | $155,000 | $145 | 60 |
| 63 Bluebell St | 0.61mi | 4/1.5 (+1) | 1,232 (+3%) | 3mo | $100,000 | $81 | 58 |
| 427 Gladys St | 0.73mi | 3/1.0 | 1,248 (+4%) | 3mo | $32,000 | $26 | 57 |
| 401 Brook Ave | 0.51mi | 3/1.0 | 1,320 (+10%) | 7mo | $122,500 | $93 | 54 |
| 100 Black Ave | 0.66mi | 3/2.0 | 1,232 (+3%) | 10mo | $146,000 | $119 | 52 |
| 990 Bluff St | 0.74mi | 3/2.0 | 1,256 (+5%) | 4mo | $115,000 | $92 | 50 |
| 419 Gladys St | 0.74mi | 3/2.0 | 1,272 (+6%) | 6mo | $169,000 | $133 | 46 |
| 207 Short Mcadory Ave | 0.57mi | 3/2.0 | 1,312 (+9%) | 15mo | $99,900 | $76 | 41 |
| 235 Kyser Ave | 0.59mi | 3/1.0 | 1,064 (-11%) | 16mo | $62,000 | $58 | 40 |
Match score weights: distance 35% · size 25% · config 20% · recency 20%. Top-matched comps best support the ARV.
Projected returns pro-forma
-3.0% appreciation · 0.0% rent growth · sell at horizon
- IRR
- —
- Equity multiple
- 12.02×
- Total profit
- $46,283
- Equity at exit
- $2,237
- IRR
- —
- Equity multiple
- 23.44×
- Total profit
- $94,265
- Equity at exit
- $1,297
Cash invested: $4,200 (down + closing). Projections, not guarantees.
Landlord ↔ Tenant lean methodology
- Overall (STATE)
- 90 Strongly Landlord-Friendly
- State Alabama
- 90 Strongly Landlord-Friendly · R+15
- County
- — inherits STATE
- City
- — inherits STATE
ZIP-level market 35020
- Home prices YoY
- -24.2%
- Rents YoY
- -3.1%
- Active inventory
- 115
- Price-to-rent
- 1.1×
Monthly cashflow live
- Estimated rent
- $1,167 high interval (Pro) →
- Mortgage (P&I)
- −$79
- Tax est. 1.5%
- −$19 /mo · $225/yr
- Insurance
- −$6
- HOA
- −$0
- Vacancy / Maint / Mgmt
- −$245
- Net cashflow
- $818
Break-even live
UW: 25.0% down · 7.5% · 30yr · 1.5% tax · 5.0% vac · 8.0% maint · 8.0% mgmt
Financing live
Cash to close
- Down payment
- $3,750
- Closing costs
- $450
- Reserves months
- —
- Total cash needed
- —
Loan-product check · same deal, 3 products live
Conventional
25% down · 7.5% · 30yr
- Down + closing
- —
- Monthly P&I
- —
- Monthly cashflow
- —
- DSCR
- —
- Eligible?
- —
Personal DTI + credit; lowest rate.
DSCR
20% down · 8.5% · 30yr
- Down + closing
- —
- Monthly P&I
- —
- Monthly cashflow
- —
- DSCR
- —
- Eligible?
- —
No personal income docs; deal must DSCR.
Hard money
10% down · 12.0% · 12mo
- Down + closing
- —
- Monthly P&I
- —
- Monthly cashflow
- —
- DSCR
- —
- Eligible?
- —
Short-term bridge; refi at stabilization.
Rent comps 17 comps
| Address | Beds | Baths | Sqft | Rent | $/sqft | DOM | Units | Dist |
|---|---|---|---|---|---|---|---|---|
| 236 Clifton St Bessemer, AL | 3.0 | 1.0 | 1450 | $1,100 | $0.76 | 43d | 1 | 0.50mi |
| 63 Bluebell St Bessemer, AL | 4.0 | 2.0 | 1232 | $1,399 | $1.14 | 15d | 1 | 0.58mi |
| 704 Avenue I Bessemer, AL | 3.0 | 1.0 | 1232 | $1,200 | $0.97 | 23d | 1 | 0.73mi |
| 300 Norwood Ave Bessemer, AL | 3.0 | 1.0 | 966 | $900 | $0.93 | 11d | 1 | 0.76mi |
| 300 Norwood Ave Bessemer, AL | 3.0 | 1.0 | 966 | $1,000 | $1.04 | 23d | 1 | 0.76mi |
| 18 Center St Bessemer, AL | 3.0 | 1.0 | 1418 | $1,100 | $0.78 | 43d | 1 | 0.83mi |
| 10 Center St Bessemer, AL | 3.0 | 1.0 | 1152 | $1,000 | $0.87 | 43d | 1 | 0.85mi |
| 808 Fairfax Ave Bessemer, AL | 3.0 | 1.0 | 1042 | $1,050 | $1.01 | 23d | 1 | 0.91mi |
| 810 Fairfax Ave Bessemer, AL | 3.0 | 1.0 | 1042 | $1,050 | $1.01 | 23d | 1 | 0.92mi |
| 622 Jefferson Ave Bessemer, AL | 2.0 | 1.0 | 800 | $850 | $1.06 | 21d | 1 | 0.93mi |
| 622 Jefferson Ave Unit 622 Bessemer, AL | 2.0 | 1.0 | 800 | $850 | $1.06 | 3d | 1 | 0.93mi |
| 3626 Wind Ridge Ln Bessemer, AL | 3.0 | 2.0 | 1305 | $1,850 | $1.42 | 2d | 1 | 1.03mi |
| 931 Dartmouth Ave Bessemer, AL | 3.0 | 1.0 | 984 | $925 | $0.94 | 43d | 1 | 1.10mi |
| 4015 Goodwin Rd Bessemer, AL | 3.0 | 2.0 | 1200 | $1,211 | $1.01 | 15d | 1 | 1.15mi |
| 208 9th Ct S Bessemer, AL | 2.0 | 1.0 | 784 | $650 | $0.83 | 23d | 1 | 1.21mi |
| 806 4th Ave N Bessemer, AL | 3.0 | 1.0 | 1092 | $1,050 | $0.96 | 23d | 1 | 1.44mi |
| 410 W Lake Dr Bessemer, AL | 2.0 | 1.0 | 780 | $875 | $1.12 | 10d | 1 | 1.45mi |
Listing history 15 events
-
2026-06-16statusdays on market $15,000 Pending 106 DOM
-
2026-06-15days on market $15,000 Active 105 DOM
-
2026-06-13days on market $15,000 Active 103 DOM
-
2026-06-10days on market $15,000 Active 100 DOM
-
2026-06-09days on market $15,000 Active 99 DOM
-
2026-06-08days on market $15,000 Active 98 DOM
-
2026-06-07days on market $15,000 Active 97 DOM
-
2026-06-05days on market $15,000 Active 94 DOM
-
2026-06-03days on market $15,000 Active 93 DOM
-
2026-06-02days on market $15,000 Active 92 DOM
-
2026-06-01days on market $15,000 Active 91 DOM
-
2026-05-31days on market $15,000 Active 90 DOM
-
2026-05-05status Active 271-char remark
Show marketing remark (271 chars)
Half-acre lot with an existing home being sold as is. Ideal for investors, builders, or anyone seeking a spacious lot with potential. Convenient access to Hwy 150 and Morgan Road and nearby schools, parks, and shops. No repairs or improvements will be made by the seller.
-
2026-01-15status Pending 271-char remark
Show marketing remark (271 chars)
Half-acre lot with an existing home being sold as is. Ideal for investors, builders, or anyone seeking a spacious lot with potential. Convenient access to Hwy 150 and Morgan Road and nearby schools, parks, and shops. No repairs or improvements will be made by the seller.
-
2025-11-12$15,000 Active 271-char remark
Show marketing remark (271 chars)
Half-acre lot with an existing home being sold as is. Ideal for investors, builders, or anyone seeking a spacious lot with potential. Convenient access to Hwy 150 and Morgan Road and nearby schools, parks, and shops. No repairs or improvements will be made by the seller.
ⓘ Source: listings_history table (triggers on properties + properties_extension) + one-shot
backfill from property_details.listing_events for pre-trigger history.
Climate risk First Street
- Flood 1/10 Low FEMA zone X (unshaded) · 0% chance over 30 yrs
- Wildfire 4/10 Moderate
- Heat 6/10 Major 6 d/yr ≥108°F today · 16 d/yr by 30 yrs out
- Wind 6/10 Major 46% chance of damaging wind over 30 yrs
- Air quality 3/10 Moderate 2 unhealthy d/yr today · 5 by 30 yrs out
Nearby sold comps map
Loading sold comps map…
Walkable amenities ~0.75 mi
Loading nearby amenities…
Taxation est. · year 1
- Rental income
- $14,004
- − Mortgage interest
- −$840
- − Property taxes
- −$225
- − Insurance
- −$75
- − Repairs & maintenance
- −$1,120
- − Management
- −$1,120
- − Depreciation
- −$436
- Taxable income
- $10,187
- Est. tax owed @ 24.0%
- −$2,445
- After-tax cash flow
- $7,374/yr
For passive investors: Depreciation is non-cash, so a rental often shows a tax loss while cash-flowing — sheltering income. Rental losses are passive: they offset passive income freely, and up to $25,000/yr can offset ordinary (W-2) income if you actively participate and your MAGI is under $100k (phasing out to $0 by $150k); unused losses carry forward. On sale, claimed depreciation is recaptured at up to 25%, and gains may owe capital-gains tax (a 1031 exchange can defer both). Figures are a year-1 estimate at your 24.0% rate — not tax advice; consult a CPA.
Schools (NCES district)
- District
- Bessemer City
- NCES district ID
- 0100330
- Math proficiency
- 3% ▼ -18.00%
- Reading proficiency
- 19% ▼ -3.00%
- Median HH income
- $29,721
- Composite
- 8.45/100
- National rank
- #9905
- State rank
- #120 of 129 in AL
Livability — Bessemer
- Score
- 59/100
- State rank
- #331
- US rank
- #20078
Category grades
Schools grade is shown separately in the Schools card above.
Census & demographics
- Census place
- Bessemer, AL
- County
- Jefferson County · 527,445 people
- City population
- 48,018
- Metro
- Birmingham-Hoover, AL
- Population (ZIP)
- 24,892
- Household income
- $35,362
- Rent vs Own
- Severe rent burden
- 1001.0
Population outlook (Jefferson County) Hauer SSP2
- Today (2025)
- 669,185 people
- By 2030
- 669,694 · +0.1%
- By 2040
- 661,388 · -1.2%
- By 2050
- 643,086 · -3.9%
- By 2075
- 577,267 · -13.7%
- By 2100
- 474,758 · -29.1%
Race, ethnicity, and origin ACS 2023
- Neighborhood character
- Predominantly Black (74%)
- Race & ethnicity
- Black 74% Hispanic / Latino 13% White 11% Two or more races 6%
- Hispanic origin (detail)
- Mexican 10%
- Foreign-born
- 5% · Canada
- Languages at home
- 89% English-only · Spanish 11%
Political lean MEDSL · Jefferson
- 2024 margin
- D (+10.4) · D 54.6% · R 44.2% · Other 1.2%
- 2008→2024 swing
- +5.4pp toward D · 2008: 5.1pp · 2024: 10.4pp
- All cycles
- 2024: D+10.4 2020: D+13.2 2016: D+7.2 2012: D+6.0 2008: D+5.1
Not yet ingested
- Civics
- —
Market trends
- HPI YoY
- ▼ -57.54%
- Current HPI
- 179.7702
- Rent YoY
- ▼ -3.12%
- Metro
- Birmingham-Hoover, AL
- State GDP YoY
- ▲ 2.94%
- F500 in state
- 4
Industry mix (Fortune 500 HQ in AL)
| Industry | F500 HQs | Revenue |
|---|---|---|
| Financial Services | 1 | $8B |
|
||
| Healthcare | 1 | $5B |
|
||
Price history
3 events — show timeline
- 2026-05-05 Relisted — Greater Alabama MLS
- 2026-01-15 Pending — Greater Alabama MLS
- 2025-11-12 Listed $15,000 Greater Alabama MLS
Property tax history
+1.3%/yrLatest (2025): $896 · +0.0% YoY. Source: county tax records.
Cash-flow waterfall
monthlySold comps — $/sqft
last 12 mo · ≤1 miLoading sold comps…