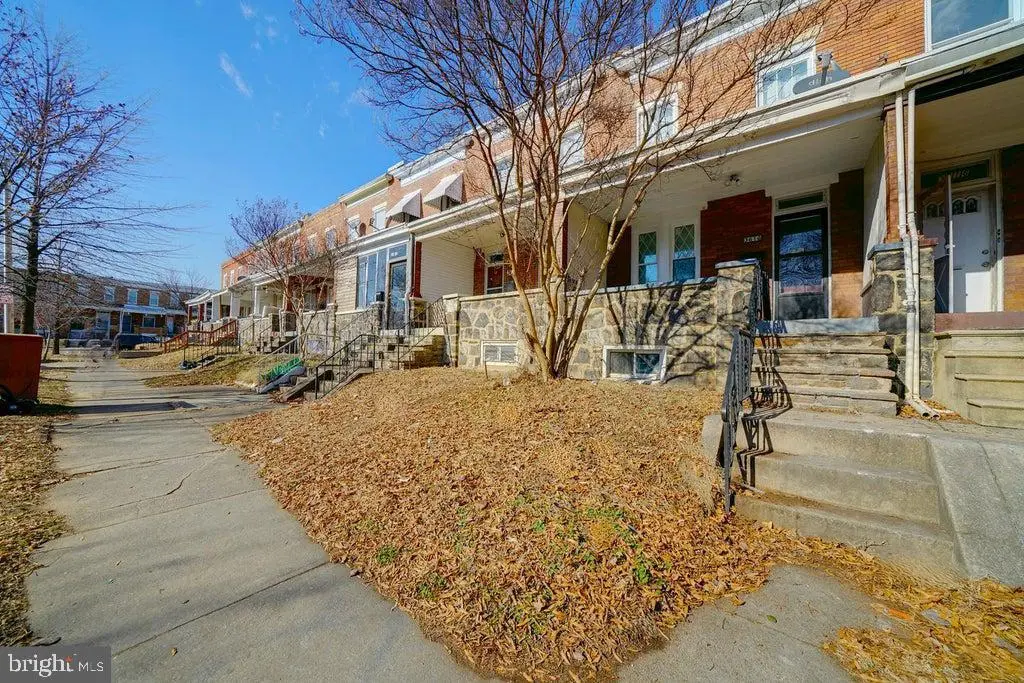
3616 Roberts Pl · Baltimore, MD
Flood risk 8/10 · Major
- FEMA flood zone
- X (unshaded)
- Chance of flooding over 30 yrs
- 0.99%
- Est. flood insurance / yr
- $473 – $860
Fire risk 1/10 · Minimal
- Est. fire insurance / yr
- $755 – $1,403
Heat risk 8/10 · Major
- Hot days now (above 103°F)
- 7 days/yr
- Hot days in 30 yrs
- 15 days/yr
Wind risk 6/10 · Moderate
- Chance of severe wind over 30 yrs
- 27.0%
Air-quality risk 4/10 · Minor
- Unhealthy air days now
- 6 days/yr
- Unhealthy air days in 30 yrs
- 7 days/yr
Risk factors via First Street. Map © Google.
Why this score? — see what drove the C+ grade
The composite is a weighted blend of 9 inputs, each scored 0–100. Each bar is that input's sub-score; the figure is the points it added to the 100-point composite (weight × sub-score).
- Cash flow +28.3/30.0
- DSCR +10.0/10.0
- 1% rule +7.8/10.0
- ARV discount +7.5/15.0
- Livability +3.8/5.0
- Rent growth +2.8/5.0
- Condition / age +2.5/5.0
- Schools +1.0/10.0
- Appreciation +0.0/10.0
$165,000
🖨 Deal sheet 📄 Offer letter ✓ Due diligence
Listing remarks
All brick Federal style, new renovated rowhome in Highlandtown boasts parking in the rear and an iconic covered front porch. Step inside to find a living room with hardwoods, crown moldings, double windows, and a dining room opening to the kitchen. The kitchen raised panel wood cabinetry, ample counter space, and a back door stepping to an elevated porch overlooking a patio and rear parking pad. Lower level offers a partially finished rec area, a full bath, a laundry area, and extra storage. Fresh Painted the whole house, Added additional room the ins basement, Newer Washer and dryer, Newer kitchen floor, Newer Windows. Enjoy city living in a community convenient to Pulaski Highway, downtow
Key facts
- Covered front porch
- Laundry area
- Extra storage
Tags
Property features AI
Finance
- Other: Not in a federal flood zone; Vacation rental eligible
Exterior
- Parking: Concrete driveway; Off-street parking and on-street parking available
- Utilities: Public water; Public sewer; Natural gas hot water; Natural gas heating; Electric cooling
- Home design: Interior townhouse/rowhouse; Flat roof; Facing within city limits (urban Baltimore); Fee simple ownership; Major remodel/renovation effective 2025
- Construction: Brick construction; Brick/mortar foundation; Sliding and vinyl-clad windows; Above-grade and below-grade structural elements; Basement present (other type)
- Exterior features: Porch(es); Exterior lighting; Satellite dish; Sidewalks; Chain link rear fencing; Front yard; No thru street
Interior
- Kitchen: Gas oven/range; Built-in microwave; Stainless steel appliances; Refrigerator; Exhaust fan
- Bedrooms: Three bedrooms on the upper level (Master plus two additional bedrooms)
- Flooring: Laminate plank flooring; Ceramic tile
- Bathrooms: Two full bathrooms (one on upper level, one on lower level)
- Heating & cooling: Radiator heating (natural gas); Electric cooling
- Interior features: Open floor plan with formal separate dining room and dining area; Eat-in kitchen with upgraded countertops and table space; Built-ins and window treatments; Walk-in shower in bathroom; 9'+ ceilings and drywall; Six-panel and storm doors
- Laundry & utility: Washer and dryer (front-loading) in-unit; laundry located on lower level/basement
Neighborhood map
What this means for you Summary
Snapshot
- This is a 3-bed/1.0-bath townhouse listed at $165k.
Deal economics
- At list price, monthly cash flow is $475 ($6k/yr) — positive.
- The deal already cash-flows at list — no discount required.
- Meets the 1% rule at list price ($2k rent vs $165k).
- Recommended offer: $163k (1.5% below list) — sets the bar for market timing.
- Cap rate 10.1% vs local median 6.0% in Baltimore — top-decile yield for the area; either an underpriced asset or a hidden risk that comps aren't pricing in. Stress-test before assuming the spread holds.
Location & tenants
- Location reads 76/100 on livability (#90 in MD, #3,396 nationally) — a middle-class / working-renter tenant base. Strengths: amenities A+, commute A+, housing A+; Watch: schools D, crime F.
- Baltimore City Public Schools (urban): math 7% / reading 16% proficiency, ranked #24 of 24 in MD (top 100%) — low school quality limits family demand, transient renter base, plan for 1-2y turnover; 79% free/reduced lunch — lower-income household profile, screen leases tightly.
- Market conditions: Rents rising (+1.3%/yr); 391 active listings in the ZIP; 40 comparable units currently listed for rent nearby; rentals at typical pace (median 24d on market — plan ~3-4 weeks tenant-placement turnaround); solid renter incomes; 1,273 units permitted in Baltimore city in 2024 (1,104 in 5+ unit buildings).
Forward outlook
- Local home prices are declining (-3.0%/yr); year-one equity from $1k of loan paydown is wiped out by about $5k of value loss. Plan a longer hold.
- Baltimore County population projected to shrink 4% by 2050 — rents likely to lag national; underwrite the cash flow, not the appreciation.
Negotiation context
- It's been on market 30 days — a 2% lower offer ($163k) is reasonable based on typical stale-listing flexibility.
- 8 sale attempts since 3y ago; this cycle's ask has dropped $15k (8%) from the opening price — seller is motivated, your offer sets the floor, not the list.
- Current owner paid $96k; list at $165k implies a 72% gain — meaningful room to come down on a strong offer.
Risks & watch-outs
- Watch-outs: flood insurance adds $56/mo; built in 1925 — expect roof / HVAC / electrical / plumbing capex.
- Climate carrying-cost: severe flood risk; major wind risk, 27% chance of damaging wind over 30y; extreme-heat days projected 7→15/yr by 2055 (HVAC capex compounding) — expect insurance premiums to compound above CPI over the hold.
Questions for the listing agent
- Built in 1925 — when were the roof, HVAC, electrical panel, plumbing, and water heater last replaced?
- What's the actual annual flood-insurance premium (NFIP or private), and is the property in a SFHA with mandatory coverage?
- Is there a deadline driving the sale (1031 exchange, divorce, estate, relocation)? That informs how much negotiation room exists.
- Schools are D-rated, which usually means shorter tenancies and higher turnover. Who's the typical renter profile here, and what's been the actual vacancy rate?
- Crime grade is F in this area — have there been break-ins, vandalism, or insurance claims at this property in the last 3 years? What carrier currently insures it and at what premium?
- What's the average days-on-market for RENTAL listings here right now (not sales)? A rising rental-DOM trend means longer vacancies and softer asking-rent achievability than the comps imply.
- What's the recent tenant-quality profile in this submarket — average credit score on applications, eviction rate, late-payment / NSF rate, and stable-employment percentage? A property-management company in the area should have these aggregated.
- How much new for-sale + rental construction is in the pipeline within 1–3 miles? Heavy new supply typically softens prices + rents 12–24 months out; constrained supply supports both.
Investment metrics
- 1% rule
- 1.28% ✓
- Cap rate
- 10.15%
- Cash-on-cash
- 13.77%
- DSCR
- 1.61
- GRM
- 6.5
CMA / ARV
- ARV (median comp)
- $99,924
- List price
- $165,000
- Delta
- 65.13%
- Verdict
- OVERPRICED
- Comps
- 20 within 1.0 mi
Show comp detail 12 sales within ~0.75 mi
| Address | Dist | Beds/Ba | Sqft | Sold | Price | $/sf | Match |
|---|---|---|---|---|---|---|---|
| 111 N Highland Ave | 0.17mi | 3/1.5 | 1,170 (+6%) | 1mo | $105,000 | $90 | 79 |
| 149 N Highland Ave | 0.14mi | 2/1.0 (-1) | 1,170 (+6%) | 1mo | $75,000 | $64 | 78 |
| 14 S Curley St | 0.53mi | 2/1.0 (-1) | 1,092 (-1%) | 1mo | $269,000 | $246 | 68 |
| 122 Ellwood Ave | 0.37mi | 3/1.5 | 1,200 (+9%) | 0mo | $235,000 | $196 | 66 |
| 629 N Kenwood Ave | 0.60mi | 2/1.5 (-1) | 1,100 (-0%) | 1mo | $76,500 | $70 | 64 |
| 3135 Mcelderry St | 0.31mi | 3/2.0 | 1,224 (+11%) | 1mo | $234,000 | $191 | 62 |
| 2703 Jefferson St | 0.62mi | 3/1.0 | 1,170 (+6%) | 2mo | $102,500 | $88 | 60 |
| 134 N Curley St | 0.48mi | 2/2.0 (-1) | 1,170 (+6%) | 1mo | $270,000 | $231 | 58 |
| 309 S Fagley St | 0.53mi | 2/2.0 (-1) | 1,030 (-7%) | 1mo | $225,000 | $218 | 55 |
| 2712 Ashland Ave | 0.74mi | 3/1.5 | 1,164 (+5%) | 1mo | $175,000 | $150 | 53 |
| 735 N Lakewood Ave | 0.70mi | 3/1.5 | 970 (-12%) | 2mo | $80,000 | $82 | 44 |
| 520 S Bouldin St | 0.73mi | 2/1.5 (-1) | 1,212 (+10%) | 1mo | $345,000 | $285 | 42 |
Match score weights: distance 35% · size 25% · config 20% · recency 20%. Top-matched comps best support the ARV.
Projected returns pro-forma
-3.0% appreciation · 1.31% rent growth · sell at horizon
- IRR
- 0.0%
- Equity multiple
- 1.00×
- Total profit
- $15
- Equity at exit
- $24,602
- IRR
- 7.8%
- Equity multiple
- 1.54×
- Total profit
- $25,174
- Equity at exit
- $14,266
Cash invested: $46,200 (down + closing). Projections, not guarantees.
Landlord ↔ Tenant lean methodology
- Overall (CITY)
- 12 Strongly Tenant-Friendly
- State Maryland
- 27 Tenant-Leaning · D+14
- County
- — inherits STATE
- City Baltimore
- 12 Strongly Tenant-Friendly · D+58
ZIP-level market 21224
- Rents YoY
- 1.3%
- Active inventory
- 391
- Price-to-rent
- 6.5×
Monthly cashflow live
- Estimated rent
- $2,114 high interval (Pro) →
- Mortgage (P&I)
- −$865
- Tax from tax record
- −$206 /mo · $2,471/yr
- Insurance
- −$69
- Flood insurance flood zone
- −$56 /mo · $666/yr
- HOA
- −$0
- Vacancy / Maint / Mgmt
- −$444
- Net cashflow
- $475
Break-even live
UW: 25.0% down · 7.5% · 30yr · 1.5% tax · 5.0% vac · 8.0% maint · 8.0% mgmt
Financing live
Cash to close
- Down payment
- $41,250
- Closing costs
- $4,950
- Reserves months
- —
- Total cash needed
- —
Loan-product check · same deal, 3 products live
Conventional
25% down · 7.5% · 30yr
- Down + closing
- —
- Monthly P&I
- —
- Monthly cashflow
- —
- DSCR
- —
- Eligible?
- —
Personal DTI + credit; lowest rate.
DSCR
20% down · 8.5% · 30yr
- Down + closing
- —
- Monthly P&I
- —
- Monthly cashflow
- —
- DSCR
- —
- Eligible?
- —
No personal income docs; deal must DSCR.
Hard money
10% down · 12.0% · 12mo
- Down + closing
- —
- Monthly P&I
- —
- Monthly cashflow
- —
- DSCR
- —
- Eligible?
- —
Short-term bridge; refi at stabilization.
Rent comps 40 comps
| Address | Beds | Baths | Sqft | Rent | $/sqft | DOM | Units | Dist |
|---|---|---|---|---|---|---|---|---|
| 3430 E Baltimore St Baltimore, MD | 3.0 | 2.5 | 1316 | $2,250 | $1.71 | 24d | 1 | 0.24mi |
| 113 N Clinton St Baltimore, MD | 2.0 | 1.0 | 1300 | $1,995 | $1.53 | 44d | 1 | 0.26mi |
| 3304 McElderry St Baltimore, MD | 3.0 | 2.0 | 1413 | $1,900 | $1.34 | 44d | 1 | 0.28mi |
| 3436 Leverton Ave Baltimore, MD | 3.0 | 3.5 | 1500 | $2,350 | $1.57 | 24d | 1 | 0.28mi |
| 1 N Clinton St Baltimore, MD | 4.0 | 1.5 | 1200 | $1,700 | $1.42 | 20d | 1 | 0.30mi |
| 3205 Esther Pl Baltimore, MD | 2.0 | 2.0 | 960 | $1,850 | $1.93 | 24d | 1 | 0.30mi |
| 3413 Leverton Ave Baltimore, MD | 2.0 | 1.0 | 832 | $1,000 | $1.20 | 24d | 1 | 0.31mi |
| 404 N Robinson St Baltimore, MD | 3.0 | 3.0 | 1320 | $2,200 | $1.67 | 24d | 1 | 0.33mi |
| 404 N Robinson St Baltimore, MD | 3.0 | 3.0 | 1320 | $2,100 | $1.59 | 16d | 1 | 0.33mi |
| 17 N East Ave Baltimore, MD | 2.0 | 2.0 | 1326 | $2,550 | $1.92 | 24d | 1 | 0.34mi |
| 203 N Ellwood Ave Unit Main Baltimore, MD | 2.0 | 2.0 | 880 | $2,200 | $2.50 | 24d | 1 | 0.35mi |
| 115 S Eaton St Baltimore, MD | 3.0 | 2.5 | 1393 | $1,800 | $1.29 | 16d | 1 | 0.35mi |
| 3710 E Pratt St Baltimore, MD | 2.0 | 3.5 | 1230 | $1,900 | $1.54 | 24d | 1 | 0.38mi |
| 29 N Ellwood Ave Baltimore, MD | 3.0 | 1.5 | 1100 | $2,395 | $2.18 | 24d | 1 | 0.38mi |
| 106 S Bouldin St Baltimore, MD | 2.0 | 3.0 | 1134 | $2,100 | $1.85 | 20d | 1 | 0.41mi |
| 520 N Decker Ave Baltimore, MD | 2.0 | 1.0 | 1000 | $1,650 | $1.65 | 44d | 1 | 0.42mi |
| 223 Grundy St Baltimore, MD | 2.0 | 1.0 | 864 | $1,450 | $1.68 | 24d | 1 | 0.46mi |
| 127 S Robinson St Baltimore, MD | 2.0 | 1.5 | 1400 | $2,000 | $1.43 | 44d | 1 | 0.47mi |
| 235 S Highland Ave Baltimore, MD | 2.0 | 1.5 | 1222 | $2,000 | $1.64 | 24d | 1 | 0.48mi |
| 150 N Curley St Baltimore, MD | 2.0 | 2.5 | 1266 | $1,850 | $1.46 | 18d | 1 | 0.48mi |
| 2934 E Monument St Baltimore, MD | 2.0 | 1.0 | 1200 | $1,499 | $1.25 | 44d | 1 | 0.51mi |
| 2815 Orleans St Baltimore, MD | 2.0 | 1.0 | 1204 | $1,600 | $1.33 | 2d | 1 | 0.53mi |
| 34 N Linwood Ave Baltimore, MD | 2.0 | 1.5 | 1288 | $2,400 | $1.86 | 24d | 1 | 0.54mi |
| 321 Fagley St Baltimore, MD | 2.0 | 1.0 | 800 | $1,650 | $2.06 | 20d | 1 | 0.55mi |
| 718 N Curley St Baltimore, MD | 3.0 | 3.0 | 1500 | $2,000 | $1.33 | 4d | 1 | 0.55mi |
| 2800 Orleans St Baltimore, MD | 3.0 | 1.0 | 1404 | $1,600 | $1.14 | 18d | 1 | 0.56mi |
| 2800 Orleans St Baltimore, MD | 3.0 | 1.0 | 1404 | $1,600 | $1.14 | 15d | 1 | 0.56mi |
| 724 N Curley St Baltimore, MD | 3.0 | 3.0 | 1500 | $2,200 | $1.47 | 4d | 1 | 0.56mi |
| 102 S Curley St Baltimore, MD | 2.0 | 1.5 | 1200 | $1,800 | $1.50 | 4d | 1 | 0.58mi |
| 10 N Streeper St Baltimore, MD | 3.0 | 2.5 | 1440 | $2,500 | $1.74 | 24d | 1 | 0.59mi |
| 400 S Highland Ave Unit 402 Baltimore, MD | 2.0 | 1.0 | 900 | $1,700 | $1.89 | 44d | 1 | 0.61mi |
| 415 N Belnord Ave Baltimore, MD | 2.0 | 1.0 | 1008 | $1,300 | $1.29 | 24d | 1 | 0.61mi |
| 3905 Bank St Baltimore, MD | 4.0 | 1.0–3.0 | 909 | $2,820 | $3.10 | 2d | 20 | 0.62mi |
| 133 S Macon St Baltimore, MD | 2.0 | 2.5 | 1440 | $2,400 | $1.67 | 18d | 1 | 0.63mi |
| 531 N Belnord Ave Baltimore, MD | 2.0 | 1.5 | 1100 | $1,700 | $1.55 | 24d | 1 | 0.63mi |
| 2815 E Madison St Baltimore, MD | 4.0 | 2.0 | 1300 | $2,500 | $1.92 | 44d | 1 | 0.63mi |
| 139 N Lakewood Ave Unit 1 Baltimore, MD | 4.0 | 2.0 | 1370 | $2,500 | $1.82 | 44d | 1 | 0.65mi |
| 139 N Lakewood Ave Baltimore, MD | 4.0 | 2.5 | 1370 | $2,500 | $1.82 | 44d | 1 | 0.65mi |
| 627 N Lakewood Ave Baltimore, MD | 3.0 | 2.5 | 1175 | $1,900 | $1.62 | 22d | 1 | 0.68mi |
| 4015 Eastern Ave Unit 2L Baltimore, MD | 3.0 | 2.0 | 1100 | $1,800 | $1.64 | 44d | 1 | 0.69mi |
Listing history 26 events
-
2026-05-11price $165,000 860-char remark
-
2026-04-26$180,000 Active 860-char remark
-
2026-04-24historical
-
2026-04-19historical
-
2025-03-02historical
-
2025-02-24historical Active Under Contract
-
2025-01-28$180,000 Active
-
2024-11-21historical
-
2024-11-06$136,000 Active
-
2024-11-05historical
-
2023-10-18historical
-
2023-09-05status Active
-
2023-09-01historical
-
2023-08-30$133,000 Active
-
2023-07-29historical $1,600
-
2023-07-29status Pending
-
2023-07-29historical
-
2023-07-26$1,600
-
2023-07-25$133,000 Active
-
2023-06-06historical
-
2023-06-06soldstatus $96,000
-
2023-05-01historical Active Under Contract
-
2023-04-16price $133,000
-
2023-04-02$138,000 Active
-
2019-05-06soldstatus $36,000
-
1986-08-20soldstatus $35,000
ⓘ Source: listings_history table (triggers on properties + properties_extension) + one-shot
backfill from property_details.listing_events for pre-trigger history.
Tax reassessment forecast MD · Partial reset (capped growth)
- Current annual tax
- $2,471 · $206/mo
- Projected year-2 tax
- $2,471 · $206/mo
- Expected delta
- $0/yr ($0/mo · 0.0%)
ⓘ Screening estimate from a state-policy table — verify with the county assessor before closing.
Climate risk First Street
- Flood 8/10 Severe FEMA zone X (unshaded) · 99% chance over 30 yrs
- Wildfire 1/10 Low
- Heat 8/10 Severe 7 d/yr ≥103°F today · 15 d/yr by 30 yrs out
- Wind 6/10 Major 27% chance of damaging wind over 30 yrs
- Air quality 4/10 Moderate 6 unhealthy d/yr today · 7 by 30 yrs out
Nearby sold comps map
Loading sold comps map…
Walkable amenities ~0.75 mi
Loading nearby amenities…
Taxation est. · year 1
- Rental income
- $25,367
- − Mortgage interest
- −$9,243
- − Property taxes
- −$2,471
- − Insurance
- −$1,492
- − Repairs & maintenance
- −$2,029
- − Management
- −$2,029
- − Depreciation
- −$4,800
- Taxable income
- $3,303
- Est. tax owed @ 24.0%
- −$793
- After-tax cash flow
- $4,901/yr
For passive investors: Depreciation is non-cash, so a rental often shows a tax loss while cash-flowing — sheltering income. Rental losses are passive: they offset passive income freely, and up to $25,000/yr can offset ordinary (W-2) income if you actively participate and your MAGI is under $100k (phasing out to $0 by $150k); unused losses carry forward. On sale, claimed depreciation is recaptured at up to 25%, and gains may owe capital-gains tax (a 1031 exchange can defer both). Figures are a year-1 estimate at your 24.0% rate — not tax advice; consult a CPA.
Schools (NCES district)
- District
- Baltimore City Public Schools
- NCES district ID
- 2400090
- Math proficiency
- 7% ▼ -9.00%
- Reading proficiency
- 16% ▼ -5.00%
- Median HH income
- $42,108
- Composite
- 10.08/100
- National rank
- #9805
- State rank
- #24 of 24 in MD
Livability — Baltimore
- Score
- 76/100
- State rank
- #90
- US rank
- #3396
Category grades
Schools grade is shown separately in the Schools card above.
Census & demographics
- Census place
- Baltimore, MD
- County
- Baltimore City · 558,601 people
- City population
- 588,727
- Metro
- Baltimore-Columbia-Towson, MD
- Population (ZIP)
- 47,465
- Household income
- $89,017
- Rent vs Own
- Severe rent burden
- 1786.0
Population outlook (Baltimore County) Hauer SSP2
- Today (2025)
- 624,249 people
- By 2030
- 621,541 · -0.4%
- By 2040
- 609,756 · -2.3%
- By 2050
- 597,249 · -4.3%
- By 2075
- 552,236 · -11.5%
- By 2100
- 513,934 · -17.7%
Race, ethnicity, and origin ACS 2023
- Neighborhood character
- Diverse neighborhood (Simpson 0.62)
- Race & ethnicity
- White 55% Hispanic / Latino 21% Black 16% Two or more races 7% Asian 4%
- Hispanic origin (detail)
- Mexican 4% Puerto Rican 2% Dominican 1%
- Common ancestry
- Romanian 5% Lithuanian 2% Italian 1%
- Foreign-born
- 17% · Canada, China, Vietnam
- Languages at home
- 76% English-only · Spanish 18% Other Indo-European 2% Russian/Polish/Slavic 1%
Political lean MEDSL · Baltimore
- 2024 margin
- Solid D (+73.0) · D 85.2% · R 12.2% · Other 2.6%
- 2008→2024 swing
- -2.5pp toward R · 2008: 75.5pp · 2024: 73.0pp
- All cycles
- 2024: D+73.0 2020: D+76.6 2016: D+74.6 2012: D+76.4 2008: D+75.5
Not yet ingested
- Civics
- —
Market trends
- HPI YoY
- ▼ -332.23%
- Current HPI
- 241.284
- Rent YoY
- ▲ 1.31%
- Metro
- Baltimore-Columbia-Towson, MD
- State GDP YoY
- ▲ 2.97%
- F500 in state
- 12
Industry mix (Fortune 500 HQ in MD)
| Industry | F500 HQs | Revenue |
|---|---|---|
| Aerospace / Defense | 1 | $71B |
|
||
| Utilities | 1 | $25B |
|
||
| Hotels | 1 | $24B |
|
||
| Consumer Goods | 1 | $7B |
|
||
| Real Estate | 1 | $6B |
|
||
| Chemicals | 1 | $2B |
|
||
Price history
+371.4% since first listed27 events — show timeline
- 2026-05-28 Listing Removed — BRIGHT MLS
- 2026-05-11 Price Changed $165,000 BRIGHT MLS
- 2026-04-26 Listed $180,000 BRIGHT MLS
- 2026-04-24 Listing Removed — BRIGHT MLS
- 2026-04-19 Coming Soon — BRIGHT MLS
- 2025-03-02 Listing Removed — BRIGHT MLS
- 2025-02-24 Contingent — BRIGHT MLS
- 2025-01-28 Listed $180,000 BRIGHT MLS
- 2024-11-21 Listing Removed — BRIGHT MLS
- 2024-11-06 Listed $136,000 BRIGHT MLS
- 2024-11-05 Coming Soon — BRIGHT MLS
- 2023-10-18 Listing Removed — BRIGHT MLS
- 2023-09-05 Relisted — BRIGHT MLS
- 2023-09-01 Listing Removed — BRIGHT MLS
- 2023-08-30 Listed $133,000 BRIGHT MLS
- 2023-07-29 Rental Removed $1,600 BRIGHTMLS
- 2023-07-29 Pending — BRIGHT MLS
- 2023-07-29 Listing Removed — BRIGHT MLS
- 2023-07-26 Listed for Rent $1,600 BRIGHTMLS
- 2023-07-25 Listed $133,000 BRIGHT MLS
- 2023-06-06 Sold (Public Records) $96,000 Public Records
- 2023-06-06 Listing Removed — BRIGHT MLS
- 2023-05-01 Contingent — BRIGHT MLS
- 2023-04-16 Price Changed $133,000 BRIGHT MLS
- 2023-04-02 Listed $138,000 BRIGHT MLS
- 2019-05-06 Sold (Public Records) $36,000 Public Records
- 1986-08-20 Sold (Public Records) $35,000 Public Records
Property tax history
-0.2%/yrLatest (2025): $2,471 · +6.5% YoY. Source: county tax records.
Cash-flow waterfall
monthlySold comps — $/sqft
last 12 mo · ≤1 miLoading sold comps…