 Multi-family
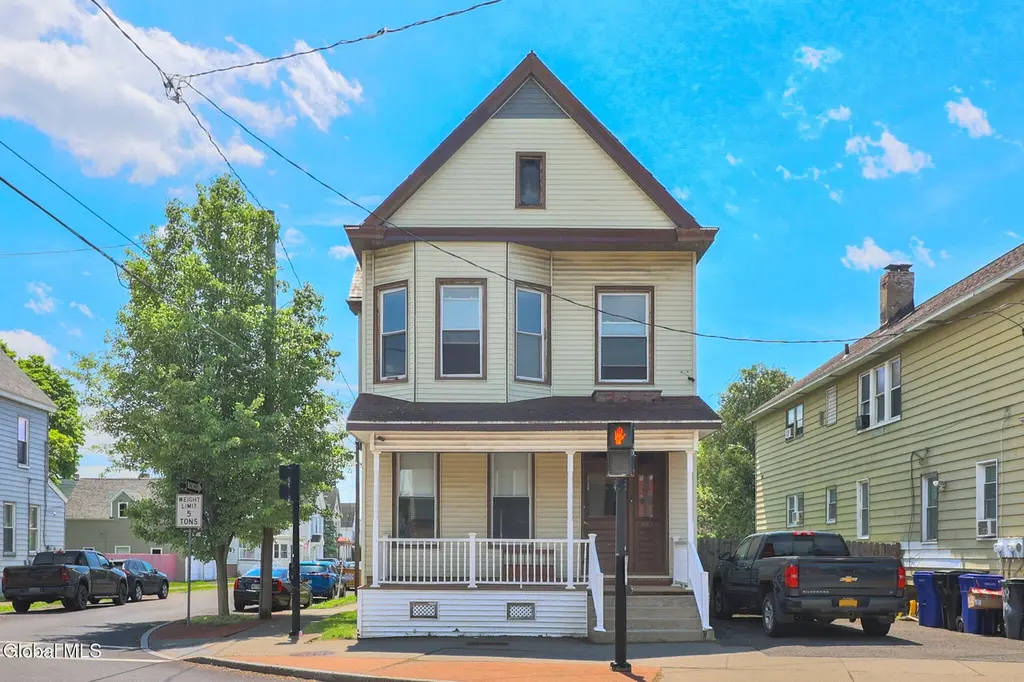
900 19th St · Watervliet, NY
Flood risk 1/10 · Minimal
- FEMA flood zone
- X (unshaded)
- Chance of flooding over 30 yrs
- 0.0%
- Est. flood insurance / yr
- $473 – $860
Fire risk 1/10 · Minimal
- Est. fire insurance / yr
- $691 – $1,283
Heat risk 4/10 · Minor
- Hot days now (above 96°F)
- 7 days/yr
- Hot days in 30 yrs
- 17 days/yr
Wind risk 3/10 · Minor
- Chance of severe wind over 30 yrs
- 6.0%
Air-quality risk 2/10 · Minimal
- Unhealthy air days now
- 0 days/yr
- Unhealthy air days in 30 yrs
- 1 days/yr
Risk factors via First Street. Map © Google.
Why this score? — see what drove the C grade
The composite is a weighted blend of 9 inputs, each scored 0–100. Each bar is that input's sub-score; the figure is the points it added to the 100-point composite (weight × sub-score).
- Cash flow +26.1/30.0
- DSCR +8.8/10.0
- 1% rule +6.6/10.0
- Rent growth +4.2/5.0
- Livability +4.2/5.0
- Schools +3.4/10.0
- Condition / age +2.5/5.0
- ARV discount +0.0/15.0
- Appreciation +0.0/10.0
$320,000
🖨 Deal sheet 📄 Offer letter ✓ Due diligence
Multi-family units
County records classify this as Multi-Family (2-4 Unit). Listing-text estimate: 1 unit. estimate disagrees with records
Listing remarks
Family owned and occupied for over 60 years and it shows. Both units are empty and ready to be lived in or rented. 2 large 3BR units including a first floor apartment with an extra half bath/laundry room. New kitchen on first floor and newer appliances in both units. Amazing owner occupy or investment potential. Corner lot with plenty of parking on side street. Showings start Friday, May 22nd
Key facts
- New kitchen
- Laundry room
- Newer appliances
Tags
Property features AI
Finance
- Other: Satellite dish
- Financial info: Two-unit multifamily property; tenants pay heat and electricity
Exterior
- Security: Smoke detectors; Carbon monoxide detectors
- Utilities: Public water; Public sewer; Cable available
- Home design: Duplex
- Construction: Built with block, brick and vinyl siding; Foundation of block, brick/mortar and combination; Slate and asphalt roof
- Exterior features: Deck; Front porch; Cleared corner lot; Privacy, vinyl and wood fencing in backyard
Interior
- Bedrooms: Two 3-bedroom units (each unit has 3 bedrooms)
- Flooring: Tile; Carpet; Hardwood; Laminate; Linoleum
- Bathrooms: Two full bathrooms and one half bathroom total; Full baths located on first and second levels; half bath on first level
- Heating & cooling: Hot water heating
- Interior features: Unfinished basement; Smoke and carbon monoxide detectors
- Laundry & utility: Washer hookup; Electric dryer hookup
Neighborhood map
What this means for you Summary
Snapshot
- This is a 6-bed/2.0-bath multifamily listed at $320k.
Deal economics
- At list price, monthly cash flow is $808 ($10k/yr) — positive.
- The deal already cash-flows at list — no discount required.
- Meets the 1% rule at list price ($4k rent vs $320k).
- Cap rate 9.3% vs local median 5.9% in Watervliet — top-decile yield for the area; either an underpriced asset or a hidden risk that comps aren't pricing in. Stress-test before assuming the spread holds.
Location & tenants
- Location reads 84/100 on livability (#51 in NY, #786 nationally) — a professional / high-income tenant draw. Strengths: amenities A+, housing A+, health & safety A+; Watch: crime D+, schools D.
- Watervliet City School District (suburban): math 36% / reading 45% proficiency, ranked #524 of 590 in NY (top 89%) — families likely to look elsewhere, expect single-tenant / working-renter base with shorter leases.
- Market conditions: Rents rising fast (+6.6%/yr); 72 active listings in the ZIP; 675 units permitted in Albany County in 2024 (451 in 5+ unit buildings).
- At $3,727/mo this rent would consume 69% of the median local household income ($65k/yr) (locally 1224% of renters already pay >50% of income on rent) — very limited rent-growth headroom before tenants either downsize or default.
Forward outlook
- Local home prices are declining (-3.0%/yr); year-one equity from $2k of loan paydown is wiped out by about $10k of value loss. Plan a longer hold.
- Albany County population projected at +9% by 2050 — modest demand growth; plan on rents tracking national, not racing it.
- At projected returns (-3.0% appreciation + 6.6% rent growth), your $90k cash investment doubles in ~8 years — after that, you're playing with house money.
Negotiation context
- Only 5 days on market — expect competitive offers; lowballing is unlikely to land.
Risks & watch-outs
- Watch-outs: built in 1920 — expect roof / HVAC / electrical / plumbing capex.
Questions for the listing agent
- Built in 1920 — when were the roof, HVAC, electrical panel, plumbing, and water heater last replaced?
- Is there a deadline driving the sale (1031 exchange, divorce, estate, relocation)? That informs how much negotiation room exists.
- Schools are D-rated, which usually means shorter tenancies and higher turnover. Who's the typical renter profile here, and what's been the actual vacancy rate?
- Crime grade is D in this area — have there been break-ins, vandalism, or insurance claims at this property in the last 3 years? What carrier currently insures it and at what premium?
- What's the average days-on-market for RENTAL listings here right now (not sales)? A rising rental-DOM trend means longer vacancies and softer asking-rent achievability than the comps imply.
- What's the recent tenant-quality profile in this submarket — average credit score on applications, eviction rate, late-payment / NSF rate, and stable-employment percentage? A property-management company in the area should have these aggregated.
- How much new apartment / multifamily construction is in the pipeline within 1–3 miles? Heavy new supply (>2% of stock underway) typically softens rents 12–24 months out; light construction supports rent growth.
Investment metrics
- 1% rule
- 1.16% ✓
- Cap rate
- 9.32%
- Cash-on-cash
- 10.82%
- DSCR
- 1.48
- GRM
- 7.2
CMA / ARV
- ARV (on-the-fly)
- $262,288
- Comps found
- 12
Show comp detail 12 sales within ~0.75 mi
| Address | Dist | Beds/Ba | Sqft | Sold | Price | $/sf | Match |
|---|---|---|---|---|---|---|---|
| 902 19th St | 0.01mi | 6/2.5 | 2,560 (-5%) | 2mo | $250,000 | $98 | 87 |
| 1834 6th Ave | 0.22mi | 6/2.0 | 2,680 (-1%) | 3mo | $250,000 | $93 | 86 |
| 804 25th St | 0.26mi | 6/3.5 | 2,688 (-1%) | 6mo | $308,455 | $115 | 76 |
| 526 15th St | 0.41mi | 7/2.0 (+1) | 2,610 (-4%) | 6mo | $189,000 | $72 | 65 |
| 2344 Broadway | 0.52mi | 6/2.0 | 2,582 (-4%) | 6mo | $215,000 | $83 | 64 |
| 1525 6th Ave | 0.34mi | 5/2.0 (-1) | 2,464 (-9%) | 2mo | $240,000 | $97 | 63 |
| 2315 3rd Ave | 0.35mi | 6/2.0 | 2,334 (-14%) | 6mo | $221,100 | $95 | 56 |
| 1624 3rd Ave | 0.39mi | 5/3.0 (-1) | 2,957 (+9%) | 2mo | $330,000 | $112 | 55 |
| 204 13th St | 0.66mi | 6/3.0 | 2,794 (+3%) | 8mo | $289,900 | $104 | 53 |
| 512 16th St | 0.30mi | 7/2.5 (+1) | 3,100 (+15%) | 3mo | $287,500 | $93 | 52 |
| 2127 2nd Ave | 0.39mi | 5/2.0 (-1) | 2,345 (-13%) | 8mo | $188,000 | $80 | 48 |
| 1316 5th Ave | 0.54mi | 5/2.0 (-1) | 2,346 (-13%) | 5mo | $280,000 | $119 | 43 |
Match score weights: distance 35% · size 25% · config 20% · recency 20%. Top-matched comps best support the ARV.
Projected returns pro-forma
-3.0% appreciation · 6.61% rent growth · sell at horizon
- IRR
- 3.8%
- Equity multiple
- 1.15×
- Total profit
- $13,629
- Equity at exit
- $47,713
- IRR
- 16.4%
- Equity multiple
- 2.56×
- Total profit
- $140,159
- Equity at exit
- $27,668
Cash invested: $89,600 (down + closing). Projections, not guarantees.
Landlord ↔ Tenant lean methodology
- Overall (STATE)
- 15 Strongly Tenant-Friendly
- State New York
- 15 Strongly Tenant-Friendly · D+10
- County
- — inherits STATE
- City
- — inherits STATE
ZIP-level market 12189
- Home prices YoY
- -28.7%
- Rents YoY
- 6.6%
- Active inventory
- 72
- Price-to-rent
- 14.3×
Monthly cashflow live
- Estimated rent
- $3,727 high interval (Pro) →
- Mortgage (P&I)
- −$1,678
- Tax from tax record
- −$325 /mo · $3,902/yr
- Insurance
- −$133
- HOA
- −$0
- Vacancy / Maint / Mgmt
- −$783
- Net cashflow
- $808
Break-even live
2-unit breakdown (identical units grouped — click to expand)
| Units | Beds | Baths | Est. rent |
|---|---|---|---|
| 2× units | 3 | 1.5 | $3,728 |
| #1 | 3 | 1.5 | $1,864 |
| #2 | 3 | 1.5 | $1,864 |
| Total (2 units) | $3,727 | ||
UW: 25.0% down · 7.5% · 30yr · 1.5% tax · 5.0% vac · 8.0% maint · 8.0% mgmt
Financing live
Cash to close
- Down payment
- $80,000
- Closing costs
- $9,600
- Reserves months
- —
- Total cash needed
- —
Loan-product check · same deal, 3 products live
Conventional
25% down · 7.5% · 30yr
- Down + closing
- —
- Monthly P&I
- —
- Monthly cashflow
- —
- DSCR
- —
- Eligible?
- —
Personal DTI + credit; lowest rate.
DSCR
20% down · 8.5% · 30yr
- Down + closing
- —
- Monthly P&I
- —
- Monthly cashflow
- —
- DSCR
- —
- Eligible?
- —
No personal income docs; deal must DSCR.
Hard money
10% down · 12.0% · 12mo
- Down + closing
- —
- Monthly P&I
- —
- Monthly cashflow
- —
- DSCR
- —
- Eligible?
- —
Short-term bridge; refi at stabilization.
Listing history 1 events
-
2026-05-20$320,000 Active
ⓘ Source: listings_history table (triggers on properties + properties_extension) + one-shot
backfill from property_details.listing_events for pre-trigger history.
Tax reassessment forecast NY · Partial reset (capped growth)
- Current annual tax
- $3,902 · $325/mo
- Projected year-2 tax
- $4,655 · $388/mo
- Expected delta
- +$753/yr (+$63/mo · 19.3%)
ⓘ Screening estimate from a state-policy table — verify with the county assessor before closing.
Climate risk First Street
- Flood 1/10 Low FEMA zone X (unshaded) · 0% chance over 30 yrs
- Wildfire 1/10 Low
- Heat 4/10 Moderate 7 d/yr ≥96°F today · 17 d/yr by 30 yrs out
- Wind 3/10 Moderate 6% chance of damaging wind over 30 yrs
- Air quality 2/10 Low 0 unhealthy d/yr today · 1 by 30 yrs out
Nearby sold comps map
Loading sold comps map…
Walkable amenities ~0.75 mi
Loading nearby amenities…
Taxation est. · year 1
- Rental income
- $44,724
- − Mortgage interest
- −$17,925
- − Property taxes
- −$3,902
- − Insurance
- −$1,600
- − Repairs & maintenance
- −$3,578
- − Management
- −$3,578
- − Depreciation
- −$9,309
- Taxable income
- $4,832
- Est. tax owed @ 24.0%
- −$1,160
- After-tax cash flow
- $8,533/yr
For passive investors: Depreciation is non-cash, so a rental often shows a tax loss while cash-flowing — sheltering income. Rental losses are passive: they offset passive income freely, and up to $25,000/yr can offset ordinary (W-2) income if you actively participate and your MAGI is under $100k (phasing out to $0 by $150k); unused losses carry forward. On sale, claimed depreciation is recaptured at up to 25%, and gains may owe capital-gains tax (a 1031 exchange can defer both). Figures are a year-1 estimate at your 24.0% rate — not tax advice; consult a CPA.
Schools (NCES district)
- District
- Watervliet City School District
- NCES district ID
- 3630210
- Math proficiency
- 36% ▼ -2.00%
- Reading proficiency
- 45% ▬ 0.00%
- Median HH income
- $43,276
- Composite
- 34.23/100
- National rank
- #5261
- State rank
- #524 of 590 in NY
Livability — Watervliet
- Score
- 84/100
- State rank
- #51
- US rank
- #786
Category grades
Schools grade is shown separately in the Schools card above.
Census & demographics
- Census place
- Watervliet, NY
- County
- Albany County · 196,626 people
- City population
- 18,656
- Metro
- Albany-Schenectady-Troy, NY
- Population (ZIP)
- 18,656
- Household income
- $65,276
- Rent vs Own
- Severe rent burden
- 1224.0
Population outlook (Albany County) Hauer SSP2
- Today (2025)
- 320,794 people
- By 2030
- 327,401 · +2.1%
- By 2040
- 338,218 · +5.4%
- By 2050
- 348,467 · +8.6%
- By 2075
- 381,693 · +19.0%
- By 2100
- 393,809 · +22.8%
Race, ethnicity, and origin ACS 2023
- Neighborhood character
- Predominantly White (72%)
- Race & ethnicity
- White 72% Two or more races 8% Asian 8% Black 8% Hispanic / Latino 6%
- Hispanic origin (detail)
- Mexican 2% Puerto Rican 2% Dominican 1%
- Common ancestry
- Lithuanian 6% Romanian 5% Scotch-Irish 4%
- Foreign-born
- 11% · Canada, China, South Korea
- Languages at home
- 88% English-only · Other Indo-European 4% Spanish 2% Other Asian/Pacific 2%
Political lean MEDSL · Albany
- 2024 margin
- Strong D (+25.8) · D 62.9% · R 37.1%
- 2008→2024 swing
- -3.6pp toward R · 2008: 29.4pp · 2024: 25.8pp
- All cycles
- 2024: D+25.8 2020: D+31.4 2016: D+24.3 2012: D+31.0 2008: D+29.4
Not yet ingested
- Civics
- —
Market trends
- HPI YoY
- ▼ -110.16%
- Current HPI
- 273.8109
- Rent YoY
- ▲ 6.61%
- Metro
- Albany-Schenectady-Troy, NY
- State GDP YoY
- ▲ 2.60%
- F500 in state
- 92
Industry mix (Fortune 500 HQ in NY)
| Industry | F500 HQs | Revenue |
|---|---|---|
| Financial Services | 10 | $950B |
|
||
| Consumer Goods | 9 | $162B |
|
||
| Insurance | 4 | $225B |
|
||
| Telecommunications | 2 | $144B |
|
||
| Pharmaceuticals | 2 | $112B |
|
||
| Media / Entertainment | 2 | $69B |
|
||
Price history
1 event — show timeline
- 2026-05-20 Listed $320,000 Global MLS
Property tax history
+6.7%/yrLatest (2025): $3,902 · +25.5% YoY. Source: county tax records.
Cash-flow waterfall
monthlySold comps — $/sqft
last 12 mo · ≤1 miLoading sold comps…