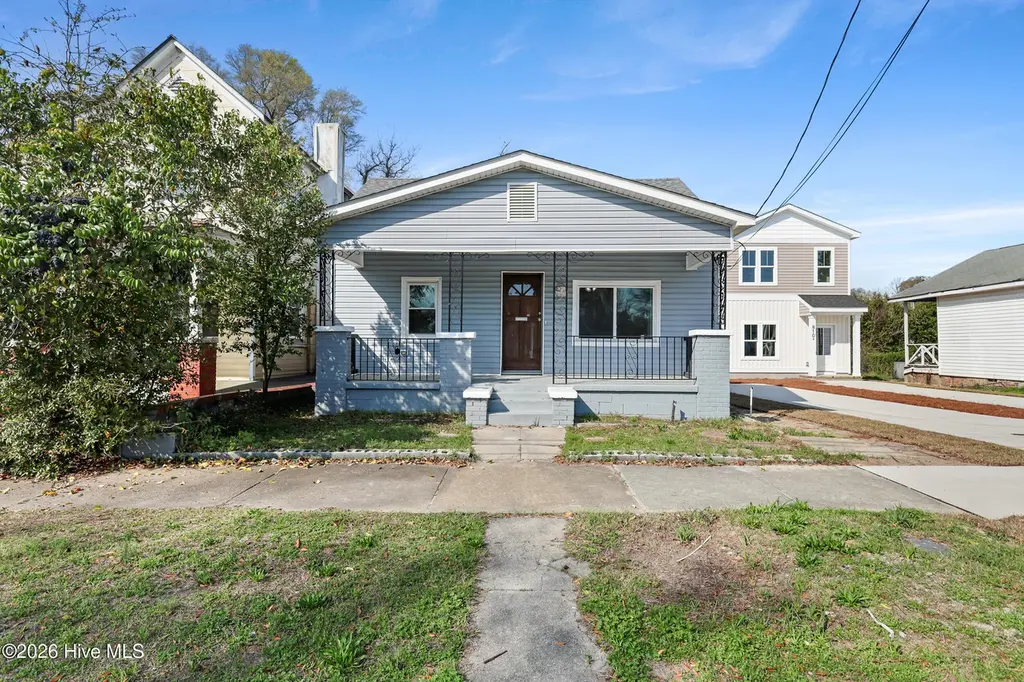
812 S 8th St · Wilmington, NC
Flood risk 1/10 · Minimal
- FEMA flood zone
- X (unshaded)
- Chance of flooding over 30 yrs
- 0.0%
- Est. flood insurance / yr
- $507 – $1,088
Fire risk 4/10 · Minor
- Est. fire insurance / yr
- $906 – $1,684
Heat risk 9/10 · Severe
- Hot days now (above 105°F)
- 7 days/yr
- Hot days in 30 yrs
- 19 days/yr
Wind risk 8/10 · Major
- Chance of severe wind over 30 yrs
- 99.0%
Air-quality risk 2/10 · Minimal
- Unhealthy air days now
- 1 days/yr
- Unhealthy air days in 30 yrs
- 1 days/yr
Risk factors via First Street. Map © Google.
Why this score? — see what drove the D+ grade
The composite is a weighted blend of 9 inputs, each scored 0–100. Each bar is that input's sub-score; the figure is the points it added to the 100-point composite (weight × sub-score).
- ARV discount +15.0/15.0
- Cash flow +12.1/30.0
- Schools +4.3/10.0
- DSCR +3.6/10.0
- Livability +3.5/5.0
- Condition / age +2.5/5.0
- Rent growth +2.4/5.0
- 1% rule +2.2/10.0
- Appreciation +0.0/10.0
$250,000
🖨 Deal sheet 📄 Offer letter ✓ Due diligence
Listing remarks MLS
This is a nice , 3 bedrooms, 1.5 bath home, hardwood floors, clean and ready to move in, large lot, close to downtown Wilmington, NC
Key facts
- Stylish backsplash
- 5,445 sq ft lot
- Built 1940
Tags
Property features AI
Finance
- HOA & community: No association amenities
Exterior
- Parking: On-street parking
- Utilities: Public water; Sewer connected; Water connected
- Home design: Single family residence; One story
- Construction: Vinyl siding and frame construction; Shingle roof; Built with crawl space foundation
- Exterior features: Covered patio/porch; Deck; Front porch; Partial fencing; Has a view; Paved road access
Interior
- Kitchen: Refrigerator; Range; Dishwasher; Microwave
- Bedrooms: 5 total rooms (includes bedrooms and other living spaces)
- Flooring: Wood flooring
- Bathrooms: 2 full bathrooms; Accessible full bathroom
- Heating & cooling: Heat pump; Natural gas heating; Has cooling
- Interior features: Ceiling fans; Window coverings; Crawl space basement
- Laundry & utility: Laundry closet
Neighborhood map
What this means for you Summary
Snapshot
- This is a 2-bed/1.5-bath single-family listed at $250k.
Deal economics
- At list price, monthly cash flow is $-53 ($-638/yr) — negative.
- To cash-flow at today's rent, offer at most $241k (3.8% below list).
- To meet the 1% rule (rent ≥ 1% of price), the offer needs to be $179k (28.5% below list).
- Recommended offer: $179k (28.5% below list) — sets the bar for 1% rule.
- Cap rate 6.0% vs local median 2.6% in Wilmington — top-decile yield for the area; either an underpriced asset or a hidden risk that comps aren't pricing in. Stress-test before assuming the spread holds.
Location & tenants
- Location reads 70/100 on livability (#142 in NC) — a middle-class / working-renter tenant base. Strengths: health & safety A+, cost of living B+, housing B+; Watch: amenities C-, employment C-, crime F.
- New Hanover County Schools (urban): math 48% / reading 53% proficiency, ranked #61 of 178 in NC (top 34%) — acceptable for families but not a draw, mixed tenant base, ~2y average lease.
- Zoned schools: A H Snipes Academy of Arts/Des (math 17% / reading 22%, grade F, #1,242 of 1,410 statewide, top 90%, 377 students, 99% FRL); Williston Middle (math 17% / reading 30%, grade F, #402 of 475 statewide, top 85%, 683 students, 100% FRL); John T Hoggard High (math 66% / reading 75%, grade B+, #117 of 535 statewide, top 22%, 2,226 students, 30% FRL) — zoned schools average 76% FRL vs 42% district-wide (35 pts higher); higher-poverty schools than district average — tighter screening recommended.
- Zoned-school proficiency averages 38% at this address vs 50% district-wide (-13 pts) — the specific schools serving this property underperform the New Hanover County Schools average; the district grade overstates school quality for this exact location.
- Market conditions: Rents soft (-0.5%/yr); 279 active listings in the ZIP; 31 comparable units currently listed for rent nearby; rentals at typical pace (median 21d on market — plan ~3-4 weeks tenant-placement turnaround); 2,581 units permitted in New Hanover County in 2024 (1,185 in 5+ unit buildings).
Forward outlook
- Local home prices are declining (-3.0%/yr); year-one equity from $2k of loan paydown is wiped out by about $8k of value loss. Plan a longer hold.
- New Hanover County population projected at +37% by 2050 — long-run rental-demand tailwind backs the buy-and-hold thesis.
Negotiation context
- It's been on market 90 days — a 6% lower offer ($235k) is reasonable based on typical stale-listing flexibility.
- 2 sale attempts since 10y ago; this cycle's ask has dropped $35k (12%) from the opening price — seller is motivated, your offer sets the floor, not the list.
- Current owner paid $65k; list at $250k implies a 285% gain — meaningful room to come down on a strong offer.
Risks & watch-outs
- Watch-outs: built in 1940 — expect roof / HVAC / electrical / plumbing capex.
- Climate carrying-cost: severe wind risk, 99% chance of damaging wind over 30y; extreme-heat days projected 7→19/yr by 2055 (HVAC capex compounding) — expect insurance premiums to compound above CPI over the hold.
Questions for the listing agent
- What do current leases actually rent for vs. the listed asking? Can we see a recent rent roll and the last 12 months of T-12 income?
- It's been on market 90 days. Have you received any prior offers? Is the seller open to a 28% concession, seller financing, or rate buy-down credit?
- Built in 1940 — when were the roof, HVAC, electrical panel, plumbing, and water heater last replaced?
- Why hasn't it sold? Are there any deal-killer items the seller is aware of (foundation, flood, title, zoning, code violations)?
- Is there a deadline driving the sale (1031 exchange, divorce, estate, relocation)? That informs how much negotiation room exists.
- Crime grade is F in this area — have there been break-ins, vandalism, or insurance claims at this property in the last 3 years? What carrier currently insures it and at what premium?
- The area grade is low — what's the realistic commute time and amenity access for the typical tenant pool here? Any planned neighborhood developments (good or bad) we should know about?
- What's the average days-on-market for RENTAL listings here right now (not sales)? A rising rental-DOM trend means longer vacancies and softer asking-rent achievability than the comps imply.
- What's the recent tenant-quality profile in this submarket — average credit score on applications, eviction rate, late-payment / NSF rate, and stable-employment percentage? A property-management company in the area should have these aggregated.
- How much new for-sale + rental construction is in the pipeline within 1–3 miles? Heavy new supply typically softens prices + rents 12–24 months out; constrained supply supports both.
Investment metrics
- 1% rule
- 0.72% ✗
- Cap rate
- 6.04%
- Cash-on-cash
- -0.91%
- DSCR
- 0.96
- GRM
- 11.7
CMA / ARV
- ARV (on-the-fly)
- $326,040
- Comps found
- 12
Show comp detail 12 sales within ~0.75 mi
| Address | Dist | Beds/Ba | Sqft | Sold | Price | $/sf | Match |
|---|---|---|---|---|---|---|---|
| 1110 Queen St | 0.30mi | 3/2.0 (+1) | 1,117 (-2%) | 1mo | $355,000 | $318 | 75 |
| 616 S 7th St | 0.18mi | 2/1.0 | 995 (-13%) | 0mo | $177,750 | $179 | 68 |
| 317 S 15th St | 0.70mi | 2/1.5 | 1,144 (+0%) | 1mo | $280,000 | $245 | 66 |
| 1318 Church St | 0.54mi | 3/2.0 (+1) | 1,150 (+1%) | 1mo | $239,000 | $208 | 65 |
| 514 Church St | 0.34mi | 2/2.0 | 1,030 (-10%) | 2mo | $405,000 | $393 | 64 |
| 617 S 9th St | 0.19mi | 3/1.5 (+1) | 993 (-13%) | 2mo | $299,900 | $302 | 63 |
| 1120 S 3rd St | 0.48mi | 2/1.0 | 1,229 (+8%) | 1mo | $350,000 | $285 | 62 |
| 503 S Front St | 0.59mi | 2/1.5 | 1,219 (+7%) | 3mo | $523,500 | $429 | 58 |
| 1116 S 3rd St | 0.47mi | 2/1.0 | 994 (-13%) | 1mo | $297,000 | $299 | 54 |
| 123 S 10th St | 0.60mi | 3/2.0 (+1) | 1,080 (-5%) | 3mo | $260,000 | $241 | 54 |
| 118 S 13th St | 0.71mi | 3/2.0 (+1) | 1,048 (-8%) | 2mo | $300,000 | $286 | 45 |
| 311 S 15th St | 0.70mi | 2/1.0 | 970 (-15%) | 1mo | $222,000 | $229 | 40 |
Match score weights: distance 35% · size 25% · config 20% · recency 20%. Top-matched comps best support the ARV.
Projected returns pro-forma
-3.0% appreciation · 0.0% rent growth · sell at horizon
- IRR
- -20.7%
- Equity multiple
- 0.30×
- Total profit
- $-49,268
- Equity at exit
- $37,276
- IRR
- -21.2%
- Equity multiple
- 0.03×
- Total profit
- $-68,050
- Equity at exit
- $21,615
Cash invested: $70,000 (down + closing). Projections, not guarantees.
Landlord ↔ Tenant lean methodology
- Overall (STATE)
- 85 Strongly Landlord-Friendly
- State North Carolina
- 85 Strongly Landlord-Friendly · R+3
- County
- — inherits STATE
- City
- — inherits STATE
ZIP-level market 28401
- Rents YoY
- -0.5%
- Active inventory
- 279
- Price-to-rent
- 11.7×
Monthly cashflow live
- Estimated rent
- $1,788 high interval (Pro) →
- Mortgage (P&I)
- −$1,311
- Tax from tax record
- −$50 /mo · $602/yr
- Insurance
- −$104
- HOA
- −$0
- Vacancy / Maint / Mgmt
- −$375
- Net cashflow
- $-53
Break-even live
UW: 25.0% down · 7.5% · 30yr · 1.5% tax · 5.0% vac · 8.0% maint · 8.0% mgmt
Financing live
Cash to close
- Down payment
- $62,500
- Closing costs
- $7,500
- Reserves months
- —
- Total cash needed
- —
Loan-product check · same deal, 3 products live
Conventional
25% down · 7.5% · 30yr
- Down + closing
- —
- Monthly P&I
- —
- Monthly cashflow
- —
- DSCR
- —
- Eligible?
- —
Personal DTI + credit; lowest rate.
DSCR
20% down · 8.5% · 30yr
- Down + closing
- —
- Monthly P&I
- —
- Monthly cashflow
- —
- DSCR
- —
- Eligible?
- —
No personal income docs; deal must DSCR.
Hard money
10% down · 12.0% · 12mo
- Down + closing
- —
- Monthly P&I
- —
- Monthly cashflow
- —
- DSCR
- —
- Eligible?
- —
Short-term bridge; refi at stabilization.
Rent comps 31 comps
| Address | Beds | Baths | Sqft | Rent | $/sqft | DOM | Units | Dist |
|---|---|---|---|---|---|---|---|---|
| 1009 S 6th St Wilmington, NC | 3.0 | 1.0 | 1482 | $1,650 | $1.11 | 13d | 1 | 0.20mi |
| 607 S 11th St Unit 208 Wilmington, NC | 2.0 | 2.0 | 960 | $1,585 | $1.65 | 13d | 1 | 0.32mi |
| 506 S 7th St Wilmington, NC | 3.0 | 1.0 | 1250 | $1,800 | $1.44 | 13d | 1 | 0.32mi |
| 506 S 7th St Wilmington, NC | 3.0 | 1.0 | 1250 | $1,800 | $1.44 | 20d | 1 | 0.32mi |
| 1102 Castle St Unit 201 Wilmington, NC | 2.0 | 2.0 | 748 | $1,450 | $1.94 | 13d | 1 | 0.33mi |
| 511 S 10th St Unit 1 Wilmington, NC | 3.0 | 2.0 | 1200 | $2,000 | $1.67 | 13d | 1 | 0.33mi |
| 1108 Castle St #112 Wilmington, NC | 1.0 | 1.0 | 750 | $1,500 | $2.00 | 20d | 1 | 0.34mi |
| 1108 Castle St #106 Wilmington, NC | 2.0 | 2.0 | 900 | $1,625 | $1.81 | 20d | 1 | 0.34mi |
| 418 S 8th St Wilmington, NC | 2.0 | 1.0 | 873 | $2,200 | $2.52 | 13d | 1 | 0.36mi |
| 715 S 13th St Wilmington, NC | 3.0 | 2.0 | 936 | $2,300 | $2.46 | 20d | 1 | 0.40mi |
| 618 S 3rd St #2 Wilmington, NC | 2.0 | 2.0 | 1000 | $1,750 | $1.75 | 20d | 1 | 0.44mi |
| 1104 S 2nd St Wilmington, NC | 1.0 | 1.0 | 1200 | $1,400 | $1.17 | 20d | 1 | 0.52mi |
| 422 S 3rd St Wilmington, NC | 2.0 | 1.0 | 734 | $1,550 | $2.11 | 13d | 1 | 0.53mi |
| 301 Martin St Wilmington, NC | 2.0 | 2.5 | 1036 | $2,400 | $2.32 | 20d | 1 | 0.58mi |
| 1519 Lake Branch Dr Wilmington, NC | 1.0–3.0 | 1.0 | 720 | $1,125 | $1.56 | 20d | 1 | 0.63mi |
| 1400 S 2nd St Wilmington, NC | 1.0–2.0 | 1.0–2.5 | 956 | $2,533 | $2.65 | 13d | 13 | 0.65mi |
| 208 West Dr Wilmington, NC | 3.0 | 2.0 | 1293 | $1,900 | $1.47 | 20d | 1 | 0.66mi |
| 106 Ann St Wilmington, NC | 2.0 | 2.5 | 1150 | $2,450 | $2.13 | 20d | 1 | 0.72mi |
| 1704 Church St Wilmington, NC | 2.0 | 2.0 | 830 | $1,475 | $1.78 | 20d | 1 | 0.76mi |
| 420 Market St Wilmington, NC | 1.0–3.0 | 1.0 | 935 | $1,425 | $1.52 | 13d | 1 | 0.79mi |
| 1625 S 17th St Wilmington, NC | 2.0 | 1.0–2.0 | 920 | $2,097 | $2.28 | 13d | 29 | 0.94mi |
| 1904 Perry Ave Wilmington, NC | 2.0 | 1.0 | 1017 | $2,500 | $2.46 | 20d | 1 | 1.11mi |
| 14 Grace St Wilmington, NC | 1.0–2.0 | 1.0–2.0 | 1041 | $2,347 | $2.25 | 13d | 3 | 1.11mi |
| 2247 Wrightsville Ave Wilmington, NC | 3.0 | 1.0–2.0 | 753 | $1,363 | $1.81 | 13d | 9 | 1.19mi |
| 705 Brooks Aly Wilmington, NC | 2.0 | 3.0 | 1308 | $1,950 | $1.49 | 20d | 1 | 1.21mi |
| 524 N 2nd St Wilmington, NC | 2.0 | 2.0 | 1000 | $1,450 | $1.45 | 20d | 1 | 1.29mi |
| 505 Alpine Dr Wilmington, NC | 1.0–3.0 | 1.0–2.0 | 1009 | $1,454 | $1.44 | 13d | 9 | 1.31mi |
| 709 N 11th St Wilmington, NC | 2.0 | 1.0 | 800 | $1,475 | $1.84 | 20d | 1 | 1.33mi |
| 805 N 4th St Unit 201 Wilmington, NC | 2.0 | 2.0 | 1200 | $2,000 | $1.67 | 20d | 1 | 1.45mi |
| 814 N 3rd St Wilmington, NC | 2.0 | 2.0 | 1009 | $1,692 | $1.68 | 13d | 3 | 1.47mi |
| 507 Bladen St Wilmington, NC | 2.0 | 2.0 | 1222 | $2,500 | $2.05 | 20d | 1 | 1.49mi |
Listing history 21 events
-
2026-06-18days on market $250,000 Active 90 DOM
-
2026-06-17days on market $250,000 Active 89 DOM
-
2026-06-16days on market $250,000 Active 88 DOM
-
2026-06-15days on market $250,000 Active 87 DOM
-
2026-06-14days on market $250,000 Active 85 DOM
-
2026-06-13days on market $250,000 Active 84 DOM
-
2026-06-10days on market $250,000 Active 82 DOM
-
2026-06-09days on market $250,000 Active 81 DOM
-
2026-06-08days on market $250,000 Active 80 DOM
-
2026-06-07days on market $250,000 Active 79 DOM
-
2026-06-05days on market $250,000 Active 76 DOM
-
2026-06-03days on market $250,000 Active 75 DOM
-
2026-06-03days on market $250,000 Active 74 DOM
-
2026-05-31days on market $250,000 Active 72 DOM
-
2026-05-30days on market $250,000 Active 71 DOM
-
2026-05-08price $260,000
-
2026-04-03price $270,000
-
2026-03-20$285,000 Active
-
2016-10-03soldstatus $65,000 132-char remark
Show marketing remark (132 chars)
This is a nice , 3 bedrooms, 1.5 bath home, hardwood floors, clean and ready to move in, large lot, close to downtown Wilmington, NC
-
2016-10-03soldstatus $73,000
Show marketing remark (132 chars)
This is a nice , 3 bedrooms, 1.5 bath home, hardwood floors, clean and ready to move in, large lot, close to downtown Wilmington, NC
-
2016-05-19$65,000 132-char remark
Show marketing remark (132 chars)
This is a nice , 3 bedrooms, 1.5 bath home, hardwood floors, clean and ready to move in, large lot, close to downtown Wilmington, NC
ⓘ Source: listings_history table (triggers on properties + properties_extension) + one-shot
backfill from property_details.listing_events for pre-trigger history.
Tax reassessment forecast NC · Resets to sale price
- Current annual tax
- $602 · $50/mo
- Projected year-2 tax
- $2,050 · $171/mo
- Expected delta
- +$1,448/yr (+$121/mo · 240.8%)
ⓘ Screening estimate from a state-policy table — verify with the county assessor before closing.
Climate risk First Street
- Flood 1/10 Low FEMA zone X (unshaded) · 0% chance over 30 yrs
- Wildfire 4/10 Moderate
- Heat 9/10 Extreme 7 d/yr ≥105°F today · 19 d/yr by 30 yrs out
- Wind 8/10 Severe 99% chance of damaging wind over 30 yrs
- Air quality 2/10 Low 1 unhealthy d/yr today · 1 by 30 yrs out
Nearby sold comps map
Loading sold comps map…
Walkable amenities ~0.75 mi
Loading nearby amenities…
Taxation est. · year 1
- Rental income
- $21,451
- − Mortgage interest
- −$14,004
- − Property taxes
- −$602
- − Insurance
- −$1,250
- − Repairs & maintenance
- −$1,716
- − Management
- −$1,716
- − Depreciation
- −$7,273
- Taxable loss
- −$5,109
- Est. tax savings @ 24.0%
- +$1,226
- After-tax cash flow
- $589/yr
For passive investors: Depreciation is non-cash, so a rental often shows a tax loss while cash-flowing — sheltering income. Rental losses are passive: they offset passive income freely, and up to $25,000/yr can offset ordinary (W-2) income if you actively participate and your MAGI is under $100k (phasing out to $0 by $150k); unused losses carry forward. On sale, claimed depreciation is recaptured at up to 25%, and gains may owe capital-gains tax (a 1031 exchange can defer both). Figures are a year-1 estimate at your 24.0% rate — not tax advice; consult a CPA.
Schools (NCES district)
- District
- New Hanover County Schools
- NCES district ID
- 3703330
- Math proficiency
- 48% ▼ -3.00%
- Reading proficiency
- 53% ▬ 0.00%
- Median HH income
- $49,406
- Composite
- 43.13/100
- National rank
- #3081
- State rank
- #61 of 178 in NC
Livability — Wilmington
- Score
- 70/100
- State rank
- #142
- US rank
- #8131
Category grades
Schools grade is shown separately in the Schools card above.
Census & demographics
- Census place
- Wilmington, NC
- County
- New Hanover County · 232,153 people
- City population
- 215,355
- Metro
- Wilmington, NC
- Population (ZIP)
- 22,007
- Household income
- $57,968
- Rent vs Own
- Severe rent burden
- 1696.0
Population outlook (New Hanover County) Hauer SSP2
- Today (2025)
- 259,517 people
- By 2030
- 279,586 · +7.7%
- By 2040
- 318,223 · +22.6%
- By 2050
- 354,831 · +36.7%
- By 2075
- 437,158 · +68.5%
- By 2100
- 486,769 · +87.6%
Race, ethnicity, and origin ACS 2023
- Neighborhood character
- Diverse neighborhood (Simpson 0.61)
- Race & ethnicity
- White 52% Black 33% Hispanic / Latino 9% Two or more races 7%
- Hispanic origin (detail)
- Mexican 5% Puerto Rican 1%
- Common ancestry
- Romanian 2% Serbian 2% Lithuanian 2%
- Foreign-born
- 6% · Canada
- Languages at home
- 91% English-only · Spanish 7% Other Indo-European 1%
Political lean MEDSL · New Hanover
- 2024 margin
- Toss-up / Even · D 49.8% · R 49.1% · Other 1.1%
- 2008→2024 swing
- +2.0pp toward D · 2008: -1.4pp · 2024: 0.6pp
- All cycles
- 2024: D+0.6 2020: D+2.1 2016: R+4.1 2012: R+4.7 2008: R+1.4
Not yet ingested
- Civics
- —
Market trends
- HPI YoY
- ▼ -309.34%
- Current HPI
- 293.4396
- Rent YoY
- ▼ -0.52%
- Metro
- Wilmington, NC
- State GDP YoY
- ▲ 3.28%
- F500 in state
- 26
Industry mix (Fortune 500 HQ in NC)
| Industry | F500 HQs | Revenue |
|---|---|---|
| Financial Services | 2 | $213B |
|
||
| Retail | 2 | $95B |
|
||
| Industrial Conglomerate | 1 | $38B |
|
||
| Metals / Steel | 1 | $35B |
|
||
| Utilities | 1 | $30B |
|
||
| Industrial Machinery | 1 | $19B |
|
||
Price history
+300.0% since first listed6 events — show timeline
- 2026-05-08 Price Changed $260,000 Hive MLS
- 2026-04-03 Price Changed $270,000 Hive MLS
- 2026-03-20 Listed $285,000 Hive MLS
- 2016-10-03 Sold (Public Records) $73,000 Public Records
- 2016-10-03 Sold (MLS) $65,000 Hive MLS
- 2016-05-19 Listed $65,000 Hive MLS
Property tax history
+0.4%/yrLatest (2025): $602 · -55.4% YoY. Source: county tax records.
Cash-flow waterfall
monthlySold comps — $/sqft
last 12 mo · ≤1 miLoading sold comps…