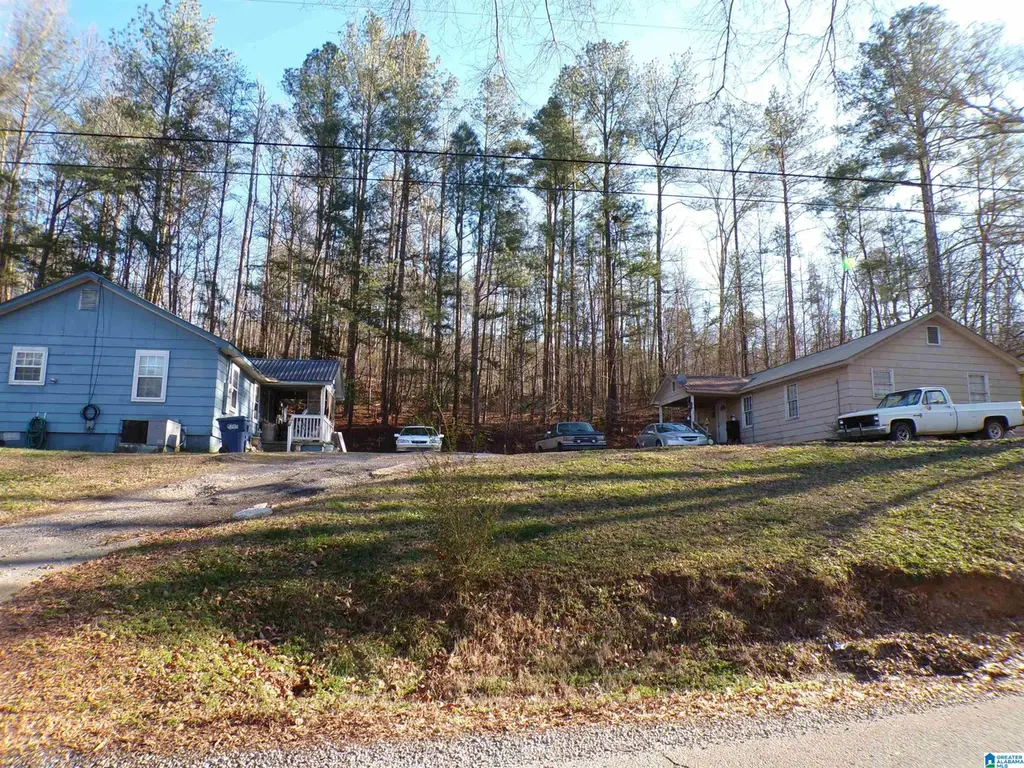
911 Patton Rd · Oneonta, AL
Flood risk No data
- FEMA flood zone
- —
- Chance of flooding over 30 yrs
- —
- Est. flood insurance / yr
- —
Fire risk No data
- Est. fire insurance / yr
- —
Heat risk No data
- Hot days now (above threshold)
- —
- Hot days in 30 yrs
- —
Wind risk No data
- Chance of severe wind over 30 yrs
- —
Air-quality risk No data
- Unhealthy air days now
- —
- Unhealthy air days in 30 yrs
- —
Risk factors via First Street. Map © Google.
Why this score? — see what drove the D+ grade
The composite is a weighted blend of 9 inputs, each scored 0–100. Each bar is that input's sub-score; the figure is the points it added to the 100-point composite (weight × sub-score).
- ARV discount +15.0/15.0
- Cash flow +10.4/30.0
- Appreciation +7.9/10.0
- Schools +3.4/10.0
- 1% rule +3.1/10.0
- DSCR +3.0/10.0
- Livability +3.0/5.0
- Rent growth +2.5/5.0
- Condition / age +1.0/5.0
$107,000
🖨 Deal sheet 📄 Offer letter ✓ Due diligence
Listing remarks MLS
Great investment property, two homes for the price of one, 911 and 931 Patton Road.
Key facts
- 0.5 acre lot
- Built 1960
- Listed 24 days
Neighborhood map
What this means for you Summary
Snapshot
- This is a 2-bed/1.0-bath single-family listed at $107k. Condition is rated poor.
Deal economics
- At list price, monthly cash flow is $-58 ($-692/yr) — negative.
- To cash-flow at today's rent, offer at most $99k (7.8% below list).
- To meet the 1% rule (rent ≥ 1% of price), the offer needs to be $86k (19.3% below list).
- Recommended offer: $86k (19.3% below list) — sets the bar for 1% rule.
- Cap rate 5.6% vs local median 2.2% in Oneonta — top-decile yield for the area; either an underpriced asset or a hidden risk that comps aren't pricing in. Stress-test before assuming the spread holds.
Location & tenants
- Location reads 59/100 on livability (#337 in AL) — a working-class tenant base; expect higher turnover. Strengths: cost of living A+, housing B+; Watch: schools D, employment D, amenities F.
- Oneonta City (rural): math 27% / reading 55% proficiency, ranked #25 of 129 in AL (top 19%) — families likely to look elsewhere, expect single-tenant / working-renter base with shorter leases.
- Market conditions: 94 active listings in the ZIP; 13 units permitted in Blount County in 2024 (0 in 5+ unit buildings).
Forward outlook
- In year one you build about $7k of equity ($740 loan paydown + $6k appreciation (5.7% local appreciation)).
- Blount County population projected to shrink 8% by 2050 — rents likely to lag national; underwrite the cash flow, not the appreciation.
- At projected returns (5.7% appreciation + 3.0% rent growth), your $30k cash investment doubles in ~5 years — after that, you're playing with house money.
- By year 5, paydown + projected appreciation supports a ~$30k cash-out refi (75% LTV) — recoverable capital for the next deal without selling this one.
Negotiation context
- It's been on market 24 days — a 2% lower offer ($105k) is reasonable based on typical stale-listing flexibility.
Questions for the listing agent
- What do current leases actually rent for vs. the listed asking? Can we see a recent rent roll and the last 12 months of T-12 income?
- Have any recent inspections been done? Can we get a copy of the seller's disclosures and any deferred-maintenance estimates?
- Built in 1960 — when were the roof, HVAC, electrical panel, plumbing, and water heater last replaced?
- Is there a deadline driving the sale (1031 exchange, divorce, estate, relocation)? That informs how much negotiation room exists.
- Schools are D-rated, which usually means shorter tenancies and higher turnover. Who's the typical renter profile here, and what's been the actual vacancy rate?
- The area grade is low — what's the realistic commute time and amenity access for the typical tenant pool here? Any planned neighborhood developments (good or bad) we should know about?
- What's the average days-on-market for RENTAL listings here right now (not sales)? A rising rental-DOM trend means longer vacancies and softer asking-rent achievability than the comps imply.
- What's the recent tenant-quality profile in this submarket — average credit score on applications, eviction rate, late-payment / NSF rate, and stable-employment percentage? A property-management company in the area should have these aggregated.
- How much new for-sale + rental construction is in the pipeline within 1–3 miles? Heavy new supply typically softens prices + rents 12–24 months out; constrained supply supports both.
Investment metrics
- 1% rule
- 0.81% ✗
- Cap rate
- 5.65%
- Cash-on-cash
- -2.31%
- DSCR
- 0.90
- GRM
- 10.3
CMA / ARV
- ARV (median comp)
- $160,873
- List price
- $107,000
- Delta
- -33.49%
- Verdict
- UNDERPRICED
- Comps
- 9 within 1.0 mi
Projected returns pro-forma
5.74% appreciation · 3.0% rent growth · sell at horizon
- IRR
- 12.8%
- Equity multiple
- 1.85×
- Total profit
- $25,558
- Equity at exit
- $65,483
- IRR
- 13.5%
- Equity multiple
- 3.62×
- Total profit
- $78,547
- Equity at exit
- $117,241
Cash invested: $29,960 (down + closing). Projections, not guarantees.
Landlord ↔ Tenant lean methodology
- Overall (STATE)
- 90 Strongly Landlord-Friendly
- State Alabama
- 90 Strongly Landlord-Friendly · R+15
- County
- — inherits STATE
- City
- — inherits STATE
ZIP-level market 35121
- Home prices YoY
- 2.5%
- Active inventory
- 94
- Price-to-rent
- 10.3×
Monthly cashflow live
- Estimated rent
- $863 medium interval (Pro) →
- Mortgage (P&I)
- −$561
- Tax est. 1.5%
- −$134 /mo · $1,605/yr
- Insurance
- −$45
- HOA
- −$0
- Vacancy / Maint / Mgmt
- −$181
- Net cashflow
- $-58
Break-even live
UW: 25.0% down · 7.5% · 30yr · 1.5% tax · 5.0% vac · 8.0% maint · 8.0% mgmt
Financing live
Cash to close
- Down payment
- $26,750
- Closing costs
- $3,210
- Reserves months
- —
- Total cash needed
- —
Loan-product check · same deal, 3 products live
Conventional
25% down · 7.5% · 30yr
- Down + closing
- —
- Monthly P&I
- —
- Monthly cashflow
- —
- DSCR
- —
- Eligible?
- —
Personal DTI + credit; lowest rate.
DSCR
20% down · 8.5% · 30yr
- Down + closing
- —
- Monthly P&I
- —
- Monthly cashflow
- —
- DSCR
- —
- Eligible?
- —
No personal income docs; deal must DSCR.
Hard money
10% down · 12.0% · 12mo
- Down + closing
- —
- Monthly P&I
- —
- Monthly cashflow
- —
- DSCR
- —
- Eligible?
- —
Short-term bridge; refi at stabilization.
Listing history 2 events
-
2026-05-04status Pending 83-char remark
Show marketing remark (83 chars)
Great investment property, two homes for the price of one, 911 and 931 Patton Road.
-
2026-04-10$107,000 Active 83-char remark
Show marketing remark (83 chars)
Great investment property, two homes for the price of one, 911 and 931 Patton Road.
ⓘ Source: listings_history table (triggers on properties + properties_extension) + one-shot
backfill from property_details.listing_events for pre-trigger history.
Nearby sold comps map
Loading sold comps map…
Walkable amenities ~0.75 mi
Loading nearby amenities…
Taxation est. · year 1
- Rental income
- $10,356
- − Mortgage interest
- −$5,994
- − Property taxes
- −$1,605
- − Insurance
- −$535
- − Repairs & maintenance
- −$828
- − Management
- −$828
- − Depreciation
- −$3,113
- Taxable loss
- −$2,547
- Est. tax savings @ 24.0%
- +$611
- After-tax cash flow
- $-81/yr
For passive investors: Depreciation is non-cash, so a rental often shows a tax loss while cash-flowing — sheltering income. Rental losses are passive: they offset passive income freely, and up to $25,000/yr can offset ordinary (W-2) income if you actively participate and your MAGI is under $100k (phasing out to $0 by $150k); unused losses carry forward. On sale, claimed depreciation is recaptured at up to 25%, and gains may owe capital-gains tax (a 1031 exchange can defer both). Figures are a year-1 estimate at your 24.0% rate — not tax advice; consult a CPA.
Condition & rehab AI · 3 photos
This property requires extensive repairs and updates, including a new roof, siding repair, and interior updates. Significant investment is needed to bring it up to a livable condition.
Repairs flagged
- Major Metal roof — Significant rust and damage
- Major Siding — Weathered and missing shingles
- Major Interior walls and paint — No photos available, but likely in poor condition
Value-add opportunities
- Both New roof — Critical to prevent water damage and improve overall appearance
- Both Siding repair and painting — Enhances curb appeal and protects the home
- Both Interior painting and updates — Improves living conditions and appeal
Renovation cost estimate screening
| Repair item | Severity | Est. cost |
|---|---|---|
| Metal roof · Significant rust and damage | Major | $15,000–50,000 |
| Siding · Weathered and missing shingles | Major | $15,000–50,000 |
| Interior walls and paint · No photos available, but likely in poor condition | Major | $15,000–50,000 |
| Total estimated repair cost · 3 items | $45,000–150,000 |
Value-add ROI direction
- Both New roof — Critical to prevent water damage and improve overall appearance ↑
- Both Siding repair and painting — Enhances curb appeal and protects the home ↑
- Both Interior painting and updates — Improves living conditions and appeal ↑
ⓘ Cost ranges are severity-bucket heuristics (US national rule-of-thumb). Get contractor quotes + a written scope before underwriting a rehab budget.
Schools (NCES district)
- District
- Oneonta City
- NCES district ID
- 0102550
- Math proficiency
- 27% ▼ -34.00%
- Reading proficiency
- 55% ▲ 1.00%
- Median HH income
- $39,899
- Composite
- 34.25/100
- National rank
- #5252
- State rank
- #25 of 129 in AL
Livability — Oneonta
- Score
- 59/100
- State rank
- #337
- US rank
- #20170
Category grades
Schools grade is shown separately in the Schools card above.
Census & demographics
- Census place
- Oneonta, AL
- City population
- 16,207
- Population (ZIP)
- 16,207
Population outlook (Blount County) Hauer SSP2
- Today (2025)
- 57,983 people
- By 2030
- 57,405 · -1.0%
- By 2040
- 55,602 · -4.1%
- By 2050
- 53,393 · -7.9%
- By 2075
- 48,248 · -16.8%
- By 2100
- 44,190 · -23.8%
Race, ethnicity, and origin ACS 2023
- Neighborhood character
- Predominantly White (82%)
- Race & ethnicity
- White 82% Hispanic / Latino 14% Two or more races 5% Black 2%
- Hispanic origin (detail)
- Mexican 12%
- Common ancestry
- Slovak 1% Italian 1% Serbian 1%
- Foreign-born
- 5% · Canada
- Languages at home
- 91% English-only · Spanish 9%
Political lean MEDSL · Blount
- 2024 margin
- Solid R (+81.0) · D 9.2% · R 90.2%
- 2008→2024 swing
- -11.5pp toward R · 2008: -69.5pp · 2024: -81.0pp
- All cycles
- 2024: R+81.0 2020: R+80.0 2016: R+81.4 2012: R+74.1 2008: R+69.5
Not yet ingested
- Civics
- —
Market trends
- HPI YoY
- ▲ 5.74%
- Current HPI
- 236.6841
- Rent YoY
- —
- Metro
- —
- State GDP YoY
- ▲ 2.94%
- F500 in state
- 4
Industry mix (Fortune 500 HQ in AL)
| Industry | F500 HQs | Revenue |
|---|---|---|
| Financial Services | 1 | $8B |
|
||
| Healthcare | 1 | $5B |
|
||
Price history
2 events — show timeline
- 2026-05-04 Pending — Greater Alabama MLS
- 2026-04-10 Listed $107,000 Greater Alabama MLS
Cash-flow waterfall
monthlySold comps — $/sqft
last 12 mo · ≤1 miLoading sold comps…